

Abstract
The role of Lewy bodies, Lewy neurites and α‐synuclein (αSYN) in the pathophysiology and diagnosis of Parkinson's disease (PD) is unclear. We used postmortem human tissue, a panel of antibodies (Abs) and confocal microscopy to examine the three‐dimensional neurochemical anatomy of the nigrostriatal system. Abs were specific to truncated (tαSYN), phosphorylated and full‐length αSYN. The findings demonstrate the critical role of tαSYN in initiating aggregation, a role for other forms of αSYN in aggregate expansion, a reason for the wide variety of proteins present in different aggregates, an explanation for the laminar appearance of aggregates described historically using different methods, the existence of proximal greater than distal aggregation in the vulnerable nigrostriatal pathway, the independent transport of different forms of αSYN as cargo along axons and a possible sequence for the formation of Lewy bodies. Findings differed between incidental Lewy body disease and PD only quantitatively. These findings have implications for understanding the pathogenesis and treatment of PD.
Keywords: α‐synuclein, nucleus basalis of Meynert, Parkinson's disease, putamen, substantia nigra
INTRODUCTION
The cause(s) and pathophysiology of Parkinson's disease (PD) remain unclear 37, 38. Contributions of age, genes, environment and lifestyle are suggested 8, 32, 50, 51. PD varies in the clinical and pathologic descriptions 13, 57. Until specific subtypes are defined, it may be preferable to use a term that includes variations, such as the Parkinson's disease phenotype (PDP), or restrict this term to pathologic descriptions (56).
Mutations and modifications in α‐synuclein (αSYN) contribute to the risk of PD and various disorders 1, 9, 11, 22, 23, 33, 34, 36, 39, 44, 53, 55. Wild‐type αSYN can be harmful or beneficial 9, 34, 45, 53. We describe the intracellular and intra‐aggregate location for full‐length (flαSYN) and modified forms of αSYN and their regional distribution using postmortem brain and demonstrate the critical role of truncated αSYN (tαSYN, truncated at aa 119–124).
Incidental Lewy Body disease (ILBD) is suspected to be a presymptomatic state prior to PD 2, 14, 15, 20, 27, 59. This notion is evolving as different features are assessed between control (CTRL), ILBD and PD cases. Initially, assessment of dopamine markers was used 2, 14, 15. We confirm ILBD as a precursor to PD having two steps both containing many lesions similar to the PDP.
MATERIALS AND METHODS
Cases, tissue acquisition and processing
Formaldehyde‐fixed paraffin‐embedded (FFPE) tissue blocks or sections (5 µm) or free‐floating fixed tissue sections (40 µm) containing different regions of brain were obtained from Robert Wood Johnson University Hospital, the Harvard/Mclean Brain Tissue Resource Center (HBTRC, http://www.brainbank.mclean.org/), and the Banner Sun Health Research Institute Brain Donation Program of Sun City, Arizona (3) (http://www.bannerhealth.com/Research/Research+Institutes/Banner+Sun+Health+Research+Institute/Ways+to+Give/Donation.htm). All cases were approved for research use by their respective institutions. Only postmortem human tissue was used. Postmortem delay was generally less than 24 h. Duration of fixation and tissue processing methods varied between institutions and cases. Standard procedures for performing human brain autopsy were used. All cases received standard neuropathologic examination of tissue sections from multiple brain regions using hematoxylin & eosin (H&E) staining, special stains and immunohistochemistry (IHC) as needed. Blocks containing the putamen (Put) and nucleus basalis of Meynert (nbM) were obtained in the coronal plane. FFPE sections from the substantia nigra (SN) were obtained in the transverse plane, whereas formalin‐fixed free‐floating sections were obtained in the coronal plane.
FFPE tissue sections used for IHC were cut at a 5‐µm thickness using a rotary microtome and mounted onto charged slides. On the day of IHC, sections were deparaffinized by immersion into xylene for 3 × 10 minutes at room temperature (RT), rehydrated by transferring through graded alcohols (100% and 95% EtOH) to D2O.
Three antigen retrieval (AR) methods were examined alone or in combination (4). Heat‐induced AR (HI‐AR) occurred by incubation of sections in borate buffer (50 mM, pH 8.5) at 80°C for 60 minutes. Proteinase K (PK, Fermentas, Cat. # EO0491, Fermentas, Inc., Glen Burnie, MD, USA) AR (PK‐AR) occurred by incubation of sections with 0.6 U/mL of PK at 37°C for 30 minutes. The PK condition was selected to improve recognition of tyrosine hydroxylase (TH) using either of two anti‐TH Abs without resulting in significant distortion of tissue or nuclear morphology 14, 15. More extensive PK treatment distorted the appearance of nuclei and altered nuclear and cytoplasmic membranes. This treatment was sufficient to eliminate ∼95% of the recognition of a punctate soluble form of αSYN or synaptophysin found in terminals and increased modestly the recognition of aggregated forms of flαSYN or modified αSYN. When combined, PK was always used before HI‐AR. The formic acid (FA) method of AR (FA‐AR) involved incubating tissue sections in 90% FA at RT for 30 minutes (4). This treatment was sufficient to eliminate >90% of the recognition of a punctate soluble form of αSYN, synaptophysin, ubiquitin and TH found in terminals or axons, but does not impair the recognition of aggregations labeled with flαSYN, modified αSYN or ubiquitinated proteins (UBs). The goal of our AR methods was to improve binding of Abs to epitopes and not to determine which epitopes were sensitive or resistant to treatment. Each Ab epitope likely has unique AR characteristics requiring additional and extensive testing.
After AR, sections were blocked at RT for 30 minutes using 10% normal goat serum with 1% bovine serum albumin in carrier solution (0.3% triton X, in 50 mM phosphate buffer (PB), pH 7.4). This carrier was also used for incubation with 1° and 2° antibodies (Abs). Sections were incubated with 1° Abs (two or three simultaneously) at 4°C overnight and with 2° Abs (two or three simultaneously) at RT for 90 minutes. Sections were then counterstained using 1:1 000 000 4′,6‐diamidino‐2‐phenylindole (DAPI) in PB. Finally, Sudan black (0.5% in 70% EtOH) was used to reduce autofluorescence due to lipofuscin. Sections were coverslipped using Prolong® Antifade (Molecular Probes, #P‐7481, Eugene, OR, USA).
Thick tissue sections were cut at 40 µm using a freezing/sliding microtome and stored in a cryoprotectant with 0.1% sodium azide as a preservative at 4°C until use. On the day of labeling, sections were transferred into netwells and serially transferred through different solutions. The following sequence occurred. Sections were washed at RT in PB 3 × 10 minutes, then 3 × 20 minutes, blocked at RT in carrier as described above for 1 × 90 minutes, then incubated with 1° Abs (two or three simultaneously) at 4°C for 72 h, washed, and incubated with 2° Abs (two three simultaneously) at 4°C for 24 h. Sections were then washed and counterstained using 1:10 000 DAPI in PB 1 × 5 minutes. Sections were mounted onto slides and coverslipped using Prolong® Antifade (Molecular Probes). AR was not used as it has been previously shown not to be necessary for this tissue format (although sensitivity can be a problem as often virtually all presynaptic terminals stain with Abs against unmodified αSYN).
One FFPE section through the SN from each case was stained for H&E using an automated stainer. IHC was performed on a subset of previously quantified cases to represent different severities of the PDP (Table 1). These cases were randomly selected from all cases previously scored.
Table 1.
Demographic and morphological features of cases used in this report. Values are the mean ± SEM. Abbreviations: CTRL, control; MP, macrophage; NM, neuromelanin; PDP, the Parkinson's disease pathologic phenotype; SN, substantia nigra.
| Group (grade) | n | Age (year) | M/F | % SN sampled | NM+ neurons (all quadrants) | NM+ MPs (all quadrants) | # fields >10 NM fragments (all quadrants) |
|---|---|---|---|---|---|---|---|
| CTRL | 8 | 70.6 ± 4.4 | 6/2 | 59.8 ± 0.6 | 387.4 ± 18.3 | 13.6 ± 2.6 | 0.0 ± 0.0 |
| PDP (0b) | 6 | 71.7 ± 4.5 | 4/2 | 56.8 ± 0.8 | 347.7 ± 49.5 | 31.2 ± 11.8 | 0.0 ± 0.0 |
| PDP (0c) | 4 | 74.0 ± 5.2 | 3/1 | 56.8 ± 0.8 | 194.8 ± 34.1 | 79.0 ± 22.1 | 13.3 ± 2.3 |
| PDP (2) | 4 | 73.3 ± 3.9 | 4/0 | 59.0 ± 1.7 | 126.3 ± 8.6 | 57.5 ± 7.2 | 17.5 ± 3.6 |
| PDP (3) | 4 | 70.3 ± 5.9 | 4/0 | 59.3 ± 1.4 | 74.5 ± 11.8 | 31.3 ± 7.0 | 5.3 ± 3.0 |
Mouse brain sections were used to verify certain neurochemical morphological features. All mice were housed in a climate‐ and light‐controlled (12/12 h light/dark, light on at 6 A.M.) room at the University of Medicine and Dentistry of New Jersey. Food and water were provided ad libitum. Animal use procedures were approved by the University of Medicine and Dentistry of New Jersey Institutional Animal Care and Use Committee and were in accordance with the National Institutes of Health Guide for the Care and Use of Laboratory Animals. Mice were either euthanized by cervical dislocation or anesthesia followed by perfusion depending on purpose. Mice that were perfused were anesthetized with either Nembutal (75 µg/g, ∼1.9 mg per 25 g mouse) or Avertin (240 µg/g, ∼6.0 mg per 25 g mouse). Nembutal was diluted to 5 mg/mL in saline and a volume of 0.375 mL was used, and Avertin was diluted to 17 mg/mL in saline and a volume of 0.35 mL was used. After anesthesia, the mouse was slowly transcardially flush perfused by hand with heparin/saline (15 mL) and then fixation perfused with 50 mL of 4% paraformaldehyde (PFA) in saline. The brain was removed and postfixed in 4% PFA for 24 h. Fixed brains were paraffin embedded using an automated processor. Tissue sections were cut at 5 µm, mounted on charged slides and then used for IHC as described earlier.
At least eight cases from each group (CTRL, ILBD and PDP) received IHC. The cases used for morphological counts were used for IHC. Each case had IHC performed in both the SN and the Put in different experiments. The Put section was chosen to include the nBM. Experiments included different subsets of the three groups with different combinations of 1° Abs. Interpretation relied on verifying findings in multiple cases from different groups using different experiments and combinations of Abs.
Quantitative SN assessments
We quantified various histological features in the SN using a single FFPE H&E stained section. Each section contained the entire midportion of the SN from medial to lateral. The level varied slightly from case to case. The entire SN was then outlined using StereoInvestigator (version 9, Microbrightfield Bioscience, Williston, VT, USA) with a 1,25× objective. After outlining, the region was divided into four quadrants (dorsolateral, dorsomedial, ventrolateral and ventromedial) obeying visible clusters of neuromelanin (NM) neurons as originally described (47). Counting was performed with a 20× objective, and a 40× objective was used as needed for visual verification. We used a counting frame of 325 × 250 µm and the distance between frames was x: 650 µm and y: 500 µm. These parameters were empirically selected to achieve a random collection of data from ∼60% of the area of the SN and limit data collection time to ∼2 h per case. Features counted or obtained included: SN area (mm2), # frames, area sampled (mm2), NM containing neurons with a nucleus and without an inclusion, NM+ cells without a nucleus, intraneuronal Lewy body (LB, 1, 2 or >2), extraneuronal LB, pale body (PB), intraneuronal neurofibrillary tangle (NFT), intraneuronal corticobasal inclusion, other intraneuronal inclusion, NM+ macrophage (NM+ MP), NM+ MP cluster (2–3, >4), free neuropil NM fragments per counting frame (0, 1–3, 4–10, ≥11). Other parameters were derived from these measures. Reproducibility was achieved by training and repeat counting of the same slide. Values reported represent the ∼60% of the SN.
Abs
Commercial and proprietary Abs (Elan Pharmaceuticals, South San Francisco, CA, USA) were used in this study (Supporting Information Table S1). Characteristics and specificity of the three Elan Pharmaceutical Abs used in this report have been reported using IHC and Western blotting (1). The Elan Ab ELADW101 was generated to recognize αSYN truncated at asp119, ELADW105 was generated to recognize αSYN truncated at asn 122 and JH22 11A5 was generated to recognize phosphorylation at serine 129. Each Ab was optimized for use with FFPE tissue by using different Ab concentrations with different forms and combinations of AR. When possible, the findings from one 1° Ab were compared to a different 1° Ab to the same epitope (Supporting Information Table S1). The two anti‐TH Abs had similarities (identifying TH in TH+ neurons, dendrites and axons), and differences (identifying TH in aggregates) in the epitope recognized. The two anti‐flαSYN Abs had similarities (identifying flαSYN in aggregates) and differences (identifying flαSYN in synaptic terminals) in the epitope recognized. Colocalization of epitopes in an aggregate using different 1° Abs was common and assisted in identifying structures. For most studies, two 1° Abs made in different species were combined with DAPI. In some experiments, three 1° Abs made in different species were combined with DAPI. In general, all 1° Abs were improved in their recognition of epitopes when using AR in FFPE tissue. The density of epitopes (as visualized by brightness) was much greater in larger aggregated structures than in smaller aggregated structures which turn was greater than in the soluble or nonaggregated form of an epitope. As a result, image collection often exceeded the dynamic range of the camera (16 bits) and both high‐ and low‐abundant signals could not be collected at the same time. This dramatic abundance range may be a feature unique to using fluorescence detection methods and allow for detection of low‐abundance protein.
Ab concentrations and AR methods were extensively tested prior to use reported in this paper (Supporting Information Table S1). Variability was found between Abs, tissue blocks and anatomical structures in the type of AR required. Interpretation of IHC using FFPE always requires careful consideration and reporting of AR methods. The majority of Abs used in human FFPE blocks benefited or required a HI‐AR process, whereas only some Abs required PK‐AR. Only the Abs to TH benefited from having two retrieval methods (HI‐AR and PK‐AR) used sequentially. Abs that recognized aggregated forms of αSYN generally did not require AR, but were not harmed by AR and may have benefitted (4). The PK‐AR method had three potential effects. (i) It unmasked epitopes blocked by fixation and paraffin embedding as previously reported 14, 15 and (ii) reduced background by presumably digesting unrelated proteins to which the Ab might bind in a nonspecific manner. Finally, PK also (iii) significantly reduced the specific labeling of a soluble form of αSYN recognized by Abs to flαSYN (Sigma S5566 and Biomol, SA 3400) and to synaptophysin. FA‐AR had the effect of reducing Ab labeling to most epitopes except those presumably contained in an aggregate. The goal of AR was to improve labeling and not to determine which epitopes or structures were sensitive or resistant to its effects. The effectiveness of an AR method in each experiment was assessed by including a control slide where the effectiveness could be determined.
The specificity of some Abs was determined by comparison with a different Ab to the same epitope, and some Abs were made in a different species allowing simultaneous comparison (Supporting Information Table S1). The specificity can also be inferred by neuronal compartmental distribution or presence in aggregates. Both TH Abs colocalized in neuronal cell bodies in the SN, neurites and axons in the SN and Put, and terminals in the Put. The chicken (Chk) TH Ab also labeled the nuclei of many cells, which did not interfere with interpretation. Both flαSYN Abs colocalized in some neuronal cell bodies in the SN, terminals, neurites and axons in the SN and Put. Both labeled puncta in terminals predominantly. Both Abs labeled a soluble PK‐ and FA‐sensitive form in terminals and a PK‐ and FA‐resistant form in aggregates. The flαSYN Abs differed slightly in their response to FA with the Biomol Ab being slightly more resistant to FA‐AR. The tαSYN Abs labeled aggregates in terminals in the Put, axons and dendrites in the SN and Put, and intraneuronal LBs and PBs in the SN and nbM. The tαSYN Abs also occasionally labeled a non‐αSYN protein in both gray matter and white matter. All αSYN Abs also labeled the neuronal cytoplasm in the SN and nbM in disease cases.
Image acquisition and processing
For inspection of sections, we used an Olympus Provis AX‐70 microscope (Olympus America Inc., Center Valley, PA, USA) equipped with the AX reflected light module (halogen lamp housing, mercury burner power supply, collector lens and reflected light filter slider), fluorescence filter cubes and the AX‐REXBA excitation light balancer. We used the following commercial filters available from Olympus (details of the dichroic mirror, exciter filter and barrier filter can be found at http://www.olympusmicro.com/primer/techniques/fluorescence/fluorhome.html) (i) U‐MWU, ultraviolet range for DAPI, blue color; (ii) U‐MDA/FI, DAPI/fluorescein isothiocyanate, for DAPI and Alexa fluor 488, blue and green; (iii) U‐MDA/tetramethyl rhodamine iso‐thiocyanate (TRITC), for DAPI and Alexa fluor 594, blue and red; (iv) U‐MDA/FI/TRITC, for DAPI, Alexa fluor 488 and Alexa fluor 594, blue, green and red. The spectral characteristics of the commercial Alexa fluorophores can be obtained at http://probes.invitrogen.com/handbook/sections/0103.html. The AX‐REXBA can be used to balance the light intensity of the different fluorophores.
For image collection (single slice or stack of slices), an Olympus Fluoview FV10i (Olympus America Inc.) confocal microscope was used. Images were obtained at 180–360× final magnification, final resolution of 1024.1024 and an aperture of 1.0. Confocal images were exported to Imaris (version 7.2.0, Build 22163, Bitplane AG, Zurich, Switzerland).
Images from each a montage reflect a confocal stack acquired at 1024 × 1024 pixels for each channel independently. Distance between slices in a stack was 0.1 to 0.3 µm. A sufficient number of slices were acquired to image each structure demonstrated. Images are presented as sections displaying information in three dimensions. There was no bleed‐through between channels for Alexa Ab labels. However, some lipofuscin might still be seen in all channels even when masked using Sudan black.
Statistical analysis
SigmaStat (SigmaStat for Windows, v 3.10, Systat Software, Inc., San Jose, CA, USA) was used to perform one‐way analysis of variance (ANOVA) to compare different measures between groups when measures were normally distributed, or Kruskal–Wallis one‐way ANOVA if variances were unequal between groups.
RESULTS
A subset of CTRL (n = 8), ILBD (ILB (n = 10) and the PDP (n = 8) cases were randomly selected from a larger group (n = 59 total) of previously quantified cases (Table 1). ILBD was divided into those with (n = 6) and without (n = 4) active neurodegeneration. Active neurodegeneration in the SN consisted of: (i) loss of NM+ neurons; (ii) presence of more than 20 NM+ MPs; and (iii) more than one field with greater than 10 free NM fragments in the neuropil. PDP cases were divided into moderate (n = 4) and severe (n = 4) neuronal loss. Mean age (F 4,25 = 0.00776, P = 0.988) did not differ between groups. The % of the SN area sampled did not differ between groups (F 4,25 = 02.293, P = 0.093). Three morphological features varied significantly: the number of NM+ neurons (H4 = 20.131, P < 0.001), NM+ MPs (H4 = 15.939, P = 0.003) and fields with >10 NM fragments (H4 = 21.834, P < 0.001).
Abnormalities in both ILBD and the PDP cases were identified in each region examined from the SN to Put and the nbM.
Cell bodies in the SN
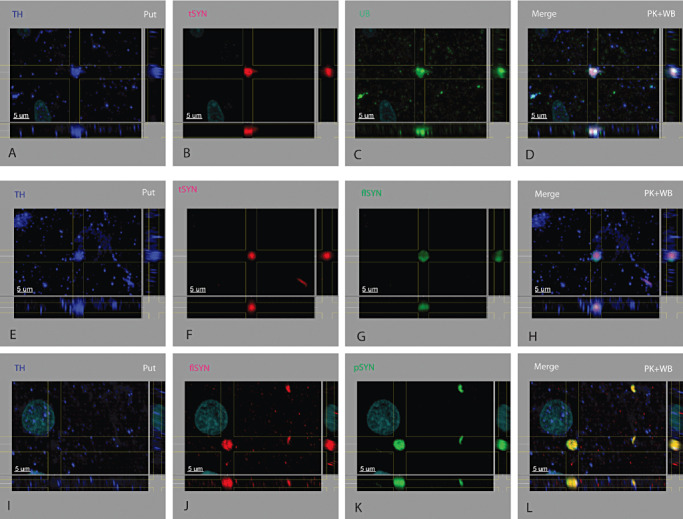
Three types of abnormal neuronal cell body αSYN expression were found including brain stem‐type LBs (Figure 1A–D), PBs (or PB‐like structures, Figure 1E–H) and neuronal diffuse cytoplasmic accumulation (Figure 1I–L). The brain stem‐type LB (in the SN and nbM) had three identified concentric layers consisting of a central core, surrounded by two distinct shells (inner and outer shell). Low to moderate levels of TH (see Supporting Information Figure S1A), tαSYN (see Supporting Information Figure S1B) and UBs (not shown) were variably found in the central core. An inner shell consisted of an intense layer of tαSYN (1, 2) and lower levels of trapped proteins. This was surrounded by an outer shell containing both flαSYN (1, 2, Supporting Information Figure S5C) and pαSYN (see Supporting Information Figure S1C). Brain stem‐type LBs were shaped like an elongated spheroid rather than a round sphere (Supporting Information Video S1) and were not randomly distributed in a neuron, but located near the cell membrane of one side. Up to eight brain stem‐type LBs were seen in one cell (Supporting Information Figure S1A–D). Brain stem‐type LBs varied in diameter from ∼4 to 24 µm and were smaller when multiple were present in one neuron. A spiky periphery contained both flαSYN and pαSYN fibrils. Multiple brain stem‐type LBs often appeared to be attached by their spiky halos.
Figure 1.
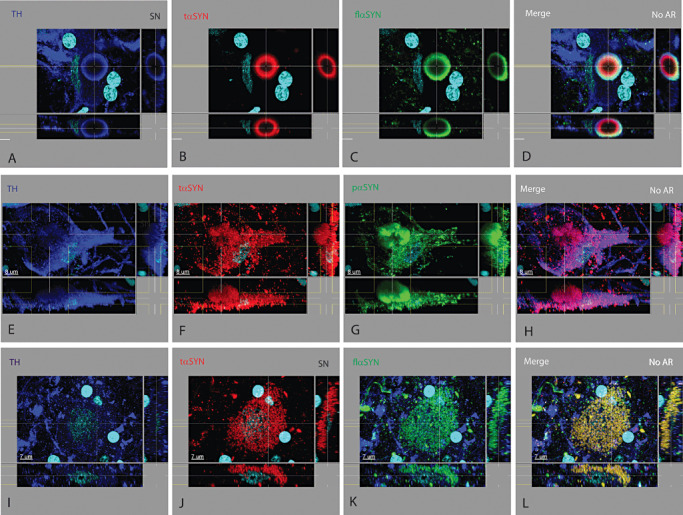
Lesions in the cell body of tyrosine hydroxylase+ neurons in the substantia nigra. At least three types of neuronal lesions were found in the soma of TH+ neurons in PD and ILBD cases. (i) The classic brain stem‐type Lewy body (A–D) was seen to have multiple concentric layers; an inner core that could be filled with variable amounts (often low) of different proteins such as TH and UB (not shown), surrounded by a ring containing TH (A) and tαSYN (B), which was surrounded by a ring containing pαSYN (not shown) and flαSYN (C). Cells containing one or more brain stem‐type Lewy bodies may or may not have observable protein elsewhere in the cytoplasm using these Abs. (ii) A pale body‐like lesion (E–H) was found to contain a variety of proteins including TH (E), tαSYN (F) and pαSYN (G) and other proteins (not shown). In contrast to a cell with a brain stem‐type Lewy body, the cytoplasm often contained these proteins having different aggregated oval to linear shapes in various amounts which coalesced into a more solid type of aggregate not having concentric layers. (iii) In neuronal diffuse cytoplasmic accumulation (I–L), the TH+ soma fills up with a variety of proteins including tαSYN (J), flαSYN (K), pαSYN (not shown) and UB (not shown) while also reducing the level of TH (I). Any combination of these three types of lesions may exist in a TH+ neuron. For this and similar montage figures, the large rectangle in the upper left portion of a panel is looking down on the tissue section and represents the typical plane viewed. The narrow rectangle at the right displays a cross section (orthogonal or perpendicular view) at the plane indicated by the vertical line(s) and the narrow rectangle at the bottom displays a cross section (orthogonal or perpendicular view) at the plane indicated by the horizontal line(s). Features contained within the lines can be visualized in three dimensions for each labeled protein (indicated in upper left in color of channel). Nuclei may or may not be shown in a field were labeled with DAPI and colored light blue. The secondary Abs used for fluorescence emit light at a specific wavelength and were pseudo‐colored (Supporting Information Table S1). Scale bar shown in all confocal figures. For three color/channel montages, the first three vertical panels represent a different primary Ab and the last panel is a merged image. Each row represents a different tissue section, location, lesion and set of Abs. The type of AR used indicated in merged image. Images are best viewed digitally to allow zooming and panning.
Figure 2.
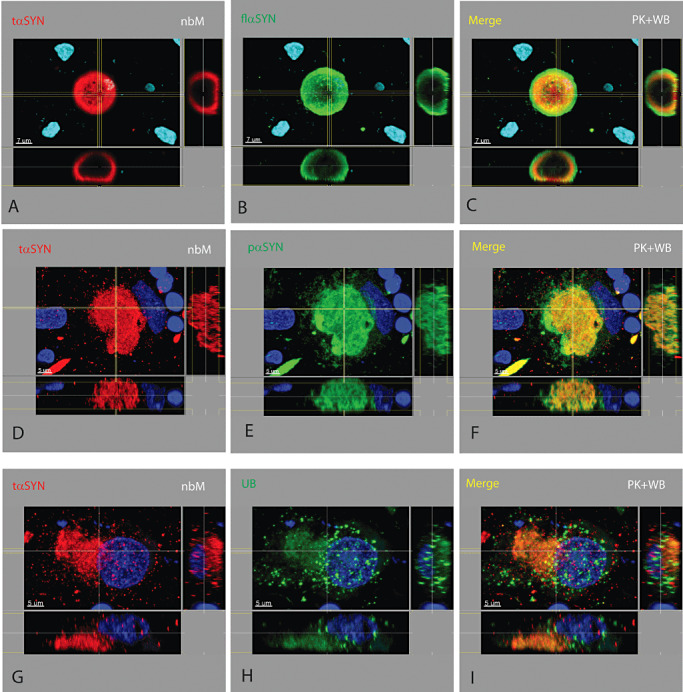
Lesions in the nucleus basalis of Meynert. The neuronal and neuritic lesions found in the SN of PDP and ILBD cases were also found in the nucleus basalis of Meynert, except for the absence of Marinesco bodies and neuromelanin. The neurochemical and morphological pattern for brain stem‐type Lewy bodies (A–C), pale bodies (D–F), neuronal diffuse cytoplasmic accumulation (G–I) and dystrophic neurites (D–F) were similar to those found in the substantia nigra.
PB‐like structures differed from brain stem‐type LBs and neuronal diffuse cytoplasmic accumulation in having some degree of macro‐aggregation into a loose structure of variable size and shape, but not being solid or concentric in neurochemical structure (Figure 1E–H, Supporting Information Video S2). TH (Figure 1E) was reduced and variably present in the cytoplasm of PB containing neurons. A PB contained variable amounts of tαSYN (1, 2), pαSYN (1, 2), flαSYN (not shown) and UBs (not shown). Greater variation in size and shape existed for PBs compared to brain stem‐type LBs. The cytoplasm of a neuron containing a PB also contained aggregated proteins elsewhere in the cytoplasm and attached neurites.
Neuronal diffuse cytoplasmic accumulation occurred with the diffuse cytoplasmic increase of different proteins either not normally present in a CTRL TH+ neuron such as pαSYN and tαSYN or present in a CTRL neuron at a much lower level such as flαSYN (Supporting Information Figure S2B, Supporting Information Video S3) and UBs (Supporting Information Figure S2E). Two types of cells with neuronal diffuse cytoplasmic accumulation were observed. The first type had a granular appearance to Ab staining in the SN due to the presence of proteins around NM granules (Figure 1I–L). The appearance was different in the nbM (Figure 2G–I) and in lipofuscin containing neurons (normal autofluorescence masked with Sudan black). The second type had Ab staining that appeared fibrillar and needle shaped. The size of these fibrils was similar, but other larger shapes were seen which might represent adherence of multiple fibrils. Neuronal diffuse cytoplasmic accumulation was seen with the different proteins examined in this report including tαSYN (1, 2), pαSYN (Supporting Information Video S2), flαSYN (Figure 1K) and UBs (Figure 2H). TH expression was usually reduced or appeared trapped between NM granules (Figure 1I, Supporting Information Video S2).
These three cellular lesions were observed to coexist in any combination. However, when neurons contained a LB, they rarely were observed to contain the other two lesions. PBs usually coexisted with neuronal diffuse cytoplasmic accumulation. Neuronal diffuse cytoplasmic accumulation was more often found in ILBD cases. Quantification of cells containing these lesions has not yet been performed. TH was usually reduced in the presence of any cellular lesion compared to CTRL cases where TH was highly and diffusely expressed (Supporting Information Figures S2A,D and 5A,D, Supporting Information Video S3), albeit in cargo‐like packages. Both flαSYN (Supporting Information Figure S2B) and UBs (Supporting Information Figure S2E) were present in CTRL neurons, neurites, axons and terminals, although not in the abundance or pattern seen in disease cases as described.
Dystrophic neurites in the SN
Dystrophic neurites were found in the SN (Figure 3), Put and nbM (Figure 2) in patients with both the PDP and ILBD. The largest and most numerous dystrophic neurites were found in the SN and nbM with many fewer and smaller dystrophic neurites in the Put from the same case. The concentric laminar pattern found in dystrophic neurites was similar to that found in some other dystrophic structures. Unlike a LB with three concentric layers, two concentric layers were more likely. Dystrophic neurites had a core region surrounded by a shell. Their more linear shape was due to the confining boundary of an axon or dendrite. With continued expansion of the aggregate, the shape both enlarged and became more angular and pleomorphic. The innermost portion contained UBs (Figure 3H), tαSYN (Figure 3A,D) and TH (not shown) surrounded by a shell of both pαSYN (Figure 3B) and flαSYN (Figure 3E). TH could be found in any layer of a dystrophic neurite (Supporting Information Video S4). TH could also be seen in the extending portion of a neurite.
Figure 3.
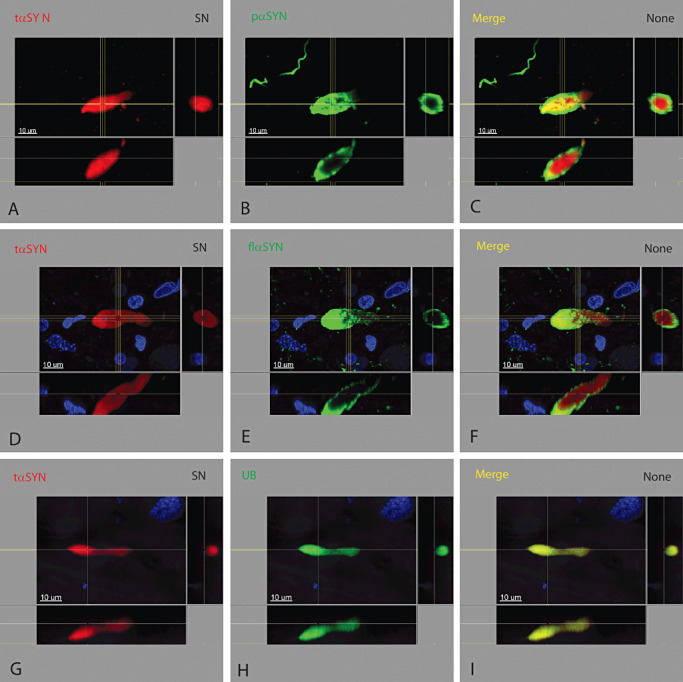
Dystrophic neurites in the substantia nigra. Dystrophic neurites had a laminar concentric pattern similar to the brain stem‐type Lewy body. The innermost portion contained tαSYN (A, D, G), UB (H) and TH (not shown) surrounded by pαSYN (B) and flαSYN (E). Dystrophic neurites in the substantia nigra were more numerous and larger compared to those found in the Put from the same case.
Axonal lesions
Normal TH+ axons in the bundle surrounding and innervating the Put measure between ∼0.5 and 1.2 µm in diameter (Supporting Information Figure S3). TH (and examined proteins) is transported as cargo in a single file of cylinders measuring ∼0.5–0.7 µm in diameter with a length of ∼2 µm (Supporting Information Video S5). The length of the series of TH cargo varied by axon (from ∼5–30 µm or longer), and only a fraction of the axons in this bundle contained TH at a given time. UBs and flαSYN were occasionally transported between TH cargo (Supporting Information Figure S3B,E).
Three types of lesions were found in TH+ axons from cases with the PDP or ILBD and not seen in CTRL cases. These lesions were not quantified and were seen in all grades of disease.
-
(i)
The presence of cargo containing tαSYN (Figure 4B,F) or pαSYN (Figure 4C) was considered abnormal. Cargo containing these abnormal proteins resembled cargo carrying normal protein in size and shape. When cargo carrying abnormal protein became enlarged or aggregated, they were considered to become dystrophic.
-
(ii)
Dystrophic axons differed from normal axons in their neurochemical content, enlarged diameter, tortuosity and the presence of aggregates containing different proteins (Figure 4). As the severity of pathology increased from early ILBD to late PDP, the number of axons with dystrophic features increased and the number containing TH decreased. Dystrophic axons displayed less deviation from a linear configuration compared to dystrophic neurites in the SN or nbM, possibly related to spatial constraints imposed by the surrounding axons. When an axon became dystrophic, cargo went from single file to side by side enlarging the diameter of the axon and suggesting an attempt to bypass an aggregate. Identification of distinct cargo also disappeared as the dystrophic process progressed. Aggregates were judged to contain protein from roughly 2 to 15 cargos.
-
(iii)
Dystrophic axonal aneurysms were seen in the axon bundle surrounding the Put and resembled a brain stem‐type LB having both a central core and a surrounding halo (Figure 4I–P). However, this type of aggregate was compressed in one dimension and appeared to protrude through a defect in the wall of an axon. The neurochemical structure of a dystrophic axonal aneurysm was similar to other types of aggregates having multiple concentric layers, with the innermost core containing UBs (Figure 4K) and TH (Figure 4I,M), surrounded by tαSYN (Figure 4N), which was surrounded by flαSYN (Figure 4J) and pαSYN (not shown). Transport of TH cargo could be seen adjacent to the dystrophic axonal aneurysm in an attached axon (Figure 4I,M).
Figure 4.
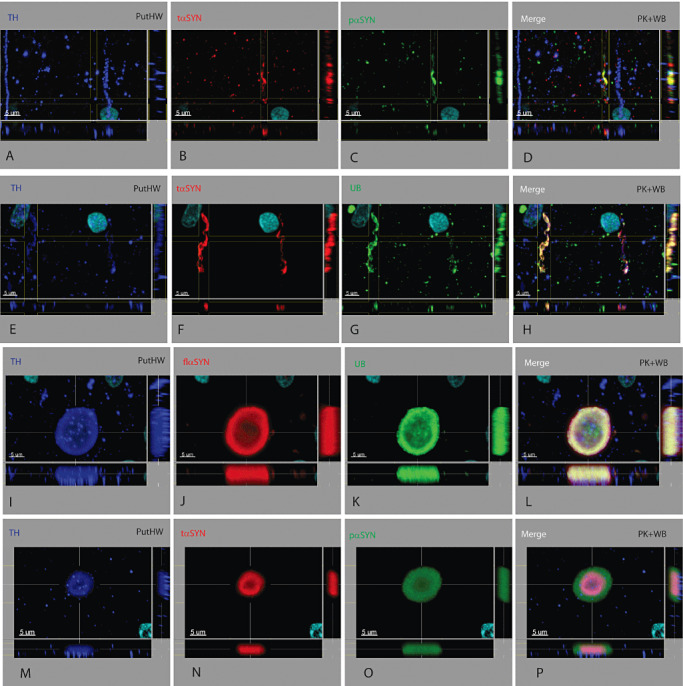
TH+ axonal lesions in the axon bundle adjacent to the putamen. Three types of axonal lesions were identified. (i) Abnormal cargo was present. When a dystrophic axon is still narrow, cargo of a single protein of the expected size and shape travelling along the axon can be seen (A–D and E–H). Cargo for TH (A, E), UB (G) and flαSYN (not shown) are considered normal and seen in CTRL cases (Supporting Information Figure S2, Supporting Information Video S5). The abundance of different cargo was not considered or quantified. Cargo containing tαSYN (B, F) or pαSYN (C) was considered abnormal. (ii) A dystrophic axon was identified by its abnormal shape, contents and location. They have a neurochemical profile similar to dystrophic neurites seen elsewhere, but were not as large as those seen in the SN. Aggregates of different size could be seen within the axon and contained tαSYN (B, F), pαSYN (C), UB (G), TH (A, E) and flαSYN (not shown). (iii) Rarely seen was a lesion arising from an axon having an unusual morphology referred to as dystrophic axonal aneurysms (I–L and M–P). These structures resemble an aneurysm with massive dilation arising from a narrow tubular structure (axon). TH can be seen in cargo attempting to bypass an aneurysm (I, M). The laminated structure consists of a central core containing TH (I, M) and UB (K), surrounded by tαSYN (N), which is then surrounded by flαSYN (J) and pαSYN (O). The amount of TH in axons from PDP cases was quite variable compared to CTRL cases (Supporting Information Figure S3) and was often at a reduced level (A, E, I, M).
Dystrophic neurites in the Put
Dystrophic neurites in the Put varied in length from short (∼5 µm) to long (∼25 µm), were linear to curved and could retain their axonal nature by containing cargo. The diameter of dystrophic neurites varied from slightly (1–2 µm) to very (up to 6 µm) enlarged compared to a normal neurite (∼0.5 µm). The neurochemical structure of dystrophic neurites in the Put resembled those in the SN and nbM differed only by being fewer in number and on average smaller in size.
Dystrophic terminals in Put
The majority of TH+ terminals in the mouse striatum were found to colocalize with flαSYN. TH was found in both distal branches of axons and terminals (Supporting Information Figure S4A), whereas flαSYN (Supporting Information Figure S4B) was found to be primarily restricted to the axon terminal. Axon terminals in the mouse striatum and human Put were often disc shaped and parallel to the axon. Both flαSYN and the presynaptic terminal protein synaptophysin were found to colocalize within terminals in the human Put (Supporting Information Figure S4D–F). TH localization was confirmed in axons, distal branches of axons and terminals (Supporting Information Figure S4G) 14, 15. As a soluble form of flαSYN was sensitive to PK‐AR and this method of AR was required (or highly desired) for TH IHC using FFPE tissue, minimal colocalization of TH and flαSYN in CTRL human tissue was observed.
Dystrophic terminals (Figure 5) were found in the Put and differed from dystrophic neurites based on their three‐dimensional shape and absence of identifiable cargo. Whereas dystrophic neurites in the Put had a linear aspect due there axonal morphology, dystrophic terminals were globular. The diameter and volume of either dystrophic structure could be large, although the largest dystrophic structure in the Put was a dystrophic neurite. A three‐dimensional view was required to determine whether an aggregate was in a dystrophic terminal or dystrophic neurite. Dystrophic terminals contained PK‐resistant forms of αSYN including tαSYN (Figure 5B,F), flαSYN (Figure 5G,J) and pαSYN (Figure 5K), and UBs (Figure 5C). The origin of some of these dystrophic structures was dopaminergic, as TH was occasionally found (Figure 5A,E).
Figure 5.
Dystrophic TH+ terminals in the putamen. The dystrophic terminal was identified only in the putamen. The shape of presumed dystrophic terminals differed from those seen in dystrophic neurites in the SN, putamen and nBM. Dystrophic terminals were globular in three dimensions. TH might (A, E) or might not (I) be present in a dystrophic terminal. Other proteins found in dystrophic terminals included tαSYN (B, F), flαSYN (G, J), pαSYN (K) and ubiquitinated proteins (UB, C).
Cell bodies in the nbM
The neuritic and most neuronal changes identified in the SN were also found in the nbM including brain stem‐type LBs (Figure 2A–C), PBs (Figure 2D–F), neuronal diffuse cytoplasmic accumulation (Figure 2G–I) and dystrophic neurites (Figure 2D–F). The one exception was Marinesco bodies, which were not seen in the nbM as previously reported.
Other findings
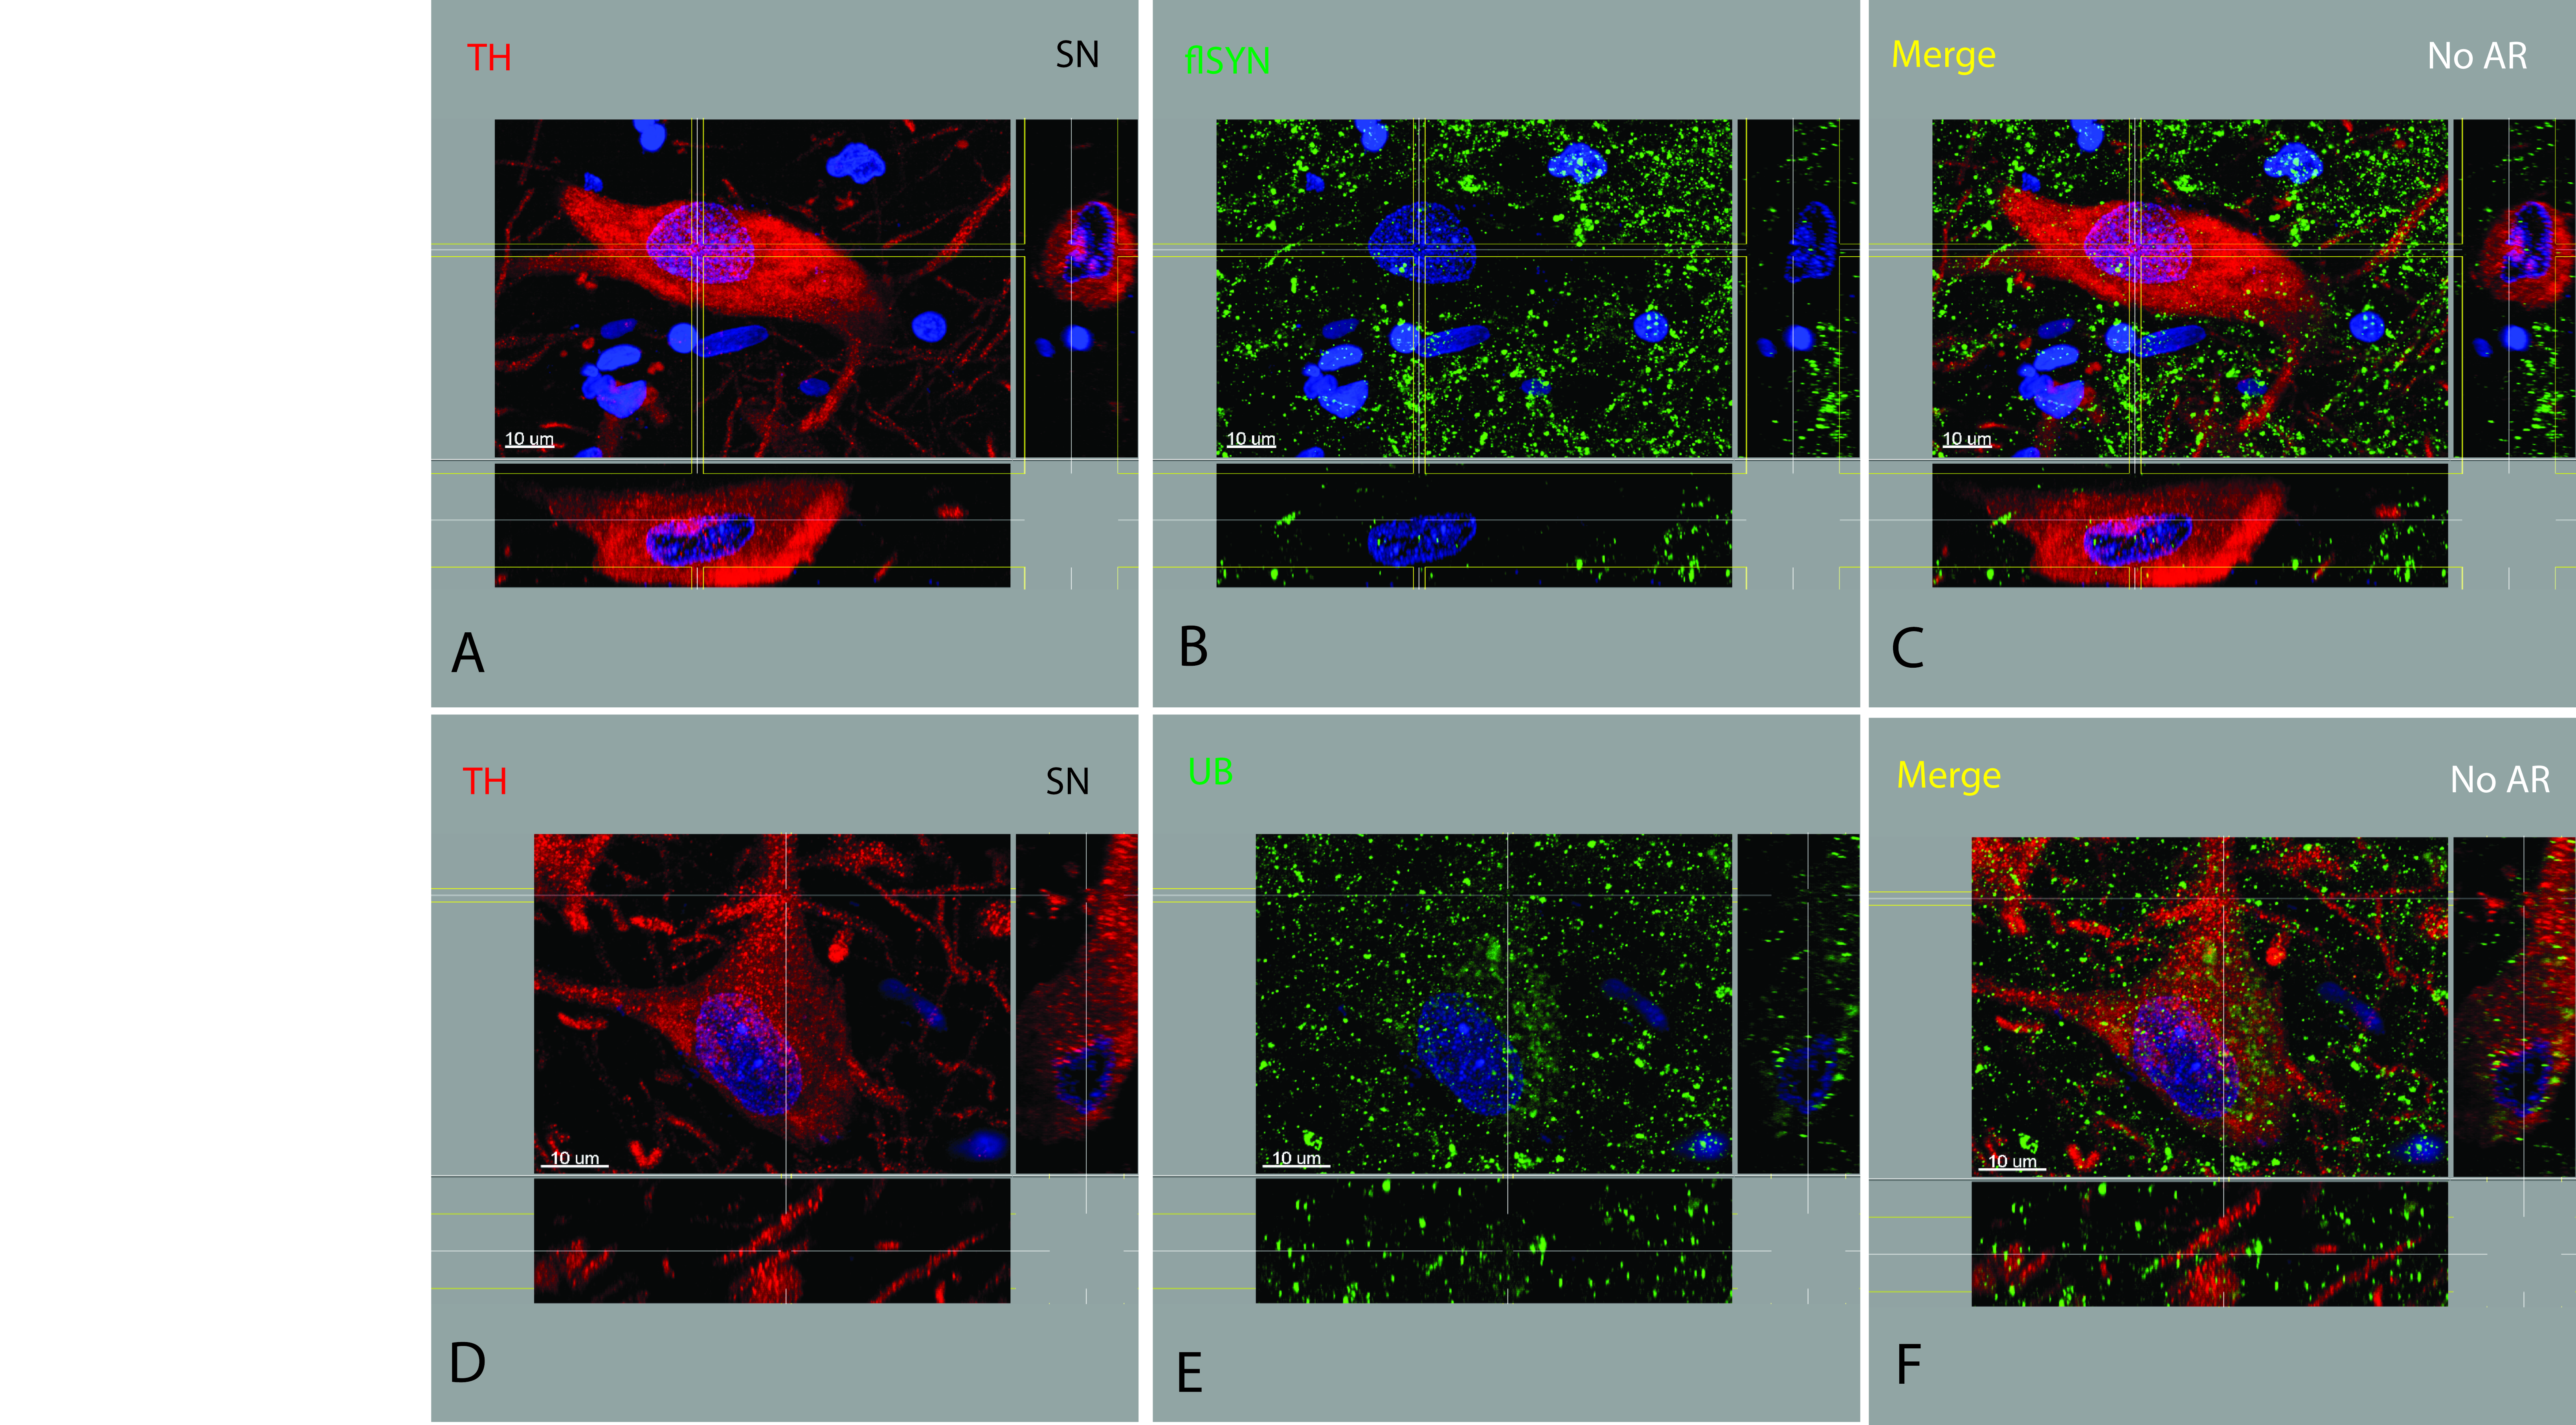
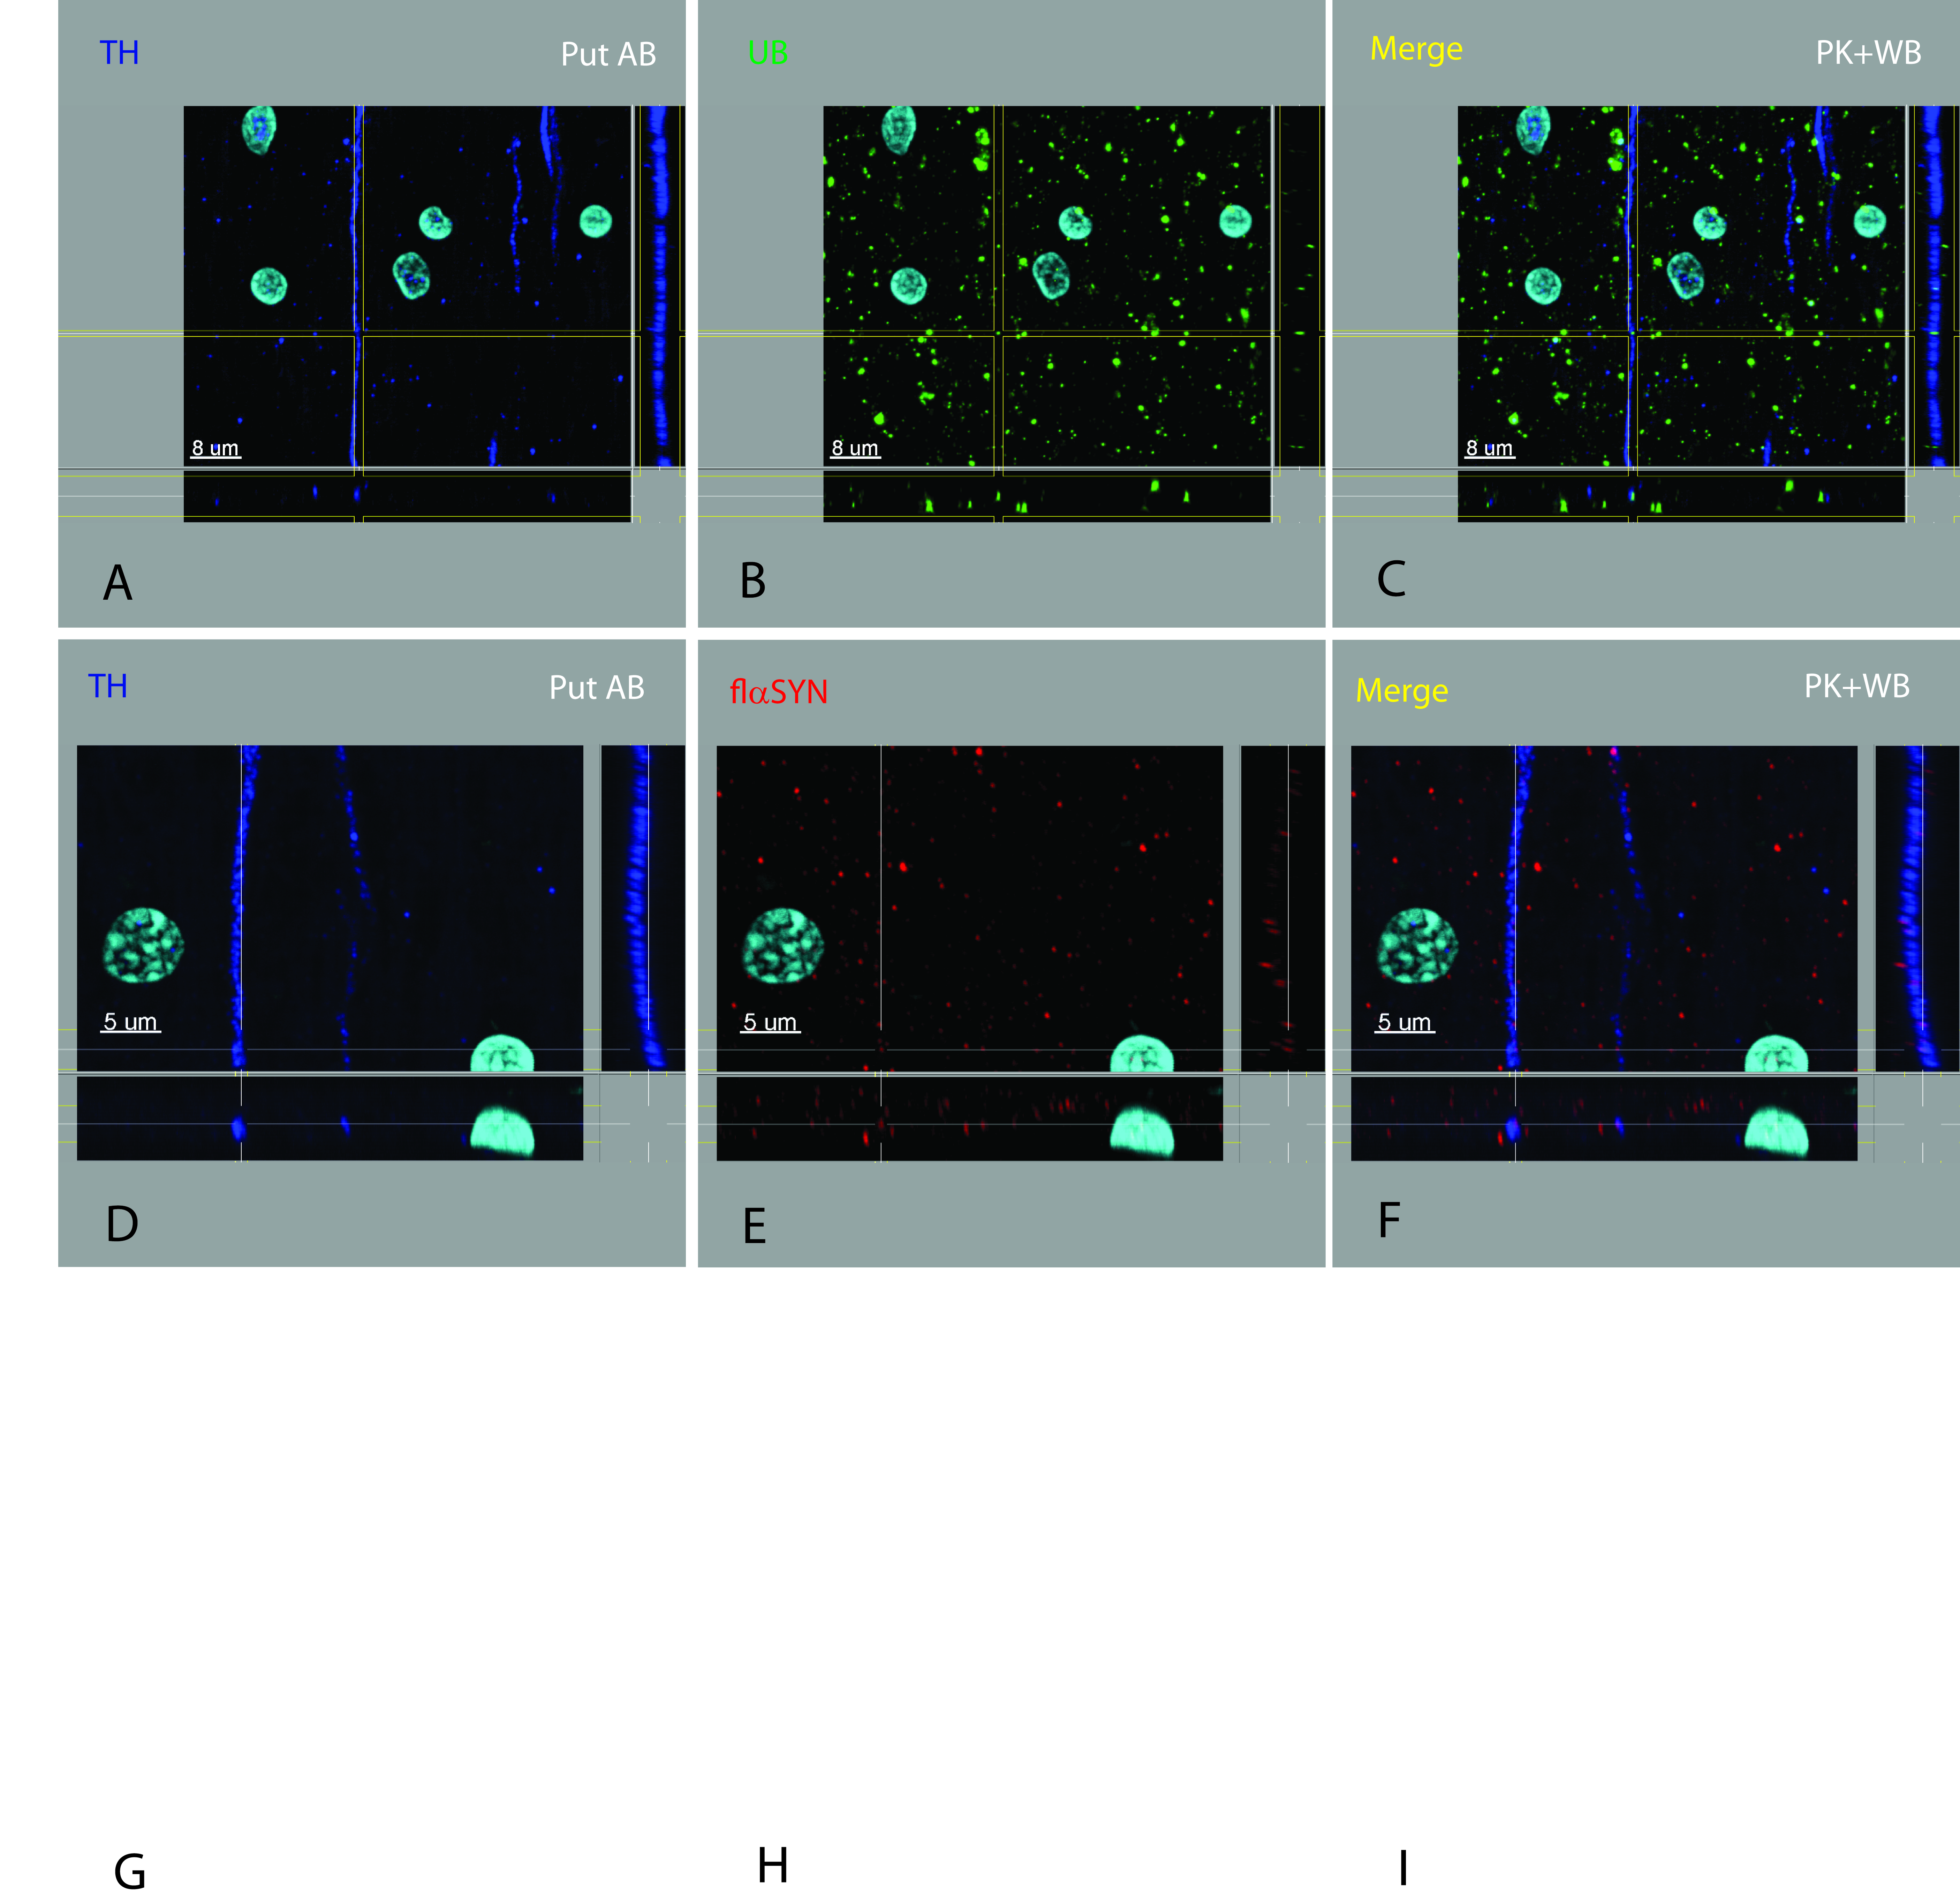
The number of axons and neurites containing pαSYN significantly exceeded those containing tαSYN in the SN, its axon pathway and the Put. The number and density of axons, neurites and dystrophic neurites containing pαSYN in the SN increased with progression of disease from early ILBD to late PDP and always far exceeded those containing flαSYN and tαSYN. The number and density of dystrophic lesions increased, whereas the number of NM+ neurons in the SN decreased with progression of disease. tαSYN was not seen in the absence of pαSYN. Extracellular brain stem‐type LBs were observed in SN (Supporting Information Figure S1) and were more common in late ILBD or early PD. The characteristic morphology and neurochemical anatomy of an extracellular brain stem‐type LB may change over the time they are present in the neuropil and subject to degradation. Features we required for designation as an extracellular brain stem‐type LB included: (i) core stained for tαSYN (Supporting Information Figure S1F) and periphery stained for flαSYN (Supporting Information Figure S1G), for pαSYN (not shown); (ii) the periphery becoming thinned and irregular; (iii) the absence of TH (Supporting Information Figure S1E); and (iv) direct contact with a glial or MP nucleus (Supporting Information Figure S1H). Dystrophic features were not limited to the SN, nigrostriatal pathway, Put or the nbM. Sections of the midbrain and Put from patients demonstrated widespread αSYN abnormalities that could be seen in other white matter bundles, the pallidum and adjacent cerebral cortex. One case belonging to the CTRL group was identified as a potential precursor state prior to early ILBD. This case was found to have a type of inclusion or aggregate near or within an axon hillock of a neuron that contained flαSYN (Supporting Information Figure S5B) and UBs (Supporting Information Figure S5E), but not pαSYN or tαSYN (not shown). This lesion was present in multiple TH+ neurons from this individual. Some of these neurons also had nuclear Marinesco bodies which were labeled for UBs (Supporting Information Figure S5E) and pαSYN (Supporting Information Figure S5H), but not flαSYN or tαSYN (not shown). In addition, UBs were found aggregated in neurites (Supporting Information Figure S5E) in a manner not seen in other CTRL cases. These very mild abnormalities have been confirmed in one (out of nine) additional elderly CTRL cases not part of this report. One additional ILBD case had pαSYN+ Marinesco bodies.
DISCUSSION
Several important inferences about the PDP can be drawn from these results. (i) The presence of tαSYN in the core of different types of aggregates suggests it plays a critical (possibly essential) role in aggregate formation. (ii) The mechanism of aggregate formation may involve the cohesion or collapse of tαSYN fibrils when they reach a critical concentration with entrapment of any intervening proteins, some of which are ubiquitinated. This core of proteins differs quantitatively from its surrounding spherical shell of tαSYN which in turn is surrounded by a spherical shell of other forms of αSYN. This results in a great diversity of proteins within aggregates 21, 29, 33, 43. This may also explain the laminar appearance associated with histochemical, immunohistochemical and electron microscopic descriptions of brain stem‐type LBs 17, 18, 30. Expansion of aggregates may be due to proteins that migrate around or happen to be near an aggregate and become enmeshed in a spiky shell. (iii) There is a centrifugal pattern to aggregates in the nigrostriatal system meaning the abundance of αSYN lesions is greatest in the SN and less distally in axon pathways and projection regions. (iv) Different modified forms of αSYN are produced in the soma of TH+ neurons, packaged and transported independently to terminals in the Put. We speculate that only tαSYN may be capable of spontaneous aggregation in vivo in humans and this may occur in cargo or after disruption or release from cargo. In disease cases, numerous TH+ axons were filled with pαSYN, but were not dystrophic. (v) The formation of a brain stem‐type LB may result from this sequence of events. First, there is either simultaneous or sequential cellular elevation of different forms of αSYN (flαSYN, pαSYN and tαSYN) and other proteins. These may aggregate into protofibrils, fibrils and other aggregated particles resulting in neuronal diffuse cytoplasmic accumulation. This may be followed by their further aggregation leading to a PB and then a brain stem‐type LB. This sequence of events may result from axonal blockade due to an aggregate. Because of the static nature of postmortem human tissue, following the evolution of these lesions is not possible. Cycling may lead to the accumulation of multiple neuronal brain stem‐type LBs. (vi) All the findings suggest that ILBD is a presymptomatic phase leading to PD.
Adverse effects from truncation of αSYN have been identified 10, 22, 31, 36, 39, 42, 54. tαSYN has a greater tendency to aggregate in vitro than other forms of αSYN 36, 39. tαSYN may be responsible for the initiation of aggregation in vivo as none of the different lesions were seen in its absence. How and why protein aggregation occurs is unclear 40, 46 as is their contribution to cell death 46, 58.
Dystrophic neurites were reported in multiple regions and portions of the nigrostriatal system in PD 5, 49. Detection depends on a variety of factors 4, 6, 7, 16, 49. However, when using sections from different portions of the nigrostriatal system from the same cases with different severities of disease, a topographic distribution was found with the SN having by far the greatest number and size of lesions. One interpretation is that tαSYN starts aggregation and is not capable of extensive transport compared to flαSYN and pαSYN. The number and density of dystrophic lesions observed (quantitative assessments not yet made) was inversely proportional to the number of DA neurons in the SN suggesting these dystrophic lesions may not be the cause of neuronal death. It is possible that a portion of flαSYN may also be modified upon arrival in a terminal. The similarities between Lewy neurites and brain stem‐type LBs in their neurochemical profile has been suggested (30) and this concept is strengthened by these results.
Brain stem‐type LBs 17, 18, 19, 26, 30, 35, 48 may have a pale halo and a darker core 33, 34, 35, 50, 51, 52, 53. A recent study suggested that brain stem‐type LBs have three concentric layers (30). We suggest four concentric layers may be present resulting from their mechanism of formation including a (i) core consisting of many proteins that are trapped by the formation of a (ii) spherical shell of tαSYN fibrils which is surrounded by a (iii) spherical shell consisting of both flαSYN and pαSYN fibrils formed by their attraction to tαSYN. A final (iv) outer layer may consist of additional proteins including neurofilaments (30). Proteins can be found in different or multiple layers by chance. Electron microscopic descriptions of brain stem‐type LBs report a granular dense core with a paucity of fibrils surrounded by crisscrossing fibrils radiating from the dense core with intervening granular material. These report are consistent with the neurochemical features described here (48). The size, shape and laminar features of brain stem‐type LBs were variable as described in both electron microscopic descriptions (17) and here.
The mechanism leading to the formation of brain stem‐type LBs has long been sought. Others have speculated that the PB might be a precursor to the brain stem‐type LB 12, 24. Until in vitro models exist, mechanisms will remain speculative. However, the progression from neuronal diffuse cytoplasmic accumulation to PB and then brain stem‐type LB is plausible. It is also possible that PBs and brain stem‐type LBs form independently and are related to varying concentrations or ratios of different forms of αSYN.
Whether ILBD represents a stage prior to PD has been debated 18, 59, although recent work supports this notion 2, 14, 15, 20, 27, 28. Two stages of ILBD were identified in this report with similarities to the PDP. All the morphologic lesions found in the PDP were found in ILBD. The characteristics of TH+ neurons in the SN prior to ILBD are not known, but we report changes that might occur. Identification of this stage may be essential for identifying neurochemical abnormalities in vulnerable cells.
A model is proposed for αSYN and the morphological lesions present in the PDP (Figure 6). This model does not specify either the upstream factors initiating these changes or the downstream cause(s) of cell death. Others have speculated that inclusions may not be responsible for cell death (52). Understanding these progressive changes in humans may be necessary for successful interventions altering progression. Other pathways are likely dysfunctional and contribute to cell death. This model proposes that flαSYN is the precursor to pαSYN which may be the preferred precursor to tαSYN. The neuronal increase in flαSYN and/or pαSYN may be a beneficial response to an adverse initiating factor (25). At some point, truncation of αSYN begins progressive aggregation. This model suggests that the identification of enzymes or pathways (lysosomal or proteasomal) resulting in αSYN modifications might provide targetable interventions 11, 39, 41. Preventing the truncation of αSYN might slow aggregation. This model and the different types of dystrophic lesions are not unique to the PDP. However, determining why these lesions are more common in the PDP may be critical to understanding their pathophysiology.
Figure 6.
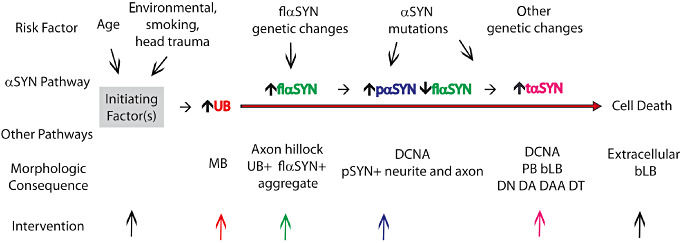
Model of progressive changes in αSYN and morphological lesions. This model suggests sequential changers in αSYN and morphological lesions that occur in vulnerable neurons of the substantia nigra and nucleus basalis of Meynert. This model may not apply to all neurons dying as it is not known if all neurons develop these lesions prior to their death. This model posits an unknown initiating factor(s, gray box) that begins a cascade of changes in different pathways over time whose elucidation should be a goal. The model does not speculate if the changes identified are adverse, protective or incidental. Genetic background and mutations may modify the pathway by increasing the expression of flαSYN or increasing the rate of phosphorylation and/or truncation of αSYN. The model suggests where specific interventions may act in the pathway to alter its course (colored arrows). The earliest changes observed were in the level of and distribution of UB, an increase in the cellular level of flαSYN and the formation of an aggregate in the axon hillock of a TH+ neuron. The significance of these early changes is not clear. Subsequently, the expression of pαSYN occurs in the cell body, neurites and axons, followed by the production of tαSYN leading to aggregation and the formation of different lesions. Cell death may be unrelated to the αSYN pathway and the lesions observed.
AUTHORS' CONTRIBUTIONS
Dr. Prasad performed experiments and collected confocal images. Drs. Prasad and Richfield viewed and interpreted confocal images. Dr. Richfield wrote the manuscript with the assistance of Drs. Hedreen and Beach. Dr. Richfield prepared figures and videos. Drs. Hedreen and Beach provided tissue.
Supporting information
Figure S1. Multiple neuronal brain stem‐type Lewy bodies and an extracellular brain stem‐type Lewy body. The highest number of brain stem‐type Lewy bodies identified in a neuron was eight (A–D). Because of their spiky halo nature, multiple brain stem‐type Lewy bodies were usually interconnected. Multiple brain stem‐type Lewy bodies in a neuron each had a similar neurochemical pattern as described previously, but varied in size. In this neuron, the core of the brain stem‐type Lewy bodies contained TH (A) and tαSYN (B), which is surrounded by a shell of tαSYN (B) which is not clearly recognized due to plane of focus, which is surrounded by a shell of pαSYN (C). Several features defined an extracellular brain stem‐type Lewy body (E–H) including: (i) central portion containing tαSYN (F) and a peripheral shell stained for flαSYN (G) or pαSYN (not shown); (ii) the peripheral shell becoming thinned and irregular; (iii) the absence of TH or other evidence of an intracellular location; and (iv) direct contact with a glial or macrophage nucleus (H).
Figure S2. TH+ neurons in a CTRL substantia nigra. Both flαSYN (B) and ubiquitinated proteins (E) and can be found in the neuronal soma, nucleus and neurites of TH+ neurons. To identify location, it is necessary to look at all three planes for a particular feature. Normal flαSYN has a documented preference for the neuropil, but has been identified in the soma, nucleus and neurites at a very low level. Normal ubiquitinated proteins are more easily recognized and abundant in those three compartments. To maximize visualization of non‐aggregated flαSYN PK‐AR should be avoided. Free‐floating sections did not require AR to visualize proteins. TH can be seen to be normally highly expressed. All proteins appeared cylindrical to ovoid in shape.
Figure S3. Axon bundles innervating the putamen in an age‐matched CTRL several axons containing TH can be seen scattered within these bundles. The number of axons transporting TH at any given time was a fraction of the total axons present in this pathway. An axon usually contained a variable number of TH cargo that ranged in axon length from 10 μm to 70 μm. The variable length was not a function of tissue thickness or image acquisition. TH cargo are transported in axons as rod‐shaped structures varying in cross‐sectional diameter from ∼0.5 μm to ∼1.2 μm with a length of ∼2.5 μm and move along a normal axon in single file (A, D). TH+ axons contain a small number of cargo that are positive for ubiquitinated proteins (UB, B, C) or flαSYN (E, F). To identify location within an axon, it is necessary to look at all three planes for a particular cargo. The orthogonal planes were selected to optimize visualization of one ubiquitinated protein (C) and one flαSYN (F) cargo. A series of adjacent cargo for ubiquitinated proteins or flαSYN was not seen, unlike those for TH.
Figure S4. Nerve terminals in mouse striatum and human putamen. Antigen retrieval (AR) was not required with mouse tissue (A–C) as it was lightly fixed. TH (A, red, Fischer Scientific) was found to frequently colocalize with flαSYN (B, green, Sigma) in terminals and distal axon branches in the mouse. TH labeled both the distal axon branch leading to a terminal and the terminal, whereas flαSYN was more often restricted to a terminal. Terminals most often appeared disc shaped. Nerve terminals in human putamen (D–F and G–I) were labeled for flαSYN (D, F, red, Biomol) and TH (D–F, dark blue) and were found to frequently colocalize with the terminal specific protein synaptophysin (E, F, green) using WB‐AR. The need for PK‐AR to visualize the majority of TH in human tissue reduced its colocalization with soluble flαSYN and synaptophysin which were more sensitive to PK‐AR. PK‐AR did not affect a pre‐synaptic marker for the glutamatergic system, vGLUT1 (Lower Panel, H, I) which did not colocalize with TH.
Figure S5. Possible lesions before incidental Lewy body disease. Unique abnormalities were found in the nucleus and soma of rare TH+ neurons in the SN of a CTRL case. Abnormalities included an aggregate in the axon hillock region that contained both flαSYN (B) and UB (E). UB was also found in neurites in a manner not seen in other CTRL cases (E). UB+ Marinesco bodies were seen in many TH+ neurons (as reported by others), some of which also contained the axon hillock aggregate (E). Rarely, Marinesco bodies contained TH (G) and pαSYN (H).
Table S1. Antibodies and nuclear stain used in this report. Abbreviations: Rbt = rabbit; Chk = chicken; Gt = goat; Ms = mouse; Gp = guinea pig; FFPE = free‐floating paraffin embedded; conc. = concentration; flαSYN = full length human αSynuclein; PK = proteinase K; Synapto = synaptophysi; TH, tyrosine hydroxylase = tαSYN, truncated αSYN; UB = ubiquitin; vGLUT1 = vesicular glutamate transporter 1; WB = water bath.
Video S1. A TH+ neuron with two attached brain stem‐type Lewy bodies from a PDP case labeled for tαSYN (red), flαSYN (green), TH (violet) and the nucleus (DAPI, light blue). The video starts with all channels visible. Two brain stem‐type Lewy bodies of different sizes are joined together, along with an eccentric nucleus to the left of the large brain stem‐type Lewy body. The TH+ neuron is surrounded by the nuclei of other cells. The video starts by turning off the flαSYN channel revealing both tαSYN and TH present in the brain stem‐type Lewy bodies (purple). Then, the tαSYN channel is then turned off revealing only the TH channel (violet) and nuclei. All channels are turned on and the cell is zoomed and rotated. The volume viewer is turned off and an orthogonal slice viewer (0.5 μm thickness) is turned on and moved through the cell from bottom to top stopping first in the midportion of the large brain stem‐type Lewy body where the TH channel is turned off revealing the large brain stem‐type Lewy body to have a concentric ring of tαSYN (red) surrounded by flαSYN (green) with a spiky appearance. The flαSYN (green) channel is then turned off. All channels turned on and the orthogonal viewer is moved to the center of the smaller brain stem‐type Lewy body. The TH channel is turned off, the two brain stem‐type Lewy bodies can be seen joined together by flαSYN. The spiky outer ring of a brain stem‐type Lewy body can be seen. The center of the brain stem‐type Lewy bodies can be seen and would be filled with a variety of proteins some of which would be ubiquitinated. The flαSYN channel is turned off, then all channels are turned on, the orthogonal slicer finishes its path. The orthogonal viewer is turned off and the volume viewer turned on and the cell is reduced in size and oriented as it began. For all videos using a PDP case and the SN, the FFFF method was used for IHC with no antigen‐retrieval and a tissue thickness of 30 μm.
Video S2. A TH+ neuron in the SN with both neuronal diffuse cytoplasmic accumulation and a Pale body from a PDP case labeled for tαSYN (red), pαSYN (green), TH (violet) and the nuclei with DAPI (light blue). The video starts with all channels on, the tαSYN (red), pαSYN (green) channels are then turned off revealing TH and the nucleus, the cell is then enlarged and rotated, the nuclear channel turned off, the TH channel turned off and the tαSYN (red) channel turned on and then off, the pαSYN (green) channel turned on, and the tαSYN (red) channel turned on again. The volume display is turned off the orthogonal slicer turned on and moved through the neuron in both directions revealing a pale body and details of localization of fibrils in the soma and axon. The orthogonal slicer is stopped at the level of the pale body and the tαSYN (red) and pαSYN (green) channels turned on and off. The neuron is then returned to its original orientation and magnification.
Video S3. A neuron from a CTRL case labeled for TH (red), flαSYN (green) and nucleus (blue). The video starts with TH and nuclei visible, then flαSYN is turned on then off, the cell is magnified and rotated, then flαSYN is turned back on, rotation continued, flαSYN turned off and the image reduced. TH can be seen as punctate in the soma, axons and dendrites. flαSYN can be seen as punctate in synapses, but also rarely in the cell soma and nucleus.
Video S4. A TH+ dystrophic neurite (DN) in the SN from a PDP case was labeled for tαSYN (red), ubiquitin (green), TH (violet) and nuclei counterstained with DAPI (light blue). The video starts with all channels on and the DN in the center of the image surrounded by TH+ neurites (violet). The image is zoomed, tαSYN (red) and ubiquitin (green) are turned off, then on and the DN rotated ∼90° to look down the length of the DN. The orthogonal slicer is turned on and the volume view turned off, different channels are turned on and off, then the DN enlarged and individual channels examined. tαSYN, ubiquitin and TH can be seen within the DN and a laminar pattern not seen with these proteins.
Video S5. Two TH+ axons are shown in the axon pathway adjacent to the Put in a CTRL case. The section was labeled for flαSYN (red), TH (violet) and nuclei counterstained with DAPI (light blue). A 15 μm FFPE section was used in the absence of PK‐AR to demonstrate flαSYN. The video starts showing the two axons and two nuclei. The video begins to zoom in on the lower portion of the axons and the DAPI channel turned off. The image is rotated to demonstrate the size, shape and discrete nature of both TH and flαSYN as axonal cargo being transported along an axon. The oblique slicer is then used in two planes to show the flαSYN cargo (red) are located in the axon between TH cargo. flαSYN can also be seen to be located in puncta, possibly outside of axons. The image is then returned to its initial size and position.
Supporting info item
Supporting info item
Supporting info item
Supporting info item
Supporting info item
Supporting info item
Supporting info item
Supporting info item
Supporting info item
Supporting info item
Supporting info item
ACKNOWLEDGMENTS
We appreciate the tissue and assistance provided by the Harvard Brain Tissue Resource Center, Francine M. Benes, Director, McLean Hospital, Belmont, MA 02478, http://www.brainbank.mclean.org. We are also grateful to the Banner Sun Health Research Institute Brain Donation Program of Sun City, Arizona for the provision of human brain tissue. The Brain Donation Program is supported by the National Institute on Aging (P30 AG19610 Arizona Alzheimer's Disease Core Center), the Arizona Department of Health Services (contract 211002, Arizona Alzheimer's Research Center), the Arizona Biomedical Research Commission (contracts 4001, 0011, 05–901 and 1001 to the Arizona Parkinson's Disease Consortium) and the Michael J. Fox Foundation for Parkinson's Research. We also gratefully acknowledge financial support and Abs provided by Neotope Biosciences, a division of Elan Pharmaceuticals Inc.
REFERENCES
- 1. Anderson JP, Walker DE, Goldstein JM, de Laat R, Banducci K, Caccavello RJ et al (2006) Phosphorylation of Ser‐129 is the dominant pathological modification of {alpha}‐synuclein in familial and sporadic Lewy body disease. J Biol Chem 281:29739–29752. [DOI] [PubMed] [Google Scholar]
- 2. Beach TG, Adler CH, Sue LI, Peirce JB, Bachalakuri J, Dalsing‐Hernandez JE et al (2008) Reduced striatal tyrosine hydroxylase in incidental Lewy body disease. Acta Neuropathol 115:445–451. [DOI] [PMC free article] [PubMed] [Google Scholar]
- 3. Beach TG, Sue LI, Walker DG, Roher AE, Lue L, Vedders L et al (2008) The Sun Health Research Institute Brain Donation Program: description and experience, 1987–2007. Cell Tissue Bank 9:229–245. [DOI] [PMC free article] [PubMed] [Google Scholar]
- 4. Beach TG, White CL, Hamilton RL, Duda JE, Iwatsubo T, Dickson DW et al (2008) Evaluation of alpha‐synuclein immunohistochemical methods used by invited experts. Acta Neuropathol 116:277–288. [DOI] [PMC free article] [PubMed] [Google Scholar]
- 5. Braak H, Sandmann‐Keil D, Gai W, Braak E (1999) Extensive axonal lewy neurites in Parkinson's disease: a novel pathological feature revealed by a synuclein immunocytochemistry. Neurosci Lett 265:67–69. [DOI] [PubMed] [Google Scholar]
- 6. Braak H, Del Tredici K, Rüb U, de Vos RAI, Jansen Steur ENH, Braak E (2003) Staging of brain pathology related to sporadic Parkinson's disease. Neurobiol Aging 24:197–211. [DOI] [PubMed] [Google Scholar]
- 7. Braak H, Muller CM, Rub U, Ackermann H, Bratzke H, de Vos RA, Del Tredici K (2006) Pathology associated with sporadic Parkinson's disease—where does it end? J Neural Transm Suppl 70:89–97. [DOI] [PubMed] [Google Scholar]
- 8. Calne DB, Langston JW (1983) Aetiology of Parkinson's disease. The. Lancet Neurol 322:1457–1459. [DOI] [PubMed] [Google Scholar]
- 9. Cookson MR (2006) Hero versus antihero: the multiple roles of a‐synuclein in neurodegeneration. Exp Neurol 199:249–256. [DOI] [PubMed] [Google Scholar]
- 10. Crowther RA, Jakes R, Spillantini MG, Goedert M (1998) Synthetic filaments assembled from C‐terminally truncated [alpha]‐synuclein. FEBS Lett 436:309–312. [DOI] [PubMed] [Google Scholar]
- 11. Cuervo AM, Stefanis L, Fredenburg R, Lansbury PT, Sulzer D (2004) Impaired degradation of mutant α‐synuclein by chaperone‐mediated autophagy. Science 305:1292–1294. [DOI] [PubMed] [Google Scholar]
- 12. Dale GE, Probst A, Luthert P, Martin J, Anderton BH, Leigh PN (1992) Relationships between Lewy bodies and pale bodies in Parkinson's disease. Acta Neuropathol 83:525–529. [DOI] [PubMed] [Google Scholar]
- 13. de Jong GJ, Meerwaldt JD, Schmitz PIM (1987) Factors that influence the occurrence of response variations in Parkinson's disease. Ann Neurol 22:4–7. [DOI] [PubMed] [Google Scholar]
- 14. DelleDonne A, Klos KJ, Fujishiro H, Ahmed Z, Parisi JE, Josephs KA et al (2008) Incidental Lewy body disease and preclinical Parkinson disease. Arch Neurol 65:1074–1080. [DOI] [PubMed] [Google Scholar]
- 15. Dickson DW, Fujishiro H, DelleDonne A, Menke J, Ahmed Z, Klos KJ et al (2008) Evidence that incidental Lewy body disease is pre‐symptomatic Parkinson's disease. Acta Neuropathol 115:437–444. [DOI] [PubMed] [Google Scholar]
- 16. Duda JEM, Giasson BIP, Mabon MEB, Lee VMYP, Trojanowski JQMDP (2002) Novel antibodies to synuclein show abundant striatal pathology in Lewy body diseases. Ann Neurol 52:205–210. [DOI] [PubMed] [Google Scholar]
- 17. Duffy PE, Tennyson VM (1965) Phase and electron microscopic observations of Lewy bodies and melanin granule in the substantia nigra and locus caeruleus in Parkinosn's disease. J Neuropathol Exp Neurol 24:398–414. [Google Scholar]
- 18. Forno LS (1969) Concentric hyalin intraneuronal inclusions of Lewy type in the brains of elderly persons (50 incidental cases): relationship to parkinsonism. J Am Geriatr Soc 17:557–575. [DOI] [PubMed] [Google Scholar]
- 19. Forno LS, Norville RL (1976) Ultrastructure of Lewy bodies in the stellate ganglion. Acta Neuropathol (Berl) 34:183–197. [DOI] [PubMed] [Google Scholar]
- 20. Frigerio R, Fujishiro H, Maraganore DM, Klos KJ, DelleDonne A, Heckman MG et al (2009) Comparison of risk factor profiles in incidental Lewy body disease and Parkinson disease. Arch Neurol 66:1114–1119. [DOI] [PMC free article] [PubMed] [Google Scholar]
- 21. Galvin JE, Lee VMY, Schmidt ML, Tu PH, Iwatsubo T et al (1999) Pathobiology of the lewy body. Parkinson's disease. Adv Neurol 80:313–324. [PubMed] [Google Scholar]
- 22. Giasson BI, Uryu K, Trojanowski JQ, Lee VM‐Y (1999) Mutant and wild type human α‐synucleins assemble into elongated filaments with distinct morphologies in vitro. J Biol Chem 274:7619–7622. [DOI] [PubMed] [Google Scholar]
- 23. Giasson BI, Duda JE, Murray IV, Chen Q, Souza JM (2000) Oxidative damage linked to neurodegeneration by selective a‐synuclein nitration in synucleinopathy lesions. Science 290:985–989. [DOI] [PubMed] [Google Scholar]
- 24. Gomez‐Tortosa E, Newell K, Irizarry MC, Sanders JL, Hyman BT (2000) alpha‐Synuclein immunoreactivity in dementia with Lewy bodies: morphological staging and comparison with ubiquitin immunostaining. Acta Neuropathol 99:352–357. [DOI] [PubMed] [Google Scholar]
- 25. Gorbatyuk OS, Li S, Nash K, Gorbatyuk M, Lewin AS, Sullivan LF et al (2010) In vivo RNAi‐mediated alpha‐synuclein silencing induces nigrostriatal degeneration. Mol Ther 18:1450–1457. [DOI] [PMC free article] [PubMed] [Google Scholar]
- 26. Greenfield JG, Bosanquet FD (1953) The brain‐stem lesions in Parkinsonism. J Neurol Neurosurg Psychiatry 16:213–226. [DOI] [PMC free article] [PubMed] [Google Scholar]
- 27. Iwanaga K, Wakabayashi K, Yoshimoto M, Tomita I, Satoh H et al (1999) Lewy body‐type degeneration in cardiac plexus in Parkinson's and incidental Lewy body diseases. Neurology 52:1269–1271. [DOI] [PubMed] [Google Scholar]
- 28. Jenner P, Dexter DT, Sian J, Schapira AHV, Marsden CD (1992) Oxidative stress as a cause of nigral cell death in Parkinson's disease and incidental lewy body disease. Ann Neurol 32:S82–S87. [DOI] [PubMed] [Google Scholar]
- 29. Jin J, Meredith GE, Chen L, Zhou Y, Xu J, Shie FS et al (2005) Quantitative proteomic analysis of mitochondrial proteins: relevance to Lewy body formation and Parkinson's disease. Mol Brain Res 134:1119–1138. [DOI] [PubMed] [Google Scholar]
- 30. Kanazawa T, Uchihara T, Takahashi A, Nakamura A, Orimo S, Mizusawa H (2008) Three‐layered structure shared between lewy bodies and lewy neurites—three‐dimensional reconstruction of triple‐labeled sections. Brain Pathol 18:415–422. [DOI] [PMC free article] [PubMed] [Google Scholar]
- 31. Kanda S, Bishop JF et al (2000) Enhanced vulnerability to oxidative stress by alpha‐synuclein mutations and c‐terminal truncation. Neuroscience 97:279–284. [DOI] [PubMed] [Google Scholar]
- 32. Kondo K, Kurland LT, Schull WJ (1973) Parkinson's disease: genetic analysis and evidence of a multifactorial etiology. Mayo Clin Proc 48:465–475. [PubMed] [Google Scholar]
- 33. Leverenz JB, Umar I, Wang Q, Montine TJ, McMillan PJ, Tsuang DW et al (2007) Proteomic identification of novel proteins in cortical Lewy bodies. Brain Pathol 17:139–145. [DOI] [PMC free article] [PubMed] [Google Scholar]
- 34. Lewis KA, Su Y, Jou O, Ritchie C, Foong C, Hynan LS et al (2010) Abnormal neurites containing C‐terminally truncated α‐synuclein are present in Alzheimer's disease without conventional Lewy body pathology. Am J Pathol 177:3037–3050. [DOI] [PMC free article] [PubMed] [Google Scholar]
- 35. Lewis PD (1971) Parkinsonism—neuropathology. Br Med J 3:690–692. [DOI] [PMC free article] [PubMed] [Google Scholar]
- 36. Li W, West N, Colla E, Pletnikova O, Troncoso JC, Marsh L et al (2005) Aggregation promoting C‐terminal truncation of α‐synuclein is a normal cellular process and is enhanced by the familial Parkinson's disease‐linked mutations. Proc Natl Acad Sci U S A 102:2162–2167. [DOI] [PMC free article] [PubMed] [Google Scholar]
- 37. Litvan I, Chesselet MF, Gasser T, Di Monte DA, Parker D Jr, Hagg T et al (2007) The etiopathogenesis of Parkinson disease and suggestions for future research. Part II. J Neuropathol Exp Neurol 66:329–336. [DOI] [PubMed] [Google Scholar]
- 38. Litvan I, Halliday G, Hallett M, Goetz CG, Rocca W, Duyckaerts C et al (2007) The etiopathogenesis of Parkinson disease and suggestions for future research. Part I. J Neuropathol Exp Neurol 66:251–257. [DOI] [PubMed] [Google Scholar]
- 39. Liu C‐W, Giasson BI, Lewis KA, Lee VM, DeMartino GN, Thomas PJ (2005) A precipitating role for truncated α‐synuclein and the proteasome in α‐synuclein aggregation: implications for pathogenesis of parkinson disease. J Biol Chem 280:22670–22678. [DOI] [PubMed] [Google Scholar]
- 40. Markossian KA, Kurganov BI (2004) Protein folding, misfolding, and aggregation. Formation of inclusion bodies and aggresomes. Biochemistry (Moscow) 69:971–984. [DOI] [PubMed] [Google Scholar]
- 41. Mishizen‐Eberz AJ, Guttmann RP, Giasson BI, Day GA 3rd, Hodara R, Ischiropoulos H et al (2003) Distinct cleavage patterns of normal and pathologic forms of alpha‐synuclein by calpain I in vitro. J Neurochem 86:836–847. [DOI] [PubMed] [Google Scholar]
- 42. Periquet M, Fulga T, Myllykangas L, Schlossmacher MG, Feany MB (2007) Aggregated alpha‐synuclein mediates dopaminergic neurotoxicity in vivo. J Neurosci 27:3338–3346. [DOI] [PMC free article] [PubMed] [Google Scholar]
- 43. Pollanen MS, Dickson DW, Bergeron C (1993) Pathology and biology of the Lewy body. J Neuropathol Exp Neurol 52:183–191. [DOI] [PubMed] [Google Scholar]
- 44. Polymeropoulos MH, Lavedan C, Leroy E, Ide SE, Dehejia A, Dutra A et al (1997) Mutation in the alpha ‐synuclein gene identified in families with Parkinson's disease. Science 5321:2045–2047. [DOI] [PubMed] [Google Scholar]
- 45. Quilty MC, King AE, Gai WP, Pountney DL, West AK, Vickers JC, Dickson TC (2006) Alpha‐synuclein is upregulated in neurones in response to chronic oxidative stress and is associated with neuroprotection. Exp Neurol 199:249–256. [DOI] [PubMed] [Google Scholar]
- 46. Ross CA, Poirier MA (2004) Protein aggregation and neurodegenerative disease. Nat Med 10(Suppl.):S10–S17. [DOI] [PubMed] [Google Scholar]
- 47. Ross GW, Petrovitch H, Abbott RD, Nelson J, Markesbery W, Davis D et al (2004) Parkinsonian signs and substantia nigra neuron density in decendents elders without PD. Ann Neurol 56:532–539. [DOI] [PubMed] [Google Scholar]
- 48. Roy S, Wolman L (1969) Ultrasturctural observaitons in Parkinsonism. J Pathol 99:39–44. [DOI] [PubMed] [Google Scholar]
- 49. Sandmann‐Keil D, Braak H, Okochi M, Haass C, Braak E (1999) Alpha‐synuclein immunoreactive Lewy bodies and Lewy neurites in Parkinson's disease are detectable by an advanced silver‐staining technique. Acta Neuropathol 98:461–464. [DOI] [PubMed] [Google Scholar]
- 50. Schapira AHV (2006) Etiology of Parkinson's disease. Neurology 66:S10–S23. [DOI] [PubMed] [Google Scholar]
- 51. Tanner CM (1989) The role of environmental toxins in the etiology of Parkinson's disease. Trends Neurosci 12:49–54. [DOI] [PubMed] [Google Scholar]
- 52. Terry RD (2000) Do neuronal inclusions kill the cell? J Neural Transm Suppl 59:91–93. [DOI] [PubMed] [Google Scholar]
- 53. Tofaris G, Spillantini M (2007) Physiological and pathological properties of α‐synuclein. Cell Mol Life Sci 64:2194–2201. [DOI] [PMC free article] [PubMed] [Google Scholar]
- 54. Tofaris GK, Reitböck PG, Humby T, Lambourne SL, O'Connell M, Ghetti B et al (2006) Pathological changes in dopaminergic nerve cells of the substantia nigra and olfactory bulb in mice transgenic for truncated human a‐synuclein (1‐120): implications for lewy body disorders. J Neurosci 26:3942–3950. [DOI] [PMC free article] [PubMed] [Google Scholar]
- 55. Tofaris GK, Spillantini MG (2005) Alpha‐synuclein dysfunction in lewy body diseases. Mov Disord 20:S37–S44. [DOI] [PubMed] [Google Scholar]
- 56. Uitti RJ, Baba Y, Wszolek ZK, Putzke DJ (2005) Defining the Parkinson's disease phenotype: initial symptoms and baseline characteristics in a clinical cohort. Parkinsonism Relat Disord 11:139–145. [DOI] [PubMed] [Google Scholar]
- 57. Van Den Eeden SK, Tanner CM, Bernstein AL, Fross RD, Leimpeter A, Bloch DA, Nelson LM (2003) Incidence of Parkinson's disease: variation by age, gender, and race/ethnicity. Am J Epidemiol 157:1015–1022. [DOI] [PubMed] [Google Scholar]
- 58. Volles MJ, Lansbury PT Jr (2002) Vesicle permeabilization by protofibrillar alpha‐synuclein is sensitive to Parkinson's disease‐linked mutations and occurs by a pore‐like mechanism. Biochemistry 41:4595–4602. [DOI] [PubMed] [Google Scholar]
- 59. Wakabayashi K, Takahashi H, Oyanagi K, Ikuta F (1993) Incidental occurrence of Lewy bodies in the brains of elderly patients—the relevance to aging and Parkinson's disease. No To Shinkei 45:1133–1138. [PubMed] [Google Scholar]
Associated Data
This section collects any data citations, data availability statements, or supplementary materials included in this article.
Supplementary Materials
Figure S1. Multiple neuronal brain stem‐type Lewy bodies and an extracellular brain stem‐type Lewy body. The highest number of brain stem‐type Lewy bodies identified in a neuron was eight (A–D). Because of their spiky halo nature, multiple brain stem‐type Lewy bodies were usually interconnected. Multiple brain stem‐type Lewy bodies in a neuron each had a similar neurochemical pattern as described previously, but varied in size. In this neuron, the core of the brain stem‐type Lewy bodies contained TH (A) and tαSYN (B), which is surrounded by a shell of tαSYN (B) which is not clearly recognized due to plane of focus, which is surrounded by a shell of pαSYN (C). Several features defined an extracellular brain stem‐type Lewy body (E–H) including: (i) central portion containing tαSYN (F) and a peripheral shell stained for flαSYN (G) or pαSYN (not shown); (ii) the peripheral shell becoming thinned and irregular; (iii) the absence of TH or other evidence of an intracellular location; and (iv) direct contact with a glial or macrophage nucleus (H).
Figure S2. TH+ neurons in a CTRL substantia nigra. Both flαSYN (B) and ubiquitinated proteins (E) and can be found in the neuronal soma, nucleus and neurites of TH+ neurons. To identify location, it is necessary to look at all three planes for a particular feature. Normal flαSYN has a documented preference for the neuropil, but has been identified in the soma, nucleus and neurites at a very low level. Normal ubiquitinated proteins are more easily recognized and abundant in those three compartments. To maximize visualization of non‐aggregated flαSYN PK‐AR should be avoided. Free‐floating sections did not require AR to visualize proteins. TH can be seen to be normally highly expressed. All proteins appeared cylindrical to ovoid in shape.
Figure S3. Axon bundles innervating the putamen in an age‐matched CTRL several axons containing TH can be seen scattered within these bundles. The number of axons transporting TH at any given time was a fraction of the total axons present in this pathway. An axon usually contained a variable number of TH cargo that ranged in axon length from 10 μm to 70 μm. The variable length was not a function of tissue thickness or image acquisition. TH cargo are transported in axons as rod‐shaped structures varying in cross‐sectional diameter from ∼0.5 μm to ∼1.2 μm with a length of ∼2.5 μm and move along a normal axon in single file (A, D). TH+ axons contain a small number of cargo that are positive for ubiquitinated proteins (UB, B, C) or flαSYN (E, F). To identify location within an axon, it is necessary to look at all three planes for a particular cargo. The orthogonal planes were selected to optimize visualization of one ubiquitinated protein (C) and one flαSYN (F) cargo. A series of adjacent cargo for ubiquitinated proteins or flαSYN was not seen, unlike those for TH.
Figure S4. Nerve terminals in mouse striatum and human putamen. Antigen retrieval (AR) was not required with mouse tissue (A–C) as it was lightly fixed. TH (A, red, Fischer Scientific) was found to frequently colocalize with flαSYN (B, green, Sigma) in terminals and distal axon branches in the mouse. TH labeled both the distal axon branch leading to a terminal and the terminal, whereas flαSYN was more often restricted to a terminal. Terminals most often appeared disc shaped. Nerve terminals in human putamen (D–F and G–I) were labeled for flαSYN (D, F, red, Biomol) and TH (D–F, dark blue) and were found to frequently colocalize with the terminal specific protein synaptophysin (E, F, green) using WB‐AR. The need for PK‐AR to visualize the majority of TH in human tissue reduced its colocalization with soluble flαSYN and synaptophysin which were more sensitive to PK‐AR. PK‐AR did not affect a pre‐synaptic marker for the glutamatergic system, vGLUT1 (Lower Panel, H, I) which did not colocalize with TH.
Figure S5. Possible lesions before incidental Lewy body disease. Unique abnormalities were found in the nucleus and soma of rare TH+ neurons in the SN of a CTRL case. Abnormalities included an aggregate in the axon hillock region that contained both flαSYN (B) and UB (E). UB was also found in neurites in a manner not seen in other CTRL cases (E). UB+ Marinesco bodies were seen in many TH+ neurons (as reported by others), some of which also contained the axon hillock aggregate (E). Rarely, Marinesco bodies contained TH (G) and pαSYN (H).
Table S1. Antibodies and nuclear stain used in this report. Abbreviations: Rbt = rabbit; Chk = chicken; Gt = goat; Ms = mouse; Gp = guinea pig; FFPE = free‐floating paraffin embedded; conc. = concentration; flαSYN = full length human αSynuclein; PK = proteinase K; Synapto = synaptophysi; TH, tyrosine hydroxylase = tαSYN, truncated αSYN; UB = ubiquitin; vGLUT1 = vesicular glutamate transporter 1; WB = water bath.
Video S1. A TH+ neuron with two attached brain stem‐type Lewy bodies from a PDP case labeled for tαSYN (red), flαSYN (green), TH (violet) and the nucleus (DAPI, light blue). The video starts with all channels visible. Two brain stem‐type Lewy bodies of different sizes are joined together, along with an eccentric nucleus to the left of the large brain stem‐type Lewy body. The TH+ neuron is surrounded by the nuclei of other cells. The video starts by turning off the flαSYN channel revealing both tαSYN and TH present in the brain stem‐type Lewy bodies (purple). Then, the tαSYN channel is then turned off revealing only the TH channel (violet) and nuclei. All channels are turned on and the cell is zoomed and rotated. The volume viewer is turned off and an orthogonal slice viewer (0.5 μm thickness) is turned on and moved through the cell from bottom to top stopping first in the midportion of the large brain stem‐type Lewy body where the TH channel is turned off revealing the large brain stem‐type Lewy body to have a concentric ring of tαSYN (red) surrounded by flαSYN (green) with a spiky appearance. The flαSYN (green) channel is then turned off. All channels turned on and the orthogonal viewer is moved to the center of the smaller brain stem‐type Lewy body. The TH channel is turned off, the two brain stem‐type Lewy bodies can be seen joined together by flαSYN. The spiky outer ring of a brain stem‐type Lewy body can be seen. The center of the brain stem‐type Lewy bodies can be seen and would be filled with a variety of proteins some of which would be ubiquitinated. The flαSYN channel is turned off, then all channels are turned on, the orthogonal slicer finishes its path. The orthogonal viewer is turned off and the volume viewer turned on and the cell is reduced in size and oriented as it began. For all videos using a PDP case and the SN, the FFFF method was used for IHC with no antigen‐retrieval and a tissue thickness of 30 μm.
Video S2. A TH+ neuron in the SN with both neuronal diffuse cytoplasmic accumulation and a Pale body from a PDP case labeled for tαSYN (red), pαSYN (green), TH (violet) and the nuclei with DAPI (light blue). The video starts with all channels on, the tαSYN (red), pαSYN (green) channels are then turned off revealing TH and the nucleus, the cell is then enlarged and rotated, the nuclear channel turned off, the TH channel turned off and the tαSYN (red) channel turned on and then off, the pαSYN (green) channel turned on, and the tαSYN (red) channel turned on again. The volume display is turned off the orthogonal slicer turned on and moved through the neuron in both directions revealing a pale body and details of localization of fibrils in the soma and axon. The orthogonal slicer is stopped at the level of the pale body and the tαSYN (red) and pαSYN (green) channels turned on and off. The neuron is then returned to its original orientation and magnification.
Video S3. A neuron from a CTRL case labeled for TH (red), flαSYN (green) and nucleus (blue). The video starts with TH and nuclei visible, then flαSYN is turned on then off, the cell is magnified and rotated, then flαSYN is turned back on, rotation continued, flαSYN turned off and the image reduced. TH can be seen as punctate in the soma, axons and dendrites. flαSYN can be seen as punctate in synapses, but also rarely in the cell soma and nucleus.
Video S4. A TH+ dystrophic neurite (DN) in the SN from a PDP case was labeled for tαSYN (red), ubiquitin (green), TH (violet) and nuclei counterstained with DAPI (light blue). The video starts with all channels on and the DN in the center of the image surrounded by TH+ neurites (violet). The image is zoomed, tαSYN (red) and ubiquitin (green) are turned off, then on and the DN rotated ∼90° to look down the length of the DN. The orthogonal slicer is turned on and the volume view turned off, different channels are turned on and off, then the DN enlarged and individual channels examined. tαSYN, ubiquitin and TH can be seen within the DN and a laminar pattern not seen with these proteins.
Video S5. Two TH+ axons are shown in the axon pathway adjacent to the Put in a CTRL case. The section was labeled for flαSYN (red), TH (violet) and nuclei counterstained with DAPI (light blue). A 15 μm FFPE section was used in the absence of PK‐AR to demonstrate flαSYN. The video starts showing the two axons and two nuclei. The video begins to zoom in on the lower portion of the axons and the DAPI channel turned off. The image is rotated to demonstrate the size, shape and discrete nature of both TH and flαSYN as axonal cargo being transported along an axon. The oblique slicer is then used in two planes to show the flαSYN cargo (red) are located in the axon between TH cargo. flαSYN can also be seen to be located in puncta, possibly outside of axons. The image is then returned to its initial size and position.
Supporting info item
Supporting info item
Supporting info item
Supporting info item
Supporting info item
Supporting info item
Supporting info item
Supporting info item
Supporting info item
Supporting info item
Supporting info item