Abstract
The present study was designed to evaluate the hepatotoxicity of aluminium oxide (Al2O3). To achieve this objective, Al2O3 of three different sizes (30nm, 40nm and bulk) was orally administered for 28 days to 9 groups of 10 Wistar rats each, at the dose of 500, 1000 and 2000 mg/Kg/rat. A tenth group of 10 rats received distilled water and served as control. After 28 days of exposure, the animals were sacrificed and the serum was collected and tested for the activity levels of aminotransferases (AST or GOT and ALT or GPT), alkaline phosphatase (ALP) and lactate dehydrogenase (LDH) enzymes following standard testing methods. Reduced glutathione (GSH) content was also measured in the liver tissue to study the oxidative stress. A histopathological evaluation was also performed to determine the extent of liver injury. Study results indicated that the activity of both the aminotransferases (AST and ALT), ALP and LDH increased significantly in Al2O3 treated rats compared to control animals. The increase was found to be more pronounced with Al2O3 – 30nm followed by Al2O3 – 40nm and Al2O3 – bulk treated rats in a dose dependent manner. However reduced glutathione content showed a decline in the activity. Ultra structural assessment showed significant morphological changes in the liver tissue in accordance with biochemical parameters. Taken together, the results of this study demonstrated that Al2O3 is hepatotoxic and the smaller size of this nanomaterial appeared to be the most toxic while the compound in the bulk form seemed to be the least toxic
Keywords: Al2O3, hepatotoxicity, AST, ALT, ALP, LDH, reduced glutathione, histopathology, Wistar rats
INTRODUCTION
Aluminium is the third most abundant metal after oxygen and silicon in the earth’s crust. It is widely distributed and constitutes approximately 8 percent of the earth’s surface layer. However, Aluminium is a very reactive element and is never found as free metal in nature. It is found combined with other elements, most commonly with oxygen, silicon and fluorine. These chemical compounds are commonly found in soil, minerals (e.g. sapphires, rubies, turquoise), rocks and clays. Small amounts of aluminium are even found in water in dissolved or ionic form. The most commonly found ionic forms of aluminium are complexes formed with hydroxyl ions.
Aluminium is highly used because of its excellent properties [1]. It is used as a food additive and in materials that are in contact with food stuffs [2]. It is also used in water purification systems as a coagulation or flocculation agent. It is found in water intended for human consumption with a maximum concentration of 0.2 mg/L [2]. This metal is also used in the preparation of some drugs [3, 4].
Nanotechnology involves the creation and manipulation of materials at nanoscale levels typically ranging from 1 to 100 nm. There is a tremendous increase in the number of nanotechnology applications involving the use and design of different types of nanomaterials. This is because of their distinctive properties (e.g., chemical, mechanical, optical, magnetic and biological) which make them desirable for industrial and health care applications [5]. Further widespread manufacture and use of nanobased products generate multiple sources of their release into the environment, water and food supplies which may lead to human exposure. The characteristic properties of nanomaterials (i.e., high surface area to volume ratio) give them a unique mechanism of toxicity [6]. i.e., the smaller the size of particle, the deeper it can travel into the organs and slower the clearance rate from the deposition sites [7]. Moreover the increased surface area of smaller particles exhibit greater biological activity when compared with the usual particles of equilvalent mass. Other properties like chemical composition, size and shape may also amplify the surface effects. Hence smaller particles are more reactive and have different biological activity from their conventional bulk materials [4, 8].
Among various nanomaterials, aluminium oxide (Al2O3) nanoparticle is one of the most important because of its promising technological application. It is currently one of the two U.S. market leaders for nanosized materials [9]. Aluminium (Al) and Al2O3 nanomaterials are widely used in site specific drug delivery systems to increase solubility. They are also used in explosives, ammunitions, artillery surface coatings, lithium batteries, resistant coatings on propeller shafts, fuels in boosters, missiles and rockets, gelled fuels, ceramic industry, scratch and abrasive resistant coatings on sunglasses, car finishing and flooring and orthopedic implants [10,11]. The use of nano Al in various applications leads to the release of the oxidized form of nano Al2O3 into the environment [12].
Although Al2O3 nanomaterials have a variety of applications, very few studies have demonstrated that exposure to Nano form of Al2O3 may lead to adverse effects such as genetic damage [13], Inflammatory response [14], carcinogenicity [15] cytotoxicity [16,17], Reactive oxygen species (ROS) generation and mitochondrial dysfunction [16], or impaired phagocytic function in human alveolar macrophages [18].
The liver is a vital organ that is responsible for many biochemical processes in biological systems. It drives a variety of metabolic reactions and synthesizes large number of enzymes [1]. Further, most of the toxic chemicals are metabolized in the liver, a condition that causes a high risk of injury and leads to hepatotoxicity [19]. Hence the present study was undertaken to assess the function of liver of wistar rats administered with Al2O3 nanoparticles by measuring the activities of transaminases such as (AST or GOT and ALT or GPT), alkaline phosphatase (ALP) and lactate dehydrogenase (LDH) in the serum sample. Reduced glutathione (GSH) content assay was carried out to study the oxidative stress in the liver tissue. Furhter to get insight of morphological alterations, ultrastructural examination of liver was carried out from treated and control rats.
MATERIALS AND METHODS
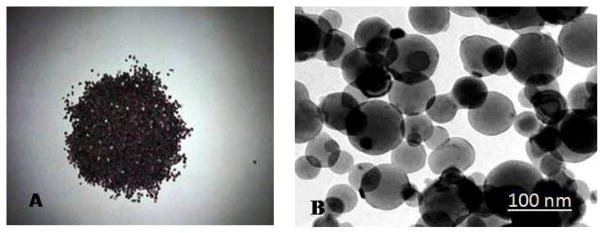
Al2O3 – 30nm and Al2O3 – 40nm both with a purity of over 90% were purchased from Nano Technologies, Austin, Texas, USA. Al2O3 bulk with a purity of 90% was purchased from Sigma Aldrich, St. Louis, MO (Figure 1).
Figure 1.
A: Bulk Aluminium oxide crystals B: Transmission Electron Microscope (TEM) image of Aluminium Oxide Nanoparticles (Al2O3).
All the other chemicals used in the present study were of Analytical grade and were purchased from Sigma Aldrich (St. Louis. MO, USA).
Treatment of Animals
Six to eight weeks old male Wistar (Albino) rats weighing about 100 – 120 g were purchased from National Institute of Nutrition (Hyderabad, India). The animals were fed on commercial pellet diet and received water-ad-libitum and allowed to acclimate to laboratory conditions for a week prior to experimentation. The animals were divided into 10 groups of 10 animals each (9 experimental and 1 control group). Al2O3 NMs were diluted with deionised water and administered to the rats orally by gastric intubation. The groups (1–9) considered as treatment groups were administered Al2O3 – 30nm, Al2O3 – 40nm and Al2O3 bulk (101.96) and the tenth group (10) animals considered as controls were given deionized water. The groups (1 – 9) were given 500, 1000 and 2000 mg/kg body weight/day of Al2O3 – 30nm Al2O3- 40nm and Al2O3 bulk for 28 days following organisation for Economic co-operation and Development (OECD) guidelines – 407[20]. The doses were selected based on the preliminary acute oral toxicity of Al2O3 – 30nm, Al2O3 – 40nm and Al2O3-bulk. The lethal dose LD50 of these compounds was >2000 mg/kg body weight (unpublished data). The treated and control rats were maintained at 22 – 25°C with relative humidity of 30 – 70 % and 12 hours light and 12 hours darkness. The experiments were conducted in strict accordance with directive 86/609/EEC on the protection of laboratory animals. Institutional Animal Ethics Committee approved the study. The treated animals were observed daily for any behavioural patterns whereas the feed consumption and body weight were monitored daily for 4 weeks. All the treated rats were sacrificed by cervical dislocation after 24hr of last administration of a dose. Blood samples were collected immediately from the ventricle of the sacrificed animals by using a disposable syringe. Serum was separated and used for the estimation of transaminases (AST and ALT), ALP and LDH. Simultaneously liver tissue was removed and rinsed with saline solution (0.9% NaCl) and homogenised in 0.1 M phosphate buffer (pH 7.1) for the assay of reduced glutathione (GSH). Some portion of the liver tissue was cut & fixed in cold karnowsky fixative for electron microscope study.
Biochemical Parameters
Serum samples collected from both control and treated rats following 28 days exposure were used for the estimation of aspartate aminotransferase (AST or GOT), alanine aminotransferase (ALT or GPT), alkaline phosphatase (ALP) and lactate dehydrogenase (LDH) whereas the liver tissue was used for estimation of reduced glutathione (GSH) content.
Enzyme Analysis
Serum aminotransferases
To determine the activities of alanine or glutamate pyruvate transaminase (ALT/GPT) and aspartate or glutamate oxaloacetate transaminase (AST/GOT) in serum a method by Reitman and Frankel [21] was followed. Human serum contains many different transaminases. The two most commonly determined are ALT/GPT and AST/GOT. These enzymes catalyze the transfer of alpha amino groups from specific amino acids to alpha-ketoglutaric acid (α-KG ) to yield glutamic acid and oxaloacetic or pyruvic acid. The keto acids are then determined colorimetrically after their reaction with 2,4-dinitrophenyl hydrazine [DNP]. The absorbance of the resulting color is then measured at a wavelength of approximately 505 nm to take advantage of the absorption that exists between the hydrazones of (α-KG) and the hydrazones of oxaloacetic acid or pyruvic acid.
The reaction for GOT is as follows:
The reaction for GPT is as follows
Determination of Alanine Transaminases (GPT)
The activity of ALT was determined using Sigma Aldrich kit.1.0 ml of Sigma-prepared alanine α-KG substrate (Catalog No 505-1) was pipetted out into test tubes for exposed and control samples and placed in 37° C water bath to warm. Next, 0.2 ml serum was added and gently shaken to mix and placed in the water bath. Exactly 30 minutes after adding serum, 1.0 ml Sigma color reagent (Catalog No. 505-2) was added, gently agitated, and left at room temperature for 20 minutes. 10 ml of 0.40 N (Normal) sodium hydroxide solution was added to the reaction mixture after 20 minutes, mixed by inversion, and left at room temperature for an additional 5 minutes. The absorbance was read and recorded at the same wavelength (505 nm) as used in preparing the calibration curve using water as a reference. The GPT activity was determined in Sigma Frankel (SF) units/ml from the corresponding readings on the calibration curve and expressed as IU/L.
Determination of Aspartate Transaminases (GOT)
The activity of AST was determined using Sigma Aldrich kit. 1.0 ml of Sigma-prepared aspartate substrate (Catalog No 505-1) was pipetted out into test tubes for exposed and control samples and placed in a 37° C water bath to warm. Next, 0.2 ml serum was added, gently shaken to mix, and placed in the water bath. Exactly 60 minutes after adding serum, 1.0 ml Sigma color reagent (Catalog No. 505-2) was added, gently agitated, and left at room temperature for 20 minutes. 10 ml of 0.40 N (Normal) sodium hydroxide solution was added to the reaction mixture after 20 minutes, mixed by inversion, and left it at room temperature for additional 5 minutes. The absorbance was read and recorded at the same wavelength (505 nm) as used in preparing the calibration curve, using water as a reference. GOT activity was determined in Sigma Frankel (SF) units/ml from the corresponding readings on the calibration curve and expressed as IU/L.
Determination of Alkaline phosphatase (ALP)
The ALP activity was determined using Sigma Aldrich kit (Catalog No – 221). This method utilizes 2 – amino – 2 – methyl – 1 propanol (AMP) buffer and involves only a 15-minute incubation. To 0.1ml of serum sample taken in a test tube, 0.5ml of 221 alkaline buffer solution and 0.5ml of stock substrate solution were added. The contents were mixed gently and placed in a water bath. Exactly after 15 minutes 10ml of 0.05N NaOH was added and mixed well by inversion. Alkali stops the reaction and develops colour which is stable for several weeks. The initial absorbance was read at 410nm against 0.1ml of water as reference. The activity of alkaline phosphatase was dete9rmined based on the reading from the calibration curve generated as described below. Then 0.2ml of conc. HCl was added to each tube and mixed well. The acid removes the colour. The final absorbance of the sample was measured against water and the ALP activity was determined using the calibration curve. Both the final and initial ALP activity was subtracted from each other yielding corrected alkaline phosphatase activity of the serum sample. The calibration curve was generated by preparing different dilutions of p-Nitro phenol with 0.02N NaOH and the absorbance was read for each of the mixtures at 410nm using 0.02N NaOH as reference. The ALP activity was determined in Sigma Frankel (SF) units/ml and expressed as IU/L.
Determination of Lactate dehydrogenase (LDH)
The activity of LDH was determined using Sigma Aldrich Kit (Catalog No-MAK066) in which LDH reduces NAD to NADH which is specifically detected by microplate colorimetric assay. 0.01 ml of serum sample in duplicate was added to the microplate wells. LDH assay buffer was added to each well to bring the volume to 50μl. Then 50μl of the master reaction mix was added to each of the wells prepared by mixing 48μl of LDH assay buffer and 2μl of LDH substrate mix. The contents were mixed well using a horizontal shaker or by pipetting. After 2 – 3 min., the initial absorbance was measured at 450nm (A450) initial. The plate was incubated at 37°C taking the measuerments (A450) every 5 min. The plate was protected from light during the incubation. The final measurement (A450) was taken when the value was within the linear range of standard curve. The change in the measurement from Tinitial to Tfinal was calculated for the samples as given below.
Then ΔA450 of each sample was compared with the standard curve to determine the amount of NADH generated by the assay between Tinitial and Tfinal. The standard curve was prepared by adding 2,4,6,8 and 10μl of the 1.25 mM NADH standard in duplicate to the microplate wells generating 2.5, 5, 7.5, 10 and 12.5 nmole/well standards and treated in the same way as for the serum sample.
The LDH activity was determined by the following equation
B = Amount (nmole) of NADH generated between Tinitial and Tfinal.
Reaction time = Tfinal – Tinitial (minutes)
V = Sample volume (ml) added to well.
The LDH activity was determined in Sigma Frankel (SF) units/ml and expressed as IU/L.
Determination of Reduced Glutathione (GSH)
GSH activity was determined in the liver tissue following the method of Ellman [22]. The tissue homogenate prepared in 0.1 M phosphate buffer, (pH 7.4) was taken and added with equal volume of 20% trichloroacetic acid (TCA) containing 1mM EDTA to precipitate the tissue proteins. The mixture was allowed to stand for 5 min and centrifuged at 2000 rpm for 10min. An aliquot of 50μl tissue supernatant was mixed with 1.7 ml of disodium hydrogen phosphate solution (0.3M). The final volume of 2ml was made by adding 250μl of Ellman’s reagent (DTNB reagent – 4mg of 5, 5 dithiobis (2-nitrobenzoic acid) in 10ml of 1% (w/v) sodium citrate). The absorbance of the sample was measured at 412nm against a reagent blank.GSH solution of known concentrations (10 – 50μg) was processed simultaneously to prepare a standard curve. The amount of GSH in the sample was compared with the standard curve generated from GSH and was expressed as nmole/mg protein.
Statistical Analysis
The statistically significant changes between treated and control groups were analysed by one – way analysis of variance. All the results were expressed as mean ± S.D. The value of p < 0.05 was considered to be statistically significant.
Ultra Structural study
For the electron microscopy study, small fragments (about 1mm size) of the liver tissue were cut from both the control and treated rats and fixed in cold karnowsky fixative. Later, they were postfixed in 2% buffered (0.2M) osmium tetroxide. Excess of fixative was washed with 0.1M sodium cacodylate buffer and then dehydrated in ascending grades of ethanol from 30% to 100%. The dehydrated samples were then cleared in propylene oxide at room temperature. The sections were then infiltrated in tandem with a mixture of resin and propylene oxide and finally embedded in resin. Further, the processed tissues were inserted into plastic beam capsules of 1 cm size and dried in a vacuum oven for 1 to 2 days at 50 – 60°C. Ultra thin sections of about 600 – 900°A were then cut using an ultramicrotome (Leica ultracut UCT – GA D/E – 1600, Wetzlar, Germany) and collected on double coated 200 mesh copper grids. Later the sections were double stained with uranyl acetate and lead citrate and scanned by Hitachi H 7500 Transmission electron microscope at 60 – 80 KV (Tokyo, Japan) [23].
RESULTS
Clinical Signs, food intake, body weight and organ weight
Mortality was not observed in rats throughout the experimental period. However towards the end of the experimental period, treated rats showed abnormal behavioural patterns such as sluggishness, dullness, lethargy and irritation. Further the rats showed insignificant loss in food intake, body weight and organ weight.
Biochemical Analysis
Transaminases
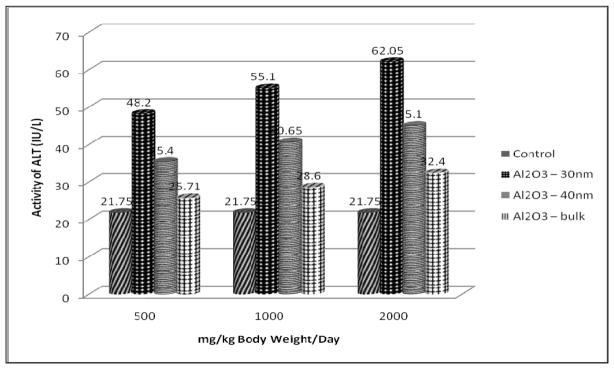
The results of transaminases assay (AST and ALT) are presented in Figures 2 and 3 respectively. Both the transaminases showed a significant increase in the serum of Al2O3 – 30nm, - 40nm and - bulk treated rats when compared with the control group in a dose – dependent manner. It is observed that both AST and ALT increased significantly at 1000 and 2000 mg/kg dose. However the increase was found to be more in Al2O3 – 30nm followed by Al2O3 - 40nm and Al2O3-bulk treated rats.
Figure 2.
Effect of Al2O3 NMs and Bulk on AST Activity in Serum of Male Wistar Rats
Figure 3.
Effect of Al2O3 NMs and Bulk on ALT Activity in Serum of Male Wistar Rats
Alkaline Phospatase
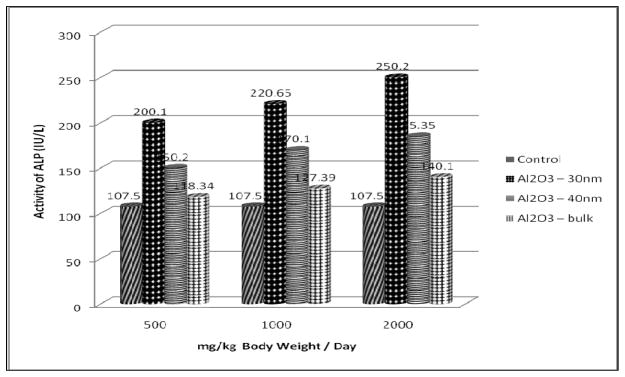
The results of ALP assay are presented in Figure 4. In the present study Al2O3 NMs significantly increased the activity of ALP in the serum of treated rats in a dose – dependent manner when compared with the control group. However, there was a significant increase in ALP activity at 1000 and 2000 mg/Kg dose. Further the increase was found to be more in Al2O3-30nm followed by Al2O3-40nm and Al2O3-bulk treated rats.
Figure 4.
Effect of Al2O3 NMs and bulk on ALP Activity in Serum of Male Wistar Rats
Lactate dehydrogenase
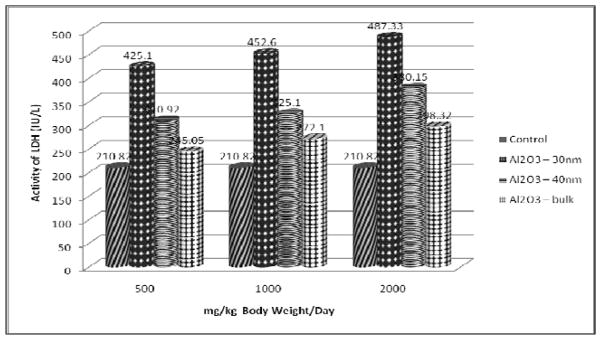
The results of LDH assay presented in figure 5 show a significant increase in the serum of treated rats when compared with the control in a dose – dependent manner with maximum elevation observed at 2000 mg/kg dose. However the increase was found to be more in Al2O3-30nm followed by Al2O3-40nm and Al2O3-bulk treated rats.
Figure 5.
Effect of Al2O3 NMs and bulk on LDH Activity in Serum of Male Wistar Rats
Reduced Glutathione
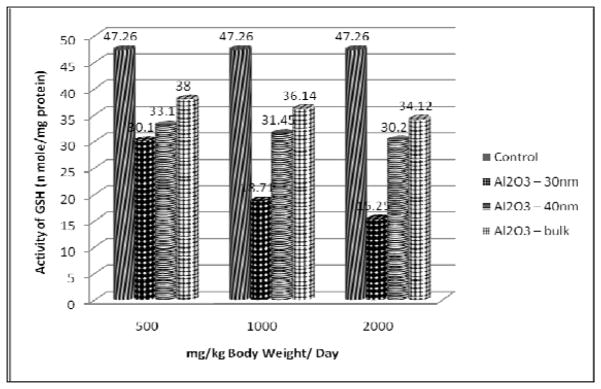
The results of GSH content presented in Figure 6 show a significant decline in the liver of rats treated with 500, 1000 and 2000 mg/kg dose of Al2O3 NMs. However the decline was found to be more in Al2O3-30nm, followed by Al2O3-40nm and Al2O3 bulk treated rats.
Figure 6.
Effect of Al2O3 NMs and Bulk on GSH content in the liver of Male Wistar Rats
Histopathological Evaluation
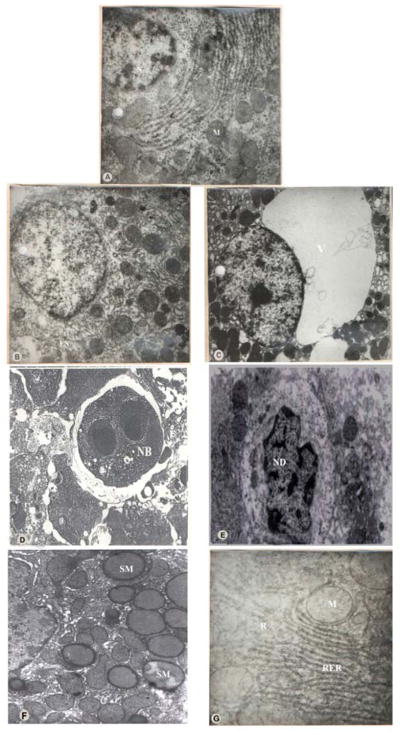
The results of the ultra structural study are illustrated in Figure 7. The normal architecture of the liver is shown in (A). The ultra structure examination of liver of the treated rats revealed a number of degenerative changes when compared with the control group at 2000 mg/kg dose as against the other 2 doses. However, the abnormalities observed were more prominent in Al2O3 -30nm followed by Al2O3-40nm. The most prominent changes observed in the liver consisted of focal necrosis (B) and extensive cytoplasmic vacuolization of the hepatocytes (C). Some of the hepatocytes showed a number of necrotic bodies which included autophagic vacuoles and lysosome like hyaline microbodies filled with dense deposits mostly rounded to ovoid in shape, varied in size and were lined by a thin membrane (D). The necrotic bodies were mainly found in the hepatocytes and within the sinusoids. A few of the hepatocytes were also found to be swollen. The nuclei were greatly shrunken and showed nucleolar degeneration (E). Further, the mitochondria from the treated group were fewer in number, slightly smaller with fewer cristae and appeared rounded and swollen instead of long and slender. The cristae became indistinct and the matrix appeared dense and homogenous (F). The RER was disrupted and markedly disorganised with increase in the number of free ribosomes (G).
Figure 7.
Transmission Electron Microscope (TEM)
A: TEM of the liver of Control Rat.
B: TEM of the liver of Al2O3-30nm treated rats showing Focal necrosis.
C: TEM of the liver of Al2O3-30nm treated rats showing Extensive cytoplasmic vacuolization.
D: TEM of the liver of Al2O3-30nm treated rats showing a Necrotic body with dense deposits.
E:TEM of the liver of Al2O3-30nm treated rats showing Nucleolar degeneration.
F:TEM of the liver of Al2O3-40nm treated rats showing swollen Mitochondria.
G: TEM of the liver of Al2O3-40nm treated rats showing disrupted RER with increase in number of Ribosomes.
N: Nucleus; M: Mitochondria; FN: Focal Necrosis; V: Vacuolization;
NB: Necrotic Body; ND: Nucleolar Degeneration; SM: Swollen Mitochondria;
R: Ribosomes; RER: Rough Endoplasmic Reticulum
All these alterations in the architecture of the liver from the treated group thus gave a disorganized appearance.
DISCUSSION
Liver cells or hepatocytes are easily disintegrated by a variety of factors and harmful products [1], and accumulation of aluminium in the liver cause alterations of hepatic function [24]. Degeneration, inflammation and necrosis caused by hepatocyte damage can lead to an increase in the permeability of cell membrane. Thus AST and ALT are released into the body through the cell membrane and hence their concentration in the blood increases. AST and ALT are indicators of liver damage [1, 25–28]. In the present study, the activities of AST and ALT increased significantly in the serum of treated rats when compared with the control group. Thus these results were further comparable with the results of previous studies [1, 27, 29–33].
In the present study Al2O3NMs significantly increased the activity of ALP enzyme in the serum of treated rats in a dose –dependent manner suggesting possible injuries to the liver tissue. Alkaline phosphatase (ALP) enzyme, one of the main group of the family of phosphatases [34] is widely used as an indicator of hepatobiliary disease and elevation of ALP in the serum is usually indicated in liver damage, cancer and heart dysfunction [35].
LDH enzyme is used to evaluate tissue damage of the affected organ [36–37], and serum LDH is a biomarker of liver tissue lesions [38]. Cell necrosis leads to increased LDH in tissue and serum [39]. LDH release in the blood is an indicator of cell death and disintegration of cell membrane[40]. Further LDH is a marker of aluminium toxicity [36]. In the present study also serum LDH was very high in rats treated with aluminium oxide. It increased significantly in rats treated with Al2O3 nanomaterials when compared to control. The results of this study are consistent with those of prevoius studies [25–26] and [39, 41].
In the present study in the liver of rats treated with 500, 1000 and 2000 mg/kg dose of AL2O3NMs, the GSH content declined significantly. GSH is an important non-protein thiol present in the animal cells [42]. It is a key component of the cellular defense cascade against injury caused by ROS [43]. Futher the level of GSH in tissues also serves as an indicator of oxidative stress [43].
Many reports are available on light microscopy studies of rat liver subjected to aluminium and Al2O3 nanoparticles but the reports on ultrastructural studies are scarce and indeed the first one. According to Bhadauria [31] aluminium exposure caused loss of cord arrangement of hepatocytes and sinusoidal spaces with degenerated plasma membranes and nuclei. He also reported central vein filled with debris and severe necrosis. Distorted sinusoids and congested central vein of the liver of aluminium treated rats was mentioned by Buraimoh et al.,[44]. Cell damage was also reported by Tehrani et al.,[45], in the liver of aluminium exposed animals. The above results thus bear a testimony to our findings.
CONCLUSION
The results of the present study demonstrate that injuries to the liver and oxidative stress increased the activities of AST, ALT, ALP and LDH and diminished the reduced glutathione (GSH) content in the Al2O3 NM treated rats when compared to the control animals.
The distinguishing character of nanomaterials is their size. They are classed between individual atoms or molecules and their corresponding bulk materials. In case of nanomaterials size matters as it facilitates for an increased uptake and interaction with biological tissues thus generating adverse effects. Further adverse effects from the use of nanomaterials may also arise as a result of chemical composition. Hence in the present study, the toxicity of nanomaterials was compared based on size and composition. It is thus revealed that nanoparticles administered through oral route showed a significant alteration in the activity of aminotransferases, ALP, LDH and GSH content followed by various ultrastuctural changes in the liver tissue. Also the smaller size of the nanomaterial proves to be more potent and toxic in bringing about the deleterious effects than the same material in bulk form.
Acknowledgments
The authors are thankful to the principal of the college for extending all possible support and cooperation. NIH-RCMI Grant # G12MD007581 to Jackson State University is also acknowledged.
Footnotes
CONFLICT OF INTEREST STATEMENT
No conflict of interest
References
- 1.Bai CS, Wang F, Zhao HS, Li YF. J Northeast Agric Univ. 2012;19(2):62–65. [Google Scholar]
- 2.AFSSAPS. 2011, Rapport o’ expertise. Agence francaise de securite sanitaire des produits de sante. [Google Scholar]
- 3.Och manski W, Barabasz W. Przegl Lek. 2000;57:665–668. [PubMed] [Google Scholar]
- 4.Turkez H, Yousef Ml, Geyikoglu F. Food Chem Toxicol. 2010;48:2741–2746. doi: 10.1016/j.fct.2010.06.049. [DOI] [PubMed] [Google Scholar]
- 5.Oberdorster G, Maynard A, Donaldson K, Castranova V, Fitz Patrick J, Ausman K, Carter J, Kam B, Kreyling W, Lai D, Olin S, Monteiro-Riviere N, Warheit D, Yang H. Part Fibre Toxicol. 2005;6:2–8. doi: 10.1186/1743-8977-2-8. [DOI] [PMC free article] [PubMed] [Google Scholar]
- 6.Aillon KL, Xle Y, EL Gendy N, Berkland CJ, Forrest ML. Adv Drug Deliv Rev. 2009;61:457–466. doi: 10.1016/j.addr.2009.03.010. [DOI] [PMC free article] [PubMed] [Google Scholar]
- 7.Wang B, Feng WY, Zhu MT, Wang Y, Wang M, Gu Y, Ouyang H, Wang H, Li M, Zhao Y, Chai Z, Wang H. J Nanopart Res. 2009;11:41–53. [Google Scholar]
- 8.Nel A, Xia T, Madler I, Li N. Science. 2006;311:622–627. doi: 10.1126/science.1114397. [DOI] [PubMed] [Google Scholar]
- 9.Sadiq IM, Chowdhury B, Chandrasekaran N, Mukherjee A. Nanomedicine. 2009;5:282–286. doi: 10.1016/j.nano.2009.01.002. [DOI] [PubMed] [Google Scholar]
- 10.Tyner KM, Schiffman SR, Giannelis EP. J Can Re. 2004;95:501–514. doi: 10.1016/j.jconrel.2003.12.027. [DOI] [PubMed] [Google Scholar]
- 11.Monteiro – Riviere NA, Oldenburg SJ, Inman AO. J Appl Toxicol. 2010;30:276–285. doi: 10.1002/jat.1494. [DOI] [PubMed] [Google Scholar]
- 12.Coleman JG, Johnson DR, Stanley JK, Bednar AJ, Weiss CA, Jr, Boyd RE, Steevans JA. Environ Toxicol Chem. 2010;29:1575–1580. doi: 10.1002/etc.196. [DOI] [PubMed] [Google Scholar]
- 13.Balasubramanyam A, Sailaja N, Mahboob M, Rahman MF, Hussain SM, Grover P. Mutagenesis. 2009;24:245–251. doi: 10.1093/mutage/gep003. [DOI] [PubMed] [Google Scholar]
- 14.Oesterling E, Chopra N, Gavalas V, Arzuaga X, Lim EJ, Sultana R, Butterfield DA, Bachas I, Henning B. Toxicol Lett. 2008;178:160–166. doi: 10.1016/j.toxlet.2008.03.011. [DOI] [PubMed] [Google Scholar]
- 15.Dey S, Bakthavatchalu V, Tseng MT, Wu P, Florence RL, Grulke EA, Yokel RA, Dhar SK, Yang HS, Chen Y, St Clair DK. Carcinogenesis. 2008;29:1920–1929. doi: 10.1093/carcin/bgn175. [DOI] [PMC free article] [PubMed] [Google Scholar]
- 16.Chen L, Yokel RA, Henning B, Toborek M. J Neuroimmune pharmacol. 2008;3:286–295. doi: 10.1007/s11481-008-9131-5. [DOI] [PMC free article] [PubMed] [Google Scholar]
- 17.Di Virgillo AI, Reigosa M, de Mele MF. J Biomed Matter Res. 2010;92:80–86. doi: 10.1002/jbm.a.32339. [DOI] [PubMed] [Google Scholar]
- 18.Braydich – Stolle LK, Speshock JL, Castle A, Smith M, Murdock RC, Hussain SM. ACS Nano. 2010;4:3661–3670. doi: 10.1021/nn9016789. [DOI] [PubMed] [Google Scholar]
- 19.Patlolla A, McGinnis B, Tchounwou P. J Appl Toxicol. 2011;31:75–83. doi: 10.1002/jat.1579. [DOI] [PMC free article] [PubMed] [Google Scholar]
- 20.OECD guidelines for the testing of Chemicals: 2008, Guidelines 407. Organisation for Economics cooperation and Development; Paris: [Google Scholar]
- 21.Reitman FS. Am J Clin Pathol. 1957;28(1):56–63. doi: 10.1093/ajcp/28.1.56. [DOI] [PubMed] [Google Scholar]
- 22.Ellman GL. Arch Biochem Biophys. 1959;82:70–77. doi: 10.1016/0003-9861(59)90090-6. [DOI] [PubMed] [Google Scholar]
- 23.Ladinsky MS, Pierson JM, McIntosh RJ. Journal of Microscopy. 2006;224:129–134. doi: 10.1111/j.1365-2818.2006.01674.x. [DOI] [PubMed] [Google Scholar]
- 24.Nikolov IG, Joki N, Vicca S, Patey N, Auchere D, Benchitrit J, Fllnois JP, Ziol M, Beaune P, Drueke TB, Lacour B. Nephron Exp Nephrol. 2010;115:112–121. doi: 10.1159/000313492. [DOI] [PubMed] [Google Scholar]
- 25.Chinoy NJ, Memon MR. Fluoride. 2001;34:21–33. [Google Scholar]
- 26.EL-Demerdash FM. J Trace Elem Med Biol. 2004;18:113–122. doi: 10.1016/j.jtemb.2004.04.001. [DOI] [PubMed] [Google Scholar]
- 27.Yeh YH, Lee YT, Hsieh HS, Hwang DF. Eur J Clin Nutr Metabol. 2009;4:187–192. [Google Scholar]
- 28.Shati AA, Alamri SA. Saudi Med J. 2010;31:1106–1113. [PubMed] [Google Scholar]
- 29.Zhou JH, Liu P, Feng GC, Pingguo C. Clin J Public Health. 2007;23(3):316–317. [Google Scholar]
- 30.Ma YJ, XU JG, Lin JY. Dis. 2008;34(6):325–328. [Google Scholar]
- 31.Bhadauria M. Food chem Toxicol. 2012;50:2487–2495. doi: 10.1016/j.fct.2011.12.040. [DOI] [PubMed] [Google Scholar]
- 32.Denen A, Samuel OO, Joseph ET, Egesie UG, Ejike DE. Int J Pharm Sci Invent. 2015;4(5):5–8. [Google Scholar]
- 33.Kalaiselvi A, Aadhinath Reddy G, Ramalingam V. Int J pharm Sci Drug Res. 2015;7(1):52–58. [Google Scholar]
- 34.Harrison S, Page CP, Spina D. Gen Pharmacol. 1999;32:287–298. doi: 10.1016/s0306-3623(98)00204-3. [DOI] [PubMed] [Google Scholar]
- 35.Jaruslaw S, Armand M, Gizowska M, Marcinek M, Sasim E, Szafran E, wieczorek Wladyslaw. Journal of power sources. 2009;194:66–72. [Google Scholar]
- 36.Anane R, Creppy EE. Hum Exp Toxicol. 2001;20:477–481. doi: 10.1191/096032701682693053. [DOI] [PubMed] [Google Scholar]
- 37.Bhatti GK, Sidhu IPS, Saini NK, Puar SK, Singh G, Bhatti JS. IOSR J Environ Sci Toxicol Food Technol. 2014;8(1):39–48. [Google Scholar]
- 38.Suzuki KT, Kano S, Misawa S, Aoki Y. Toxicology. 1995;97:81–92. doi: 10.1016/0300-483x(94)02927-m. [DOI] [PubMed] [Google Scholar]
- 39.Turkez H, Geyikoglu F, Colak S. Turk J Biol. 2011;35:293–301. [Google Scholar]
- 40.Lindell SL, Hansen T, Rankin M, Danielewicz R, Belzer FG, Southand JH. Transplantation. 1996;61:239–247. doi: 10.1097/00007890-199601270-00014. [DOI] [PubMed] [Google Scholar]
- 41.Patlolla AK, Berry A, Tchounwou PB. Mol and Cell Biochem. 2011;358(1–2):189–199. doi: 10.1007/s11010-011-0934-y. [DOI] [PMC free article] [PubMed] [Google Scholar]
- 42.Oskaya A, Celik S, Yuce A, Sahin Z, Yilmaz O. Vet Fak Derg. 2010;16(2):263–268. [Google Scholar]
- 43.Hsu CH, Han BC, Liu MY, Yeh CY, Casida JE. Free Radic Biol Med. 2000;28(4):636–642. doi: 10.1016/s0891-5849(99)00277-4. [DOI] [PubMed] [Google Scholar]
- 44.Buraimoh AA, Ojo SA, Hambolu JO, Adebisi SS. IOSR J Pharm. 2012;2(3):525–533. [Google Scholar]
- 45.Tehrani H, Halvaie Z, Shadnia S, Soltaninejad K, Abdollahi M. Clin Toxicol Phila. 2013;51(1):23–28. doi: 10.3109/15563650.2012.743029. [DOI] [PubMed] [Google Scholar]


