

Abstract
Household contact studies, a mainstay of tuberculosis transmission research, often assume that tuberculosis-infected household contacts of an index case were infected within the household. However, strain genotyping has provided evidence against this assumption. Understanding the household versus community infection dynamic is essential for designing interventions. The misattribution of infection sources can also bias household transmission predictor estimates. We present a household-community transmission model that estimates the probability of community infection, i.e. the probability that a household contact of an index case was actually infected from a source outside the home, and simultaneously estimates transmission predictors. We show through simulation that our method accurately predicts the probability of community infection in several scenarios, and that not accounting for community-acquired infection in household contact studies can bias risk factor estimates. Applying the model to data from Vitória, Brazil, produced household risk factor estimates similar to two other standard methods for age and sex. However, our model gave different estimates for sleeping proximity to index case and disease severity score. These results show that estimating both the probability of community infection and household transmission predictors is feasible, and that standard tuberculosis transmission models likely underestimate the risk for two important transmission predictors.
Keywords: Tuberculosis, Bayesian, Mixed Effects Models, Hierarchical Models, Infection, Risk Factor, Household, Community, Bias
Introduction
Background
Tuberculosis (TB) remains a significant global health challenge. In 2014, 1.5 million people died from the disease [1], and the World Health Organization (WHO) recently ranked TB above HIV as the world's most deadly infectious disease [2]. It is thought that fully one-third of the world population is infected with latent TB. The rise of multidrug-resistant TB strains (MDR-TB), mass migration and industrialization, imperfect diagnostic methods, the pressure of the HIV epidemic, and TB's long latency period have complicated efforts at TB elimination. (Latent, non-infectious TB can persist for decades before progressing to active disease, at which point an individual is symptomatic and infectious.) Treatment can be onerous, and choosing the appropriate treatment is not always straightforward, particularly in the case of latent TB infection [3].
TB spreads by droplet nuclei coughed by an infectious case. However, unlike influenza or measles, infection usually requires some duration of exposure. Studies dating back many years have established that transmission is more likely in close quarters [4]. Consequently, household transmission has been a focus of TB epidemiologic research for some time. The common protocol in household contact studies for TB is to follow household contacts of an index case with active disease and periodically test contacts for tuberculin skin test (TST) conversion, which indicates latent TB infection: a baseline TST reading that is positive indicates existing infection, while a conversion at some point during the study period indicates a new infection. However, standard methods for estimating of the risk of TB transmission drawn from households are inherently unreliable. Genetic strain analysis of TB strains is only feasible in the case of active pulmonary disease, which is unlikely to be observed in secondary cases in a household contact study due to the disease's long latency period. Strain analysis such as restriction fragment length polymorphism (RFLP) or spoligotyping of secondary cases with active disease has shown that anywhere from 10% to 70% of cases are strain-discordant with the index case [5-9]. This ambiguity in the source of the disease transmission complicates reliable estimation of risk factors for household-based transmission. However, little work has been done to address this issue; TB transmission models generally assume that all observed transmission is occurring only in the household [10-11]. The paucity of TB transmission models that adequately account for community-acquired infection has limited the effectiveness of strategies for interrupting disease transmission, which have often not been as effective as anticipated [12]. Understanding exactly how much TB transmission is occurring outside of immediate familial contact networks is essential information for public health institutions working to identify areas of highest risk and prioritize resources in an effort to disrupt transmission.
History of Transmission Models
Disease transmission models have a long history: the simple chain binomial models put forward by Lowell Reed, W.H. Frost, and M. Greenwood date to the 1920s [13-14], and the rudiments of these models were described even earlier by En'ko in the late 19th century [15]. Some models, for example the Chain Binomial model, describe the probability of escaping infection at the individual level, but with little extendibility for heterogeneous risk profiling and control of confounding.
In the 1980s, disease dynamics were given scrutiny outside the Reed-Frost-Greenwood paradigm. In 1982, Longini and Koopman described an approximate recursive maximum likelihood method to estimate the probability of household and community influenza infection in the absence of infection onset times [16]. In 1991, Addy et al. generalized the work of Longini and Koopman to allow more sources of heterogeneity in risk of transmission into their model [17]. In 2011, Brooks-Pollock et al. described an adaptation of the final-size model of Longini and Koopman for TB transmission using Markov chain Monte Carlo (MCMC) techniques. The Brooks-Pollock method has the benefit of being able to incorporate prior information into final estimates, but like the original frequentist method there are limits on the modeling of heterogeneity among both households and individuals.
In 2004 and 2009, Cauchemez et al. described two models, both for influenza, that estimate parameters such as duration of infectious period, serial interval—the time between successive infections in a disease transmission chain, and instantaneous risk of infection [18-19]. These models do account for possible community-acquired infection, but require calculation of the serial interval, which relies on daily measurements on study participants. These data are simply not available for TB, a disease characterized by a long asymptomatic period and unobserved transmission.
All the aforementioned methods are limited in terms of modeling individual-level covariates: the only additional variables analyzed in the Longini/Koopman models are household size and a binary age classification (child or adult). The most recent Cauchemez paper includes an “infectivity” variable for an index case, and for age of the household contact, but the control of bias from multiple confounding variables is not explored.
Our Contribution
We show through simulation that traditional methods for quantifying risk factors of household transmission in tuberculosis follow-up studies fall far short of the desired precision, and do not estimate the probability of acquiring infection in the community given proximity to a household contact with active disease—a crucially important public health metric. To address these problems, we propose an extension to a Bayesian generalized linear mixed effects model. This extension is intended to estimate the probability of a household contact of an index TB case becoming infected from a source outside the home (i.e. “the community”), and to decrease bias of risk factor estimates of household TB transmission by accounting for the risk of infection from the community among household contacts of a TB case. We demonstrate our method on simulated data, and on data from a recent household contact study in Vitória, Brazil, and compare our results with those of other commonly used models.
Methods
Unified Probability Model
Our proposed model extends existing hierarchical generalized linear model methods by introducing model elements that profile the probability of acquiring disease outside of the household, while also accounting for multiple household- and individual-level covariates. We forgo epidemic chain modeling and the complex serologic and surveillance apparatuses necessary for tracking household chains of infection. Instead, we use the standard cross-sectional beginning-and-end of study period method commonly used for TB household studies, which involves testing household contacts for latent TB at enrollment and then later during follow-up to see if a new infection has occurred. Our method captures the dynamics of household infection, discards the task of tracking transmission chains, and allows for the inclusion of covariates and potential confounders in the model. We refer to this model as the Unified Probability Model (UPM).
Household Infection
Denote probability of household infection for household contact j in household i as pijH, and let
where Xij is the vector tracking person- and household-level variables, β is a vector of coefficients, and bi is a random effect to account for the fact that observations are not independent, identically distributed, i.e. persons sharing the same household are more likely to be alike than members from different households. We assume that the random effect is Gaussian, bi ∼ N(μb, σ2b).
Community Infection
Denote the probability of community infection as
which implies that
The implicit assumption in the model is that the risk of community infection is identical for all persons: i.e. pijC = pC for all i, j, which means that individual characteristics are immaterial to community risk of infection, and that exposure to community risk is constant and homogeneous. This assumption is an obvious simplification, but has precedent in other household transmission models (ibid. Cauchemez, 2004).
Combining Sources Of Risk
Define the probability that person j in household i is infected as
where pijH is the probability of infection from a household source, pC is the probability of infection from a community source, and Yij is an indicator of infection. This transformation keeps the probability of being infected at all between 0 and 1, and if viewed from the vantage of escaping infection from independent risks rather than acquiring infection, is 1 minus the probability of escape from both sources of infection.
Model Estimation
For household i define set Ui as all persons uninfected, and set Ii as the set of all those infected. Denote the set of parameters to be estimates as
where index M is the number of households. The likelihood for the ith household is
The complete likelihood is then the product of the household cluster likelihoods. Typically in a mixed effects model the integral is approximated by numerical integration techniques such as Gaussian Quadrature. However, in the proposed model there is an additional parameter in the household likelihood term, α, which models community transmission. This added structure induces a weak non-identifiability in that the partial derivative of the log-likelihood with respect to α contains discontinuities, and complicating the standard frequentist likelihood methods for parameter estimation. Furthermore, given the substantial history of TB research, it is both helpful and reasonable to incorporate prior information about risk factors into the model. With these considerations in mind, we opt for a Bayesian implementation of the model. This formulation requires a specification of prior distributions on each parameter for estimation of posterior distributions. We address these decisions on prior specification in turn for the simulated data and actual data below.
Simulating Data
The goal of this model is to estimate the probability of community-acquired infection while also estimating household- and person-level risk factors of household infection among contacts of an infectious TB case. To that end, we set a given level of pC (0.10, 0.15, 0.40, and 0.60). For example, for pC = 0.15, 850 of 1000 people will have a risk of infection dependent on household and individual covariates, and 150 will be infected regardless of their individual risk of household infection.
Using the statistical software program R [20], for each pC specification, we created 2000 datasets, each of N = 1000 simulated household contacts. Each simulated person has five variables that form their risk of household infection. All simulated individual predictors except variable 4 which is binary, are normally distributed. Variable 5 is constant at the household level, and can be thought of as perhaps an index case characteristic such as disease severity score, or a household characteristic, such as number of windows in the home. Here we detail simulation result for pC = 0.15. Further material on simulated variables, model formulation, results for all pC specifications can be found in section 1 of the supplementary appendix; analysis of MCMC diagnostics to ensure adequate posterior distribution estimation can be found in section 2.
Simulated household size ranged from 2 to 12, which is consistent with the size of households in the observed household contact data from Brazil (median=5, max=14) and other TB household contact studies. Each person's probability of household infection is a logit-transformed linear combination of individual predictors with an additional modeled hierarchical effect specific to each household. The family-specific risk term incorporated into the linear component of household risk for all simulated data is a Gaussian random variable centered at 0.
To model the frequentist mixed effects model we used standard maximum likelihood estimation with the R package lme4 [21]. For the Bayesian mixed effects logistic model and the UPM, as the posterior distribution of parameters is not conjugate to the complex prior structure, we implemented MCMC estimation methods using the R package upmfit, which calls the JAGS software package, a program for Gibbs sampling, to generate posterior distributions for each variable [22-23]. For each modeled variable we generated three MCMC chains, each begun at unique, random starting values. For each model scenario we generated 100 thousand posterior samples, discarded the first 20 thousand, and took only every 200th sample for a final posterior sample size for each variable of 1200. We used standard diagnostic measures (analysis of trace, density, and autocorrelation plots, Gelman- Rubin statistics) to ensure adequate chain convergence; these analyses are presented in the supplementary appendix, section 2.
We assigned relatively non-informative prior distributions to all linear component variables. All prior betas are Gaussian with mean 0, variance 10. This variance, when transformed onto the logit scale, gives substantial prior variability in the odds ratios (OR) associated with each variable.
A major advantage of using a Bayesian framework for model estimation is the ability to inform posterior estimates by prior information. We generated posterior parameter estimates under several plausible scenarios: investigators may have reliable and accurate information on the burden of disease in the community; they may have inaccurate or incomplete information on the disease burden; or they may not feel confident asserting a claim on the probability that a person is infected outside the home when that person lives with an active TB case. The probability of community infection pC was given a prior distribution reflecting these three possible scenarios. If the prior probability distribution is correctly informative then the prior probability mean is centered at the true value with some variability about that value—the interquartile range (IQR) is within 10 percent of the true value; if it is wrongly informative then the prior probability mean is centered at a value closer to the other end of the unit interval than to the true value, again with some variability; if the prior distribution is designated uninformative, then the distribution is essentially uniform on the unit interval.
All simulated data were run 2000 times on three models: a frequentist mixed effects logistic model, a Bayesian mixed effects logistic model, and the UPM. The first two models, along with generalized estimating equation (GEE) models—not analyzed here—are standard practice for accounting for household clustering effects in follow-up studies, and do not account for the possibility of community-acquired infection.
Household Contact Study in Vitória, Brazil
We used data from the US-Brazil Research Collaboration on Strain Variation in Tuberculosis, a U.S. National Institutes of Health (NIH) initiative undertaken through the International Collaboration in Infectious Diseases Research (ICIDR) program. The study was designed to investigate, among other aims, the extent of TB transmission in household contacts exposed to an index case with acid-fast bacilli (AFB) smear-positive pulmonary TB, and was conducted at the Núcleo de Doenças Infecciosas (NDI) in Vitória, Brazil. Investigators enrolled 160 index cases and 838 household contacts, and recorded demographic, household, and index case disease characteristics. Index TB cases were screened and enrolled within 2 weeks after first presenting to their local TB clinic. Household contacts of index cases were evaluated with TST for latent tuberculosis infection (LTBI) at screening and again after 8 weeks if the first result was negative. Of 838 secondary contacts, 585 (70%) were found to be TST positive at baseline or to have TST conversion at 8-12 weeks. The study protocol and population have been described elsewhere [24-25].
We include in our models the variables: age of household contact, sex of household contact, an indicator as to whether the contact and the index case sleep in the same room, and a three-level disease severity score based on chest X-ray for the index case of each household; this last variable is identical for all persons residing in the same household. These four variables are thought to be potentially predictive of disease transmission. They were found to be statistically significant predictors in another study of household TB transmission for this population (Jones-López ibid.), and in a similar study currently under review for publication. The measured outcome variable is TST positivity at either the baseline or second reading.
We ran the same three models used in the simulation study on the observed Brazil data: the UPM, the Bayesian mixed effects logistic model, and the frequentist mixed effects logistic model. For the UPM and Bayesian mixed effects logistic model, each variable has three MCMC chains generated using non-informative priors. Diagnostic measures such as the Gelman-Rubin scale reduction statistic were monitored to ensure adequate chain convergence. The frequentist mixed effects model is estimated by maximum likelihood techniques using the R statistical software package.
Results
Simulation Study
We ran the simulated data through all three models under consideration: the standard-practice Bayesian and frequentist mixed effects logistic regression models and the UPM under three prior pC scenarios (uninformative, correctly informative, incorrectly informative), and here present results for true pC = 0.15. Results for simulations where pC = 0.00, 0.40, and 0.60 are presented in appendix section 1. When referring to the Bayesian mixed effects logistic model and the UPM, the term CI will refer to the Bayesian analog to the confidence interval, the credible interval, while for the frequentist model, it refers to the commonly understood confidence interval. All stated CIs are 95% confidence/credible intervals.
Figure 1, in the case of the UPM and Bayesian mixed effects logistic model, shows boxplots of posterior median estimates for each parameter for each model under consideration. For the frequentist mixed effects model, the boxplots show maximum likelihood parameter estimates.
Fig 1.
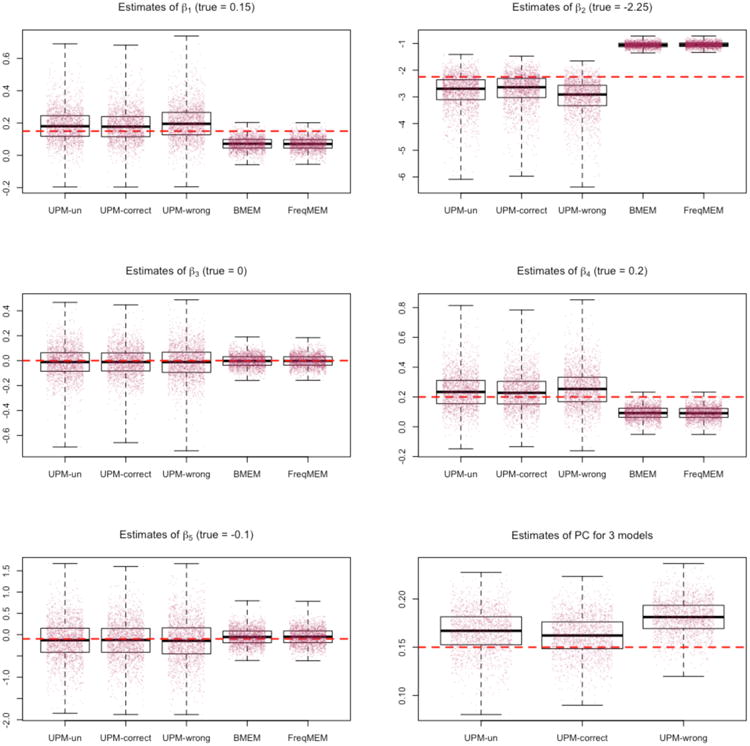
Estimates of 2000 simulations for pC = 0. Dotted lines are true parameter values.
The plots of Figure 1 show the UPM performance for three possible prior probability distributions on parameter pC. The UPM-un model has a prior probability for pC that is uniform on the unit interval, the UPM-correct model has a prior probability distribution on pC that is centered at 0.15 (the true value for this set of simulations) with an IQR between 0.10 and 0.20, and the UPM-wrong model has a prior probability distribution on pC that is centered at 0.50 with an IQR between 0.40 and 0.60.
For each scenario of prior for pC, the UPM model, even with a weak prior probability specification or an incorrect prior specification, accurately estimates the probability of community infection. Furthermore, the spread of posterior median values for the 2000 simulations is within a plausible range. There are no estimates that are substantially different, such as a posterior estimate of 0.60 when the true value is pC = 0.15, even in the case of an incorrect prior probability specification.
The median and 95th percentiles of 2000 posterior median estimates for community infection risk pC for the three prior probabilities—uninformative, correct, and incorrect—are all very close to the true value: 0.17 (0.12, 0.21); 0.16 (0.12, 0.20); and 0.18 (0.15, 0.22), respectively.
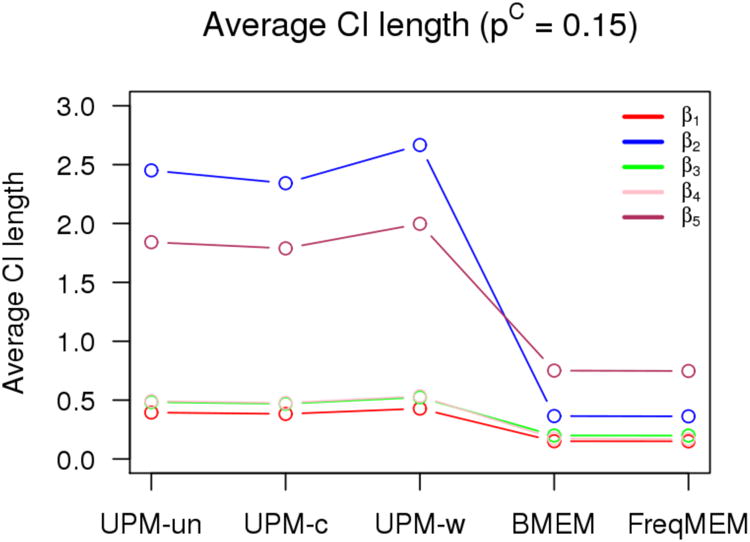
As shown in Figure 1 and Figure 2, the inclusion in the UPM of the pC term adds variability to posterior estimates of beta parameters when compared to the Bayesian mixed effects logistic and frequentist mixed effects logistic models. This is the tradeoff of estimating the community infection parameter. The median of posterior medians for 2000 simulations for the UPM is always closer to the true value than for the other two competing models, however the spread of the 2000 estimates is larger with the UPM.
Fig 2.
Estimates of 2000 simulations for pC = 0.10. Dotted lines are true parameter values.
Figure 3 shows for each model the percent of CIs for 2000 simulations that contain the true parameter. The reduction in coverage seen for the two alternative models—the Bayesian mixed effects logistic and frequentist mixed effects logistic—reflects both bias and variability in the estimates: the estimates from the UPM for all prior specifications have slightly less bias but greater variability in the spread of posterior median values than the standard Bayesian and frequentist models.
Fig 3.
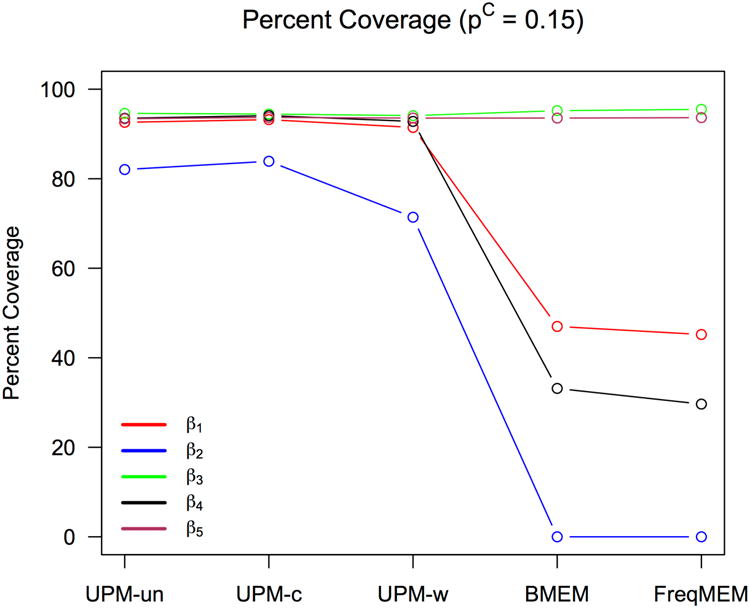
Estimates of 2000 simulations for pC = 0.15. Dotted lines are true parameter Values.
Figure 4 shows the mean squared error (MSE) of each parameter estimate against the known true parameter value. The UMP has slightly higher MSE than the competing models for some parameters, which may reflect the tendency for MSE to penalize more for outliers due to the squaring of values, and may not necessarily be representative of an actual increase in bias, although it demonstrates a higher variability.
Fig 4.
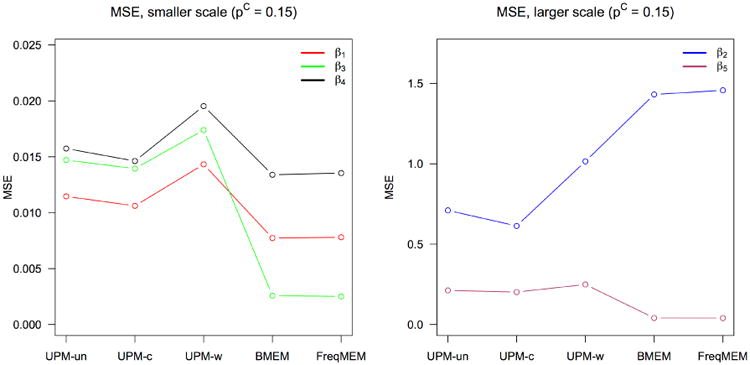
Estimates of 2000 simulations for pC = 0.40. Dotted lines are true parameter values.
Application To Brazilian Household Contact Study
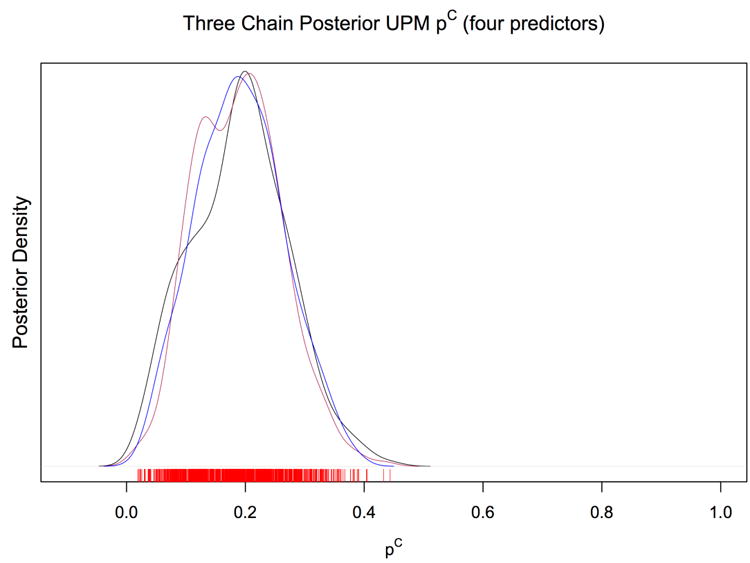
Figure 5 shows the posterior density of three MCMC chains for the probability of community infection. All chains converge well to a central value of 0.19. The UPM estimate of the probability of community-acquired infection is 0.19, with a 95% CI of (0.05, 0.34). We estimate that almost one-fifth of household contacts of an active TB case will acquire disease from a source other than their cohabiting TB case in this population.
Fig 5.
Estimates of 2000 simulations for pC = 0.60. Dotted lines are true parameter values.
Figure 6 shows the posterior median point estimates for the Bayesian mixed effects logistic model and the UPM and their 95% CIs along with the frequentist mixed effects logistic model point estimates and 95% CIs. The UPM estimates differ from the Bayesian and frequentist models in the impact of sleeping in the same room as an index case and the extent of index case disease. Estimates of the impact of age and sex are similar across the three models.
Fig 6.
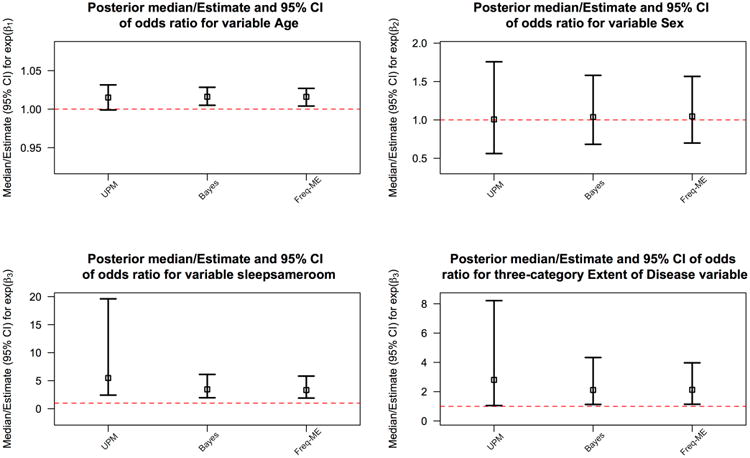
Average credible/confidence interval length of 2000 simulations for each model under consideration for pC = 0.0.
Table 1 shows that UPM estimates for the four variables used in each model. There is little difference in estimates of risk of infection for males versus females and for 5-year age difference, accounting for the other predictors in the model. The UPM estimates a higher risk than the competing models for the Extent of Disease variable and for the indicator of sharing a sleeping space with the index case, controlling for the other variables in the model. Only the latter two variables have a statistically significant OR estimate, with the 95% CI for the odds ratio not containing 1.
Table 1.
Median odds ratio estimates and point estimates for two Bayesian models and one frequentist mixed effects logistic model with 95% CIs in parentheses.
| Odds ratio (95% CI) | |||
|---|---|---|---|
| Unified Probability Model | Bayesian ME Logistic | Frequentist ME Logistic | |
| Age (by 5 year increments) | 1.08 (0.99, 1.18) | 1.10 (1.03, 1.15) | 1.10 (1.02, 1.14) |
| Sex (male is reference category) | 1.01 (0.56, 1.75) | 1.04 (0.68, 1.58) | 1.05 (0.70, 1.57) |
| Sleep in Same Room as Index Case | 5.48 (2.43, 19.61) | 3.46 (1.96, 6.12) | 3.34 (1.91, 5.82) |
| Extent of Disease | 2.81 (1.05, 8.22) | 2.11 (1.13, 4.33) | 2.13 (1.14, 3.97) |
Discussion
In this paper we present a new model to estimate community-acquired infection using data from index cases and their household contacts in Vitoria, Brazil. Through simulation we show that our model can accurately estimate the probability of community infection for a household contact in a home with an AFB smear-positive pulmonary TB case. This model is the first to estimate both the probability of community-acquired infection, and individual-level risk factors of infection while controlling for confounding and accounting for household clustering effects.
We found that models commonly used to measure the impact of risk factors on transmission of TB in households experience bias in parameter estimation, which, as shown in section 1 of the supplementary appendix, increases as the probability of community-acquired infection increases. The limitation of traditional generalized linear models in this setting is not surprising, as one can imagine that the “signal” of household risk is being interrupted by the “noise” of infection from a community source that occurs regardless of household risk factor levels. Other transmission models have tried to estimate either individual risk factors of infection, or to quantify the level of disease in the community by calculating secondary attack rates. However, we have shown that these aims can be unified and the relevant parameters can be accurately estimated from follow-up data collected from contacts of a TB index case.
When we applied our model to data from a household contact study in Brazil, we found that the probability of infection from a non-household source, given an infectious TB case in the home, is 0.19. We found similarity between the three models under consideration with respect to two risk factors for transmission: age and sex. However, consistent with our simulation results, we found that the two standard models used in household contact studies potentially underestimate the effect of two variables: sleeping proximity and index case disease extent.
A limitation of our approach is that the probability of community infection is assumed to be constant, and is not informed by factors that could also lead to within-household transmission. This assumption is obviously a simplification of reality, but it is a common assumption that has been used often in epidemic disease modeling. We intend to extend our model framework in the future to include predictors that can plausibly affect the risk of community-acquired infection, for instance age and sex. It may also be of interest to compare the risk of community-acquired TB infection across different populations and across population subgroups (for example age strata) of a given population to characterize the geographic and heterogeneous intra-community distribution of TB risk.
An important focus of TB research is on understanding factors associated with transmission. The household, workplace, school, and even public transit are all important locations where TB can spread, and so it is paramount that public health practitioners and policymakers have a comprehensive understanding of where transmission is occurring, and reliable estimates of risk factors that contribute to TB transmission. Our novel approach to understanding transmission provides estimates of the impact of community transmission pressure and of predictors of household TB transmission. The model is robust to the prior probability distribution of the probability of community infection, and even for overt prior misspecification the model accurately estimates both community infection risk, and individual- and household-level risk factors.
Understanding the probability of community-acquired infection is crucial to public health planning: if community probability of infection is high enough, prophylactic treatment of household contacts may not be strategically useful, and resources for interventions to interrupt transmission should go elsewhere. Conversely, if the probability of community-acquired infection is low, then prophylaxis for contact of a TB case may be entirely effective at combatting transmission. In particular, knowing the community probability of infection parameter for a population will allow public health planners to more effectively allocate resources for contact investigations focusing on community spaces such as workplace, classroom, and social venues [26].
This modeling framework will help public health programs make better decisions about where to target interventions, and it will help epidemiologists better understand the dynamics of a disease whose transmission is varied, complex, and largely hidden from standard investigative methods.
Supplementary Material
Acknowledgments
The authors wish to thank Professor Janice Weinberg at Boston University School of Public Health Department of Biostatistics and Dr. Karen Jacobson at the Section of Infectious Diseases, Boston Medical Center for their insightful critiques and suggestions.
Funding: Funding for this research was provided by National Institutes of Health (NIH) National Institute of Allergy and Infectious Diseases (NIAID) awards U01 AI065663-01 and US NIH K01AI102944. The content of the article is solely the responsibility of the authors and does not necessarily represent the views of the National Institute of Allergy and Infectious Disease or the Office of the Director, NIH.
Footnotes
Declaration of Conflicting Interest: The authors declare that there is no conflict of interest.
References
- 1.WHO. Global tuberculosis report. [Accessed: 2015-12-07];2015 http://www.who.int/tb/publications/global_report/en/
- 2.WHO. Tuberculosis mortality nearly halved since. [Accessed: 2015-12-07];1990 http://www.who.int/mediacentre/news/releases/2015/tuberculosis-mortality/en/
- 3.Horsburgh CR, Jr, Rubin EJ. Latent tuberculosis infection in the United States. New England Journal of Medicine. 2011;364(15):1441–8. doi: 10.1056/NEJMcp1005750. [DOI] [PubMed] [Google Scholar]
- 4.Chapman JS, Dyerly MD, Powell DR. Social and Other Factors in Intrafamilial Transmission of Tuberculosis. American Review of Respiratory Disease. 1964;90(1):48–60. doi: 10.1164/arrd.1964.90.1.48. [DOI] [PubMed] [Google Scholar]
- 5.Bennett DE, Onorato IM, Ellis BA, Crawford JT, Schable B, Byers R, Kammerer JS, Braden CR. DNA fingerprinting of Mycobacterium tuberculosis isolates from epidemiologically linked case pairs. Emerging infectious diseases. 2008;8(11):1124. doi: 10.3201/eid0811.020420. [DOI] [PMC free article] [PubMed] [Google Scholar]
- 6.Verver S, Warren RM, Munch Z, Richardson M, van der Spuy GD, Borgdorff MW, Behr MA, Beyers N, van Helden PD. Proportion of tuberculosis transmission that takes place in households in a high-incidence area. The Lancet. 2004;363(9404):212–4. doi: 10.1016/S0140-6736(03)15332-9. [DOI] [PubMed] [Google Scholar]
- 7.Cohen T, Murray M, Abubakar I, et al. Multiple Introductions of Multidrug-Resistant Tuberculosis into Households, Lima, Peru. Emerging Infectious Diseases. 2011;17(6):969–975. doi: 10.3201/eid1706.101471. [DOI] [PMC free article] [PubMed] [Google Scholar]
- 8.Brooks-Pollock E, Becerra MC, Goldstein E, Cohen T, Murray MB. Epidemiologic inference from the distribution of tuberculosis cases in households in Lima, Peru. Journal of Infectious Diseases. 2011;203(11):1582–9. doi: 10.1093/infdis/jir162. [DOI] [PMC free article] [PubMed] [Google Scholar]
- 9.Glynn JR, Guerra-Assunção JA, Houben RM, Sichali L, Mzembe T, Mwaungulu LK, Mwaungulu JN, McNerney R, Khan P, Parkhill J, Crampin AC. Whole Genome sequencing shows a low proportion of tuberculosis disease is attributable to known close contacts in rural Malawi. PloS one. 2015;10(7):e0132840. doi: 10.1371/journal.pone.0132840. [DOI] [PMC free article] [PubMed] [Google Scholar]
- 10.Guwatudde D, Nakakeeto M, Jones-Lopez EC, Maganda A, Chiunda A, Mugerwa RD, Ellner JJ, Bukenya G, Whalen CC. Tuberculosis in household contacts of infectious cases in Kampala, Uganda. American journal of epidemiology. 2003;158(9):887–98. doi: 10.1093/aje/kwg227. [DOI] [PMC free article] [PubMed] [Google Scholar]
- 11.Kilicaslan Z, Kiyan E, Kucuk C, Kumbetli S, Sarimurat N, Ozturk F, Yapici D, Al S, Erboran T, Iliksu N. Risk of active tuberculosis in adult household contacts of smear-positive pulmonary tuberculosis cases. The International Journal of Tuberculosis and Lung Disease. 2009;13(1):93–8. [PubMed] [Google Scholar]
- 12.Whalen CC. Failure of directly observed treatment for tuberculosis in Africa: a call for new approaches. Clinical Infectious Diseases. 2006;42(7):1048–50. doi: 10.1086/501022. [DOI] [PubMed] [Google Scholar]
- 13.Abbey H H. An examination of the Reed-Frost theory of epidemics. Human biology. 1952;24(3):201. [PubMed] [Google Scholar]
- 14.Greenwood M. On the statistical measure of infectiousness. The Journal of hygiene. 1931;31(3):336. doi: 10.1017/s002217240001086x. [DOI] [PMC free article] [PubMed] [Google Scholar]
- 15.En'ko PD. The epidemic course of some infectious diseases. Vrac. 1889;10:1008–10. [Google Scholar]
- 16.Longini IM, Jr, Koopman JS. Household and community transmission parameters from final distributions of infections in households. Biometrics. 1982:115–26. [PubMed] [Google Scholar]
- 17.Addy CL, Longini IM, Jr, Haber M. A generalized stochastic model for the analysis of infectious disease final size data. Biometrics. 1991:961–74. [PubMed] [Google Scholar]
- 18.Cauchemez S S, Carrat F, Viboud C, Valleron AJ, Boelle PY. A Bayesian MCMC approach to study transmission of influenza: application to household longitudinal data. Statistics in medicine. 2004;23(22):3469–87. doi: 10.1002/sim.1912. [DOI] [PubMed] [Google Scholar]
- 19.Cauchemez S S, Donnelly CA, Reed C, Ghani AC, Fraser C, Kent CK, Finelli L, Ferguson NM. Household transmission of 2009 pandemic influenza A (H1N1) virus in the United States. New England Journal of Medicine. 2009;361(27):2619–27. doi: 10.1056/NEJMoa0905498. [DOI] [PMC free article] [PubMed] [Google Scholar]
- 20.R Core Team. R Foundation for Statistical Computing; Vienna, Austria: 2015. R: A language and environment for statistical computing. URL https://www.R-project.org/ [Google Scholar]
- 21.Bates Douglas, Maechler Martin, Bolker Ben, Walker Steve. Fitting Linear Mixed-Effects Models Using lme4. Journal of Statistical Software. 2015;67(1):1–48. doi: 10.18637/jss.v067.i01. [DOI] [Google Scholar]
- 22.McIntosh Avery. upmfit: Unified Probability Model Fitting. R package version 0.1.0. 2017 https://CRAN.R-project.org/package=upmfit.
- 23.Plummer M. JAGS: A program for analysis of Bayesian graphical models using Gibbs sampling. Proceedings of the 3rd international workshop on distributed statistical computing. 2003;124:125. [Google Scholar]
- 24.Jones-López EC, Kim S, Fregona G, Marques-Rodrigues P, Hadad DJ, Molina LP, Vinhas S, Reilly N, Moine S, Chakravorty S, Gaeddert M. Importance of cough and M. tuberculosis strain type as risks for increased transmission within households. PloS one. 2014;9(7) doi: 10.1371/journal.pone.0100984. [DOI] [PMC free article] [PubMed] [Google Scholar]
- 25.Ribeiro-Rodrigues R, Kim S, da Silva FD, Uzelac A, Collins L, Palaci M, Alland D, Dietze R, Ellner JJ, Jones-López E, Salgame P. Discordance of tuberculin skin test and interferon gamma release assay in recently exposed household contacts of pulmonary TB cases in Brazil. PloS one. 2014;9(5) doi: 10.1371/journal.pone.0096564. [DOI] [PMC free article] [PubMed] [Google Scholar]
- 26.Yuen CM, Amanullah F, Dharmadhikari A, Nardell EA, Seddon JA, Vasilyeva I, Zhao Y, Keshavjee S, Becerra MC. Turning off the tap: stopping tuberculosis transmission through active case-finding and prompt effective treatment. The Lancet. 2015;386(10010):2334–43. doi: 10.1016/S0140-6736(15)00322-0. [DOI] [PMC free article] [PubMed] [Google Scholar]
Associated Data
This section collects any data citations, data availability statements, or supplementary materials included in this article.