

Abstract
Estrus expression by gilts and sows is hereditable and important for heat detection. To better understand the molecular biological mechanisms of estrus expression in gilts, the mRNA expression profiles of follicular tissue from Large White gilts in diestrus (LD, n = 3) and estrus (LE, n = 3), and Chinese indigenous Mi gilts in diestrus (MD, n = 2) and estrus (ME, n = 3) were investigated using RNA sequencing. We detected 122,804-335,295 SNPs, 6,140-14,947 InDel and 12 types of AS events (39.57% TSS, 34.90% TTS) in 11 samples. A total of 2,838 differentially expressed genes (DEGs) were found in LD vs MD, LE vs ME, LE vs LD, or ME vs MD comparisons. Two DEGs (ACP5 and PIGS) were observed in all comparisons. Two new genes (ENSSSCG00000028235 and ENSSSCG00000021903) were exclusively expressed in Mi and Large White gilts, respectively. Bioinformatics analyses indicate that these DEGs are involved in single-organism process, catalytic activity, cell adhesion and enriched in ECM-receptor interaction, olfactory transduction, ovarian steroidogenesis, steroid biosynthesis and CAMs signaling pathways. These results of RNA-Seq have provided important information for screening the key functional genes or molecular markers of estrus expression in gilts.
Introduction
Clear visible estrus behaviors, such as standing reflex, reddening and swelling of the vulva, mucus discharge from the vulva, etc., contribute to the reproductive performance of sows1. However, the proportion of gilts and sows that do not express estrus behaviors is increasing in recent years2–4. Estrus expression of gilts or sows is associated with clearly visible physiological and behavioral changes5, which reach the maximum intensity before the onset of estrus6. Reproductive behavior culminates in the standing reflex, which indicates sexual receptivity6, 7. Previous studies showed that Chinese indigenous pigs which originated in Taihu Lake Basin, such as Meishan, Erhualian, and Mi pigs, had superior reproductive performance and estrus expression traits than European pigs8–11. The difference on estrus expression between pig breeds indicates that the clear visible expression of estrus is heritable1, and could be improved by selection12, 13. A positive correlation was observed between the serum estrogen concentration of gilts and the intensity of estrus behaviors14–16. The synthesis of ovarian estrogen is under the action of luteinizing hormone (LH) and follicle-stimulating hormone (FSH) in the theca cell and granulosa cells17. During the growth and development of follicles, LH stimulates the theca interna to secrete testosterone, and then under the stimulation of FSH, granulosa cells convert testosterone to estradiol, namely “double cell dual-sex hormone effect mode”17.
The plasma concentration of estrogen is affected by the dynamic equilibrium of estrogen synthesis and metabolism, which requires the activity of enzymes, such as cytochrome P450 19A1 (CYP19A1), estradiol 17-beta-dehydrogenase 12 (HSD17B12), sulfotransferase family 1 C member 3 (SULT1C3), etc18, 19. Previous studies found that differentially expressed genes (DEGs)), were related to follicular development and hormone metabolism20–22.
Chinese indigenous Mi pigs, as well as Meishan and Erhualian pigs, originated in the lake Taihu basin in Jiangsu province (east China)23. These Chinese pig breeds have similar biological characteristics24, such as greater litter size and clearer expression of estrus behaviors. Gilts of these Chinese pig breeds reach puberty at an earlier age25, express behavioral estrus longer, and have slightly shorter estrus cycles8 than those of Landrace and Large White. The duration of high estradiol concentrations was greater in Meishan than in Large White hybrid gilts during the follicular phase, the periovulatory period, and the early luteal phase26.
In the present study, we investigated the mRNA expression profiles of follicular tissue from Large White gilts at diestrus (LD) and estrus (LE), and Mi gilts at diestrus (MD) and estrus (ME) using RNA-seq. The goals of this study were to screen genes and new transcripts that are differentially expressed between two breeds or/and two stages of estrus cycle, and to find which biological processes and pathways have the greatest number of DEGs which could contribute to identifying molecular genetic markers associated with the expression of estrus in pigs.
Results
Sequencing data summary
A sample from a Mi gilt at diestrus was discarded because of degradation. We generated 11 RNA-seq libraries of follicle tissue from six Large White gilts and five Mi gilts. Utilizing paired-end Illumina sequencing technology, about 630 million raw reads were obtained, and 610 million high-quality reads were obtained after removing low quality reads. The number of clean reads was more than 54 million in each group (Table 1). The ratio of Q30 (with a base quality > 30 and error rate < 0.001) bases comprised more than 87% clean data. In four groups, 77.33% to 80.55% clean reads were mapped onto the Sus scrofa reference genome (sscrofa10.2), and 4.33% to 5.00% clean reads were multi map reads (Table 1). The genic distribution of clean reads was comprised of 66.95% exonic, 8.02% intron, and 25.03% intergenic regions (Supplementary Table S3). To ensure the reliability of the analysis results, the unique mapped reads were used for subsequent statistical analysis. Reads per kilobase millon mapped reads (RPKM), a normalized transcription level, can eliminate the influence of gene length and sequence difference on gene expression27. Therefore, here RPKM was used to compare the gene expression between different samples.
Table 1.
Quality analyses of the digital gene expression profiling library of follicles tissue in Large white and Mi gilts at estrus and diestrus1.
| Items | LD | LE | MD | ME |
|---|---|---|---|---|
| Raw Reads | 57,434,498 | 58,294,608 | 56,257,632 | 57,417,062 |
| Clean Reads (%2) | 54,936,961 | 56,007,603 | 54,394,534 | 56,015,413 |
| (95.63%) | (96.09%) | (96.70%) | (97.56%) | |
| Adapter Polluted Reads (%) | 1,271,411 | 1,098,098 | 905,188 | 736,364 |
| (2.24%) | (1.87%) | (1.61%) | (1.29%) | |
| Ns Reads (%) | 20,345 | 22,398 | 40,996 | 67,644 |
| (0.03%) | (0.04%) | (0.08%) | (0.12%) | |
| Low-quality Reads (%) | 1,205,779 | 1,166,507 | 916,912 | 597,639 |
| (2.10%) | (2.00%) | (1.62%) | (1.04%) | |
| Clean Q30 Bases Rate (%) | 88.25 | 87.87 | 91.65 | 95.68 |
| Mapped Reads (%) | 42,460,339 | 44,601,507 | 42,932,065 | 45,122,743 |
| (77.33%) | (79.63%) | (78.93%) | (80.55%) | |
| Multi Map Reads (%3) | 2,407,266 | 2,658,098 | 2,547,627 | 2,531,558 |
| (4.33%) | (5.00%) | (5.00%) | (4.67%) |
1LD, Large white gilts at diestrus; LE, Large white gilts at estrus; MD, Mi gilts at diestrus; ME, Mi gilts at estrus.
2The number of clean reading frames of total raw reading frames.
3The number of all mapped reads out of total clean reads. Q30 represents an error rate of less than 0.001.
SNP and InDel analysis
We detected approximately 122,804 to 335,295 SNPs and 6,140 to 14,947 InDel in the 11 samples (Table 2). The most frequent SNPs were A>G, C>T, G>A, and T>C (Supplementary Fig. S1). The most frequent length of InDel was one nucleotide (Supplementary Fig. S2).
Table 2.
Statistics of SNP and InDel of the genes expressed in follicles tissue of Large white and Mi gilts at estrus and diestrus.
| Sample1 | SNP | InDel | Total | |
|---|---|---|---|---|
| LD | NO_1 | 201,224 | 11,884 | 213,108 |
| NO_2 | 146,956 | 8,966 | 155,922 | |
| NO_3 | 120,548 | 7,112 | 127,660 | |
| LE | NO_4 | 140,845 | 8,494 | 149,339 |
| NO_5 | 255,190 | 14,947 | 270,137 | |
| NO_6 | 146,954 | 8,737 | 155,691 | |
| MD | NO_7 | 335,295 | 18,467 | 353,762 |
| NO_8 | 122,804 | 6,140 | 128,944 | |
| ME | NO_9 | 202,764 | 11,187 | 213,951 |
| NO_10 | 206,295 | 11,126 | 217,421 | |
| NO_11 | 266,848 | 14,711 | 281,559 | |
1LD, Large white gilts at diestrus; LE, Large white gilts at estrus; MD, Mi gilts at diestrus; ME, Mi gilts at estrus.
Alternative splicing analysis
We detected 12 types of alternative splicing (AS) events: Skipped exon (SKIP), Multi-exon SKIP (MSKIP), Intron retention (IR), Multi-IR (MIR), Alternative exon ends (5’or/and 3’) (AE), Transcription Start Site (TSS), Transcription Terminal Site (TTS), Approximate SKIP (XSKIP), Approximate MSKIP (XMSKIP), Approximate IR (XIR), Approximate MIR (XMIR), and Approximate AE (XAE). The top two AS events were TSS and TTS AS events, which accounted for more than 70% of AS events in each library (Fig. 1).
Figure 1.
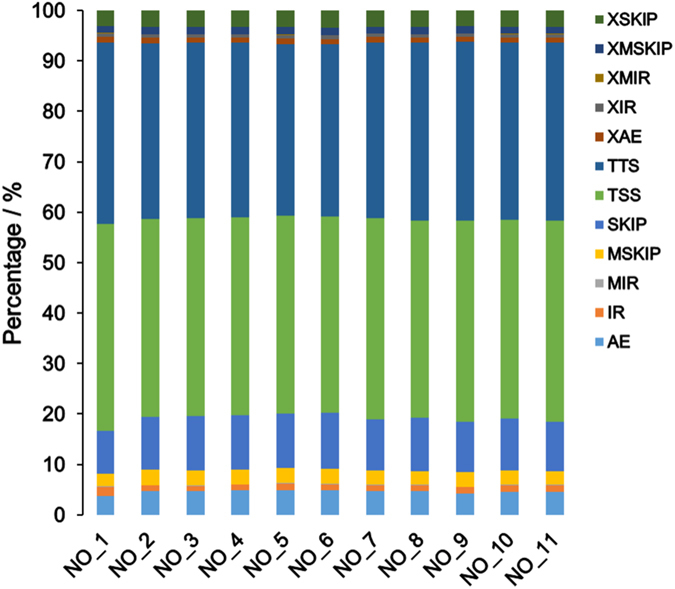
Statistics of alternative splicing events of the mRNA expressed in follicles tissue of Large white and Mi gilts at estrus and diestrus. LD group: NO_1, NO_2, NO_3; LE group: NO_4, NO_5, NO_6; MD group: NO_7, NO_8; ME group: NO_9, NO_10, NO_11. SKIP: Skipped exon; MSKIP: Multi-exon SKIP; IR: Intron retention; MIR: Multi-IR; AE: Alternative exon ends (5’or/and 3’) ; TSS: Transcription Start Site; TTS: Transcription Terminal Site; XSKIP: Approximate SKIP; XMSKIP: Approximate MSKIP; XIR: Approximate IR; XMIR: Approximate MIR; XAE: Approximate AE.
Identification and analysis of DEGs
A total of 20,910 genes were expressed in the 11 samples (Supplementary Table S4). The number of expressed genes was not significantly different between libraries. As shown in Table 3, reference genes expressed at RPKM < 10 and RPKM > 500 were 68.03% to 72.81% and 0.75% to 0.78%, respectively. In addition, the gene expression levels between groups were not significantly different (P > 0.05, Fig. 2A). A DEG heatmap showed that the DEGs from LD vs MD comparison group gather together, while the DEGs from LE vs ME comparison group gather in another class (Fig. 2B). Subsequently, 2,838 DEGs were identified (Supplementary Table S5) using DESeq (v1.14.0). The distribution of DEGs is revealed in a Venn diagram (Fig. 2C), where tartrate-resistant acid phosphatase type 5 (ACP5) and GPI transamidase component PIG-S-like (PIGS) were the common DEGs among the four comparison groups. The number of DEGs was much greater (One-Way ANOVA, P = 0.018) at estrus than diestrus. The number of DEGs was not different (One-Way ANOVA, P = 0.543) between Large White and Mi gilts at estrus or diestrus (Fig. 2D). Twenty-six common DEGs were found in the LD vs MD and LE vs ME comparison groups (Table 4). To screen potential candidate genes associated with estrus expression, the fold change was further analyzed and the P-values of up-regulated and down-regulated DEGs estimated (Supplementary Fig. S3). A DEG whose reads count was zero in one of the four groups was defined as a specific expressed gene (Supplementary Table S6). A new gene (ENSSSCG00000028235) was exclusively expressed in Mi gilts, while another new gene (ENSSSCG00000021903) was exclusively expressed in Large White gilts. In addition, the new gene ENSSSCG00000003073 was only expressed at estrus.
Table 3.
Number of genes within different reads per kilobase transcriptome per million mapped reads (RPKM) intervals.
| RPKM | Number of genes1 (%) | |||
|---|---|---|---|---|
| LE | MD | ME | LD | |
| 0–10 | 15,225(72.81%) | 14,225(68.03%) | 14,536(69.52%) | 14,762(70.60%) |
| 10–50 | 4,213(20.15%) | 5,050(24.15%) | 4,718(22.56%) | 4,532(21.67%) |
| 50–100 | 749(3.58%) | 877(4.19%) | 850(4.07%) | 825(3.95%) |
| 100–500 | 566(2.71%) | 598(2.86%) | 643(3.08%) | 628(3.00%) |
| >500 | 157(0.75%) | 160(0.77%) | 163(0.78%) | 163(0.78%) |
1LD, Large white gilts at diestrus; LE, Large white gilts at estrus; MD, Mi gilts at diestrus; ME, Mi gilts at estrus.
Figure 2.
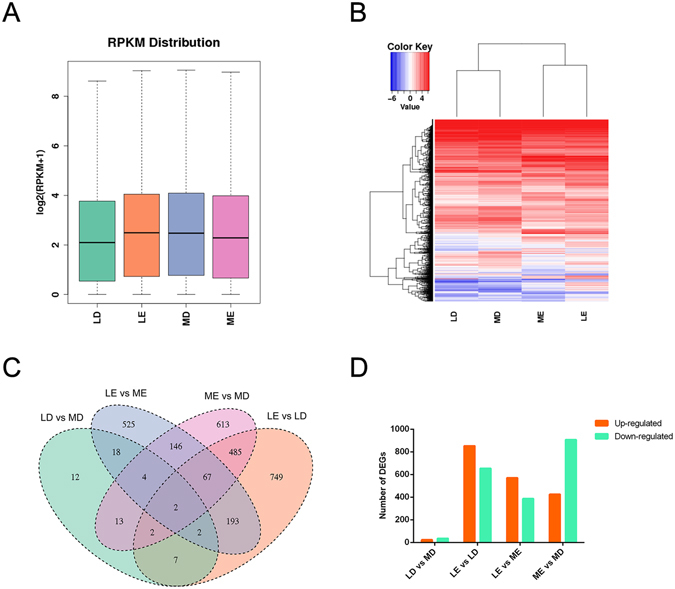
Identification and analysis of DEGs of the genes expressed in follicles tissue of Large white and Mi gilts at estrus and diestrus. LD, Large white gilts at diestrus; LE, Large white gilts at estrus; MD, Mi gilts at diestrus; ME, Mi gilts at estrus. (A) Comparison of expression levels of genes detected in the LD, MD, LE, and ME groups. (B) Heatmap analysis of DEGs in the LD, MD, LE, and ME groups. (C) Venn diagram of the 2838 differentially expressed genes detected among LD vs MD, LE vs ME, LE vs LD, ME vs MD comparison groups. Different color represents different combination, the number in the overlap region represents the overlapped DEGs number. (D) Number of enriched DEGs. The orange and cyan pillars represents up-regulated and down-regulated gene number, respectively.
Table 4.
List of 26 overlaped DEGs in LD vs MD and LE vs ME comparison groups1.
| Gene ID | Log2Fold (LD vs MD) | Log2Fold (LE vs ME) | Up/Down |
|---|---|---|---|
| ENSSSCG00000000047 | 4.196826985 | 3.799864112 | up |
| ENSSSCG00000003514 | −1.96057002 | 1.11087342 | up |
| ENSSSCG00000003746 | 7.164317644 | 7.951655137 | up |
| ENSSSCG00000007391 | 5.434905379 | 2.710809254 | up |
| ENSSSCG00000012517 | 4.885388402 | 4.1791834 | up |
| ENSSSCG00000021903 | — | — | up |
| ENSSSCG00000022485 | 7.3977206 | 2.517063372 | up |
| ENSSSCG00000022737 | — | 6.014084639 | up |
| ENSSSCG00000026850 | 3.835736057 | 3.802367985 | up |
| ENSSSCG00000026923 | — | — | up |
| ENSSSCG00000027402 | −3.344406106 | 2.258632588 | up |
| ENSSSCG00000029574 | 6.18186221 | 3.649117191 | up |
| ENSSSCG00000030790 | 9.02308197 | 6.693415446 | up |
| ENSSSCG00000030888 | 3.482952208 | 5.527148227 | up |
| ENSSSCG00000000382 | −3.920837477 | −3.820658642 | down |
| ENSSSCG00000003278 | −3.418551101 | −3.056977033 | down |
| ENSSSCG00000004181 | −3.437416724 | −2.163910128 | down |
| ENSSSCG00000007436 | −3.592691493 | −2.724788739 | down |
| ENSSSCG00000012759 | −4.676540398 | −4.510439496 | down |
| ENSSSCG00000013612 | −2.291163851 | −2.212168153 | down |
| ENSSSCG00000021283 | −4.112862996 | −2.722427296 | down |
| ENSSSCG00000022129 | −2.496457265 | −1.357534888 | down |
| ENSSSCG00000023383 | — | −1.352909641 | down |
| ENSSSCG00000024011 | — | −8.719586523 | down |
| ENSSSCG00000028235 | — | — | down |
| ENSSSCG00000029040 | — | −7.975214263 | down |
1LD, Large white gilts at diestrus; LE, Large white gilts at estrus; MD, Mi gilts at diestrus; ME, Mi gilts at estrus. “-” represent one or two groups’ reads count were 0.
GO and KEGG pathway enrichment analysis
The enrichment of DEGs in the GO terms was tested to gain the insights into the biological implications. These DEGs fell into three major GO categories: biological process, cellular component, and molecular function. In the GO category biological process, the most abundant GO terms were single-organism process, cellular process, metabolic process, and biological regulation. In the LD vs MD, LE vs ME, LE vs LD, and ME vs MD comparison groups, the number of biological processes with significant different (q < 0.05) DEGs were 10, 108, 178, and 495, respectively (Fig. 3; Supplementary Table S7). In the GO category cellular component, the most abundant GO terms were cell part and organelle. In the GO category molecular function, the most abundant GO terms were binding and catalytic activity.
Figure 3.
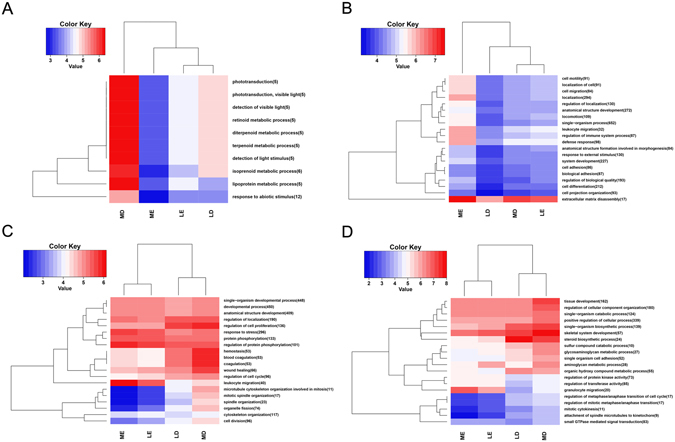
GO annotation of DEGs of the genes expressed in follicles tissue of Large white and Mi gilts at estrus and diestrus. LD, Large white gilts at diestrus; LE, Large white gilts at estrus; MD, Mi gilts at diestrus; ME, Mi gilts at estrus. DEGs number of the most enriched 20 GO terms derived from biological processes from LD vs MD (A), LE vs ME (B), LE vs LD (C), ME vs MD (D) comparison groups, respectively. Red shows higher expression and blue shows lower expression. The figures in parentheses refer to the number of DGEs in this term.
To identify the potential biological pathways involved in estrous behavior, a KEGG analysis was performed. The DEGs were enriched in 315 pathways in the LD vs MD, LE vs ME, LE vs LD, and ME vs MD comparison groups. There were 3, 10, 24, and 23 pathways with significant differences (q < 0.05) of DEGs in the LD vs MD, LE vs ME, LE vs LD, and ME vs MD comparison groups, respectively (Fig. 4; Supplementary Table S8). The representative KEGG pathways, such as ECM−receptor interaction, olfactory transduction, ovarian steroidogenesis, cell cycle, steroid biosynthesis, cell cycle-yeast, phagosome, and ribosome, were enriched with these DEGs. Most DEGs were upregulated in the MD and LE groups. In the ECM−receptor interaction pathway (Table 5), five novel genes were upregulated in the MD group, but none in the LD group. The CD36 molecule (CD36) and a novel gene were upregulated in the ME group. Twelve genes, such as collagen type XI alpha 1 chain (COL11A1), thrombospondin 1 (THBS1), etc., were upregulated in the LE group. Forty genes were upregulated in the MD group, such as laminin subunit beta 2 (LAMB2), collagen type VI alpha 5 chain (COL6A5), hyaluronan mediated motility receptor (HMMR), etc. Six genes, syndecan 1 (SDC1), secreted phosphoprotein 1 (SPP1), integrin subunit beta 3 (ITGB3), etc., were upregulated in the ME group. In the steroid biosynthesis pathway (Table 5), nine genes, such as hydroxysteroid (17-beta) dehydrogenase 7 (HSD17B7), 24-dehydrocholesterol reductase (DHCR24), methylsterol monooxygenase 1 (MSMO1), etc., were upregulated in the LD group. However, no gene was upregulated in the LE group. In addition, six genes, such as DHCR24, MSMO1, transmembrane 7 superfamily member 2 (TM7SF2), etc., were upregulated in the MD group. Lipase A, lysosomal acid type (LIPA) was upregulated in the ME group. Fifteen of 23 genes involved in the ovarian steroidogenesis pathway (Table 5), such as low-density lipoprotein receptor (LDLR), CYP19A1, HSD3B1, etc., were upregulated in the LD group. Eight genes, such as arachidonate 5-lipoxygenase (ALOX5), phospholipase A2 group IVA (PLA2G4A), adenylate cyclase 3 (ADCY3), etc., were upregulated in the LE group. In constrast, 14 genes (LDLR, HSD3B1, CYP17A1, etc.) were upregulated in the MD group, while one novel gene was upregulated in the ME group.
Figure 4.
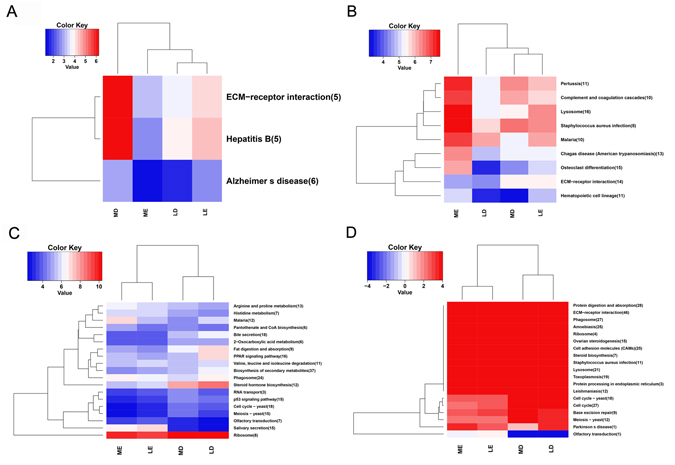
KEGG annotation for DEGs functions of the genes expressed in follicles tissue of Large white and Mi gilts at estrus and diestrus. LD, Large white gilts at diestrus; LE, Large white gilts at estrus; MD, Mi gilts at diestrus; ME, Mi gilts at estrus. DEGs number of the most enriched 20 pathways from LD vs MD (A), LE vs ME (B), LE vs LD (C), ME vs MD (D) comparison groups, respectively. Red shows higher expression and blue shows lower expression. The figures in parentheses refer to the number of DGEs in this pathway.
Table 5.
Several representative heat-related pathways in LD vs MD, LE vs ME, LE vs LD, and ME vs MD comparison groups for DEGs.
| Group | Pathway | Up_Gene | Down_Gene |
|---|---|---|---|
| LD vs MD | ECM-receptor interaction | — | 5 novel genes |
| LE vs ME | ECM-receptor interaction | COL11A1, THBS1, ITGA11, and 9 novel genes | CD36 and one novel gene |
| LE vs LD | Ovarian steroidogenesis | PTGS2, ALOX5, PLA2G4A, ADCY3, CYP2J34, ADCY7, and 2 novel genes | LDLR, HSD17B7, CYP19A1, CYP11A1, PRKX, HSD3B1, CYP17A1, SCARB1, HSD17B1, and 6 novel genes |
| Steroid biosynthesis | — | CYP51A1, HSD17B7, DHCR24, MSMO1, SC5D, TM7SF2, EBP, and 2 novel genes | |
| Steroid hormone biosynthesis | UGT2A3, CYP7A1, and one novel gene | HSD17B7, CYP19A1, CYP11A1, HSD3B1, CYP17A1, HSD17B1, CYP21A2, and 2 novel genes | |
| ME vs MD | ECM-receptor interaction | CD36, SDC1, CD44, SPP1, ITGB3, and one novel gene | LAMB2, COL6A5, COL5A1, COL4A, LAMC3, COL6A2, ITGA6, COL11A1, COL6A3, HMMR, COL2A1, LAMC1, DAG1, and 27 novel genes |
| Ovarian steroidogenesis | PTGS2 | LDLR, CYP19A1, HSD3B1, CYP17A1, SCARB1, HSD17B1, and 8 novel genes | |
| Steroid biosynthesis | LIPA | DHCR24, MSMO1, TM7SF2, EBP, and 2 novel genes |
LD, Large white gilts at diestrus; LE, Large white gilts at estrus; MD, Mi gilts at diestrus; ME, Mi gilts at estrus.
qRT-PCR confirmation
To validate the results of RNA-seq, SULT1C3, apolipoprotein E (APOE), complement component C7 precursor (C7), CYP17A1, complement component 4 binding protein, alpha (C4BPA), gap junction protein alpha 1 (GJA1), and ACP5 were selected for quantitative PCR (qPCR). Based on qRT-PCR, these 7 DEGs were differently expressed in at least one of four comparison groups. Some DEGs have been reported to be involved in follicular development processes. For example, ACP5 was differentially expressed in the four groups; APOE, C4BPA, C7, and ACP5 were highly expressed at estrus; SULT1C3, CYP17A1, and GJA1 were highly expressed at diestrus. In addition, it has been reported that SULT1C3 28 and CYP17A1 29 are related to steroid metabolism pathway, APOE was related to lipid metabolism30, and C7 31 and C4BPA 32 were related to the immune system. The expression patterns of these 7 DEGs were in agreement with our RNA-seq findings. As shown in Table 6, the correlation coefficients between qRT-PCR and RNA-seq results are greater than 0.9 6 of 7 DEGs; the P value are less than 0.05 in 4 DEGs and less than 0.10 in 6 of 7 DEGs. For C7 gene, the correlation coefficient between results of qRT-PCR and RNA-seq is 0.86 (P = 0.14). The qRT-PCR results were consistent with the sequencing data (shown in Supplementary Fig. S4). Although the relative expression of C7 in LE vs LD and GJA1 LE vs ME comparison groups differed using two approaches, the difference was not significant, which was probably caused by biological differences between samples as well as the sensitivity and capability of the different methods.
Table 6.
Validation of RNA-seq results using quantitative RT-PCR.
| Gene ID | Gene name | Item | LD | LE | MD | ME | R | P value |
|---|---|---|---|---|---|---|---|---|
| ENSSSCG00000003088 | APOE | RNA-seq | 318.74 | 1868.87 | 601.92 | 9636.59 | 0.92 | 0.08 |
| QRT-PCR | 0.06 | 0.64 | 0.11 | 1.1 | ||||
| ENSSSCG00000016859 | C7 | RNA-seq | 189.43 | 226.24 | 73.21 | 127.66 | 0.86 | 0.14 |
| QRT-PCR | 1.42 | 1.27 | 0.5 | 1.14 | ||||
| ENSSSCG00000010591 | CYP17A1 | RNA-seq | 425 | 9.17 | 591.97 | 12.94 | 0.95 | 0.05 |
| QRT-PCR | 19.08 | 0.94 | 44.42 | 2.75 | ||||
| ENSSSCG00000004241 | GJA1 | RNA-seq | 356.47 | 207.98 | 425.79 | 124.65 | 0.93 | 0.07 |
| QRT-PCR | 1.94 | 0.84 | 2.53 | 1.05 | ||||
| ENSSSCG00000015663 | C4BPA | RNA-seq | 27.61 | 35.16 | 96.77 | 286.72 | 0.98 | 0.02 |
| QRT-PCR | 0.21 | 0.24 | 0.26 | 1.16 | ||||
| ENSSSCG00000028691 | SULT1C3 | RNA-seq | 234.52 | 11.91 | 9.16 | 2.85 | 0.98 | 0.02 |
| QRT-PCR | 15.15 | 4.77 | 2.06 | 1.44 | ||||
| ENSSSCG00000013612 | ACP5 | RNA-seq | 6.84 | 61.37 | 39.48 | 261.79 | 0.99 | 0.01 |
| QRT-PCR | 0.06 | 0.4 | 0.15 | 1.2 |
LD, Large white gilts at diestrus; LE, Large white gilts at estrus; MD, Mi gilts at diestrus; ME, Mi gilts at estrus. The RNA-seq data for the DEGs represent the RPKM values in the four groups; Relative expression levels of the selected target genes were calculated with the 2(-Delta Delta C[T]) method The QRT-PCR data represent the relative expression levels of DEGs, the relative expression levels of the four groups were relative to the ME group.
Discussion
In recent years, high-throughput sequencing have been performed using animal reproductive tissues, such as endometrium20, ovaries21, placenta33, follicles34 and granulosa cells35, to identify the genes and genetic loci that affect litter size. Compared to litter size, the studies on the molecular genetic mechanism of estrus expression have seldom been reported. In commercial pig production, estrus characteristics influence sow fecundity36. Previous studies have investigated the expression profiles in ovaries of sheep at estrous and anestrous37, in porcine endometrial tissue on 938, 1239, 1422, and 1538 d of pregnancy, and in porcine endometrial tissue on 1239 d after onset of estrus. In the present study, we investigated the expression profiles in follicle tissue of Large White and Mi gilts at diestrus and estrus using RNA-seq, to mine the DEGs between two breeds and two stages of estrus cycle.
In our present study, 610 million clean reads were generated. In each group, the clean reads were more than 54 million, which is similar to the previous studies on RNA-seq in placenta33 and longissimus muscle40. A total of 122,804–335,295 SNPs and 6,140-14,947 InDel were detected in the 11 samples. The number of SNPs and InDel were much greater for Mi gilts than Large White gilts at both estrus and diestrus stages, which indicates the difference on estrus expression between two breeds was due to the difference of gene expression. In addition, the most SNPs (A>G, C>T, G>A, and T>C) and the most length of InDel (one nucleotide) could play important roles in the regulation of gene expression41. AS generates multiple transcripts from the same gene, and widely exists in eukaryotes42. AS is an important way to regulate gene expression and protein diversity43. The most common AS events (TSS and TTS) can produce different transcripts or different proteins which affect the biological process43.
A total of 2,838 DEGs produced in the LD vs MD, LE vs ME, LE vs LD, and ME vs MD comparison groups were annotated in the GO and KEGG databases in the present study. Some DEGs had been identified in follicle development and hormone metabolism by RNA-seq37, 44. Further validations had been made using quantitative PCR for a part of DEGs, such as insulin-like 3 precursor (INSL3), SULT1C3, and hypoxia-inducible factor 1-alpha isoform 3 (HIF1ß)20, 21, 37. Previous studies suggested that INSL3 might be an important intrafollicular modulator of theca interna cell function/steroidogenesis45 and theca cell-derived growth factor for pre antral follicle46. It has been reported that SULT1C3, a member of sulfotransferase family, catalyzes the sulfate conjugation of several hormones47, 48, and regulates estrogen removal in estrogen metabolic pathway19. In addition, HIF1ß is a critical mediator of follicle development and ovulation and a regulator of gene expression in ovary49, 50. Several genes, such as INSL3, STAR, and HIF1ß, were associated with follicular development, ovulation, and steroid secretion in the ovary of Qira black sheep at estrous and anestrous37. VEGF and STAR play important roles in follicle development and steroid synthesis in Qira Black Sheep and Hetian Sheep21. Angiogenesis is critical for female ovulatory cycle, including follicular development, ovulation, and corpora lutea formation51. The VEGF system is the most important signaling pathway in angiogenesis52. STAR is essential for steroid hormone synthesis and involved in the regulation of follicular development in mammalian ovary53–55. But we did not detect VEGF and STAR in the DEGs, which could be due to the difference between different species. In our present study, there were 26 DEGs between breeds at both diestrus and estrus, which may be caused by the differences between breeds8. These 26 DEGs were mainly involved in the single-organism process, and mainly related to binding and catalytic activity. The predicted novel genes in our present study also provided clues for the research on estrus expression between different breeds and different stages of estrus cycle. The function of these new genes has not been identified. Further studies are needed to evaluate if whether they are new candidate genes related to estrus expression.
Follicles, as important tissues of animal reproductive organs, fulfill many pivotal functions, including oocyte and granulosa cells production and hormone secretion. They have obvious differences in shape and biological activity during estrous cycle21, 37, 56. In the ovarian follicles, sex steroids are synthesized from granulosa and thecal cells in the follicular wall34. Previous study found that two signaling networks (Notch, SLIT/ROBO and PI3K signaling, and ITGB5 and extracellular matrix signaling) were associated with follicular development through extracellular signal related kinases (ERKs)57. In our present study, the GO annotation and KEGG pathway analysis clearly revealed that some hormone related genes were involved in steroid biosynthesis and ovarian steroidogenesis pathways, which indicates that the two pathways were activated in the ovaries of Large White and Mi gilts at estrus. In the steroid biosynthesis and ovarian steroidogenesis pathway, most of the DEGs were upregulated in the LD and MD groups, which suggests that these genes were activated and overexpressed during the diestrus. Most of these genes belong to cytochrome P450 family and oxidoreductases family, and participate in the redox reaction19. SCARB1 and LDLR have been shown to be involved in biosynthesis of steroid hormones through affecting on the absorption of cholesterol substrates from circulating lipoproteins58–60, which suggests that lipid metabolism also play a role at estrus. Other genes related to steroid hormones could also be important to ovarian function in regulation of female reproduction.
In addition, follicular development also integrates the proliferation and differentiation of cells in the ovarian follicular wall with the transportation of nutrients, and the supplementation of energy61, 62. Results of our present study provided abundant information for some signaling pathways, such as ECM–receptor interaction, olfactory transduction, cell cycle, cell cycle-yeast, phagosome, ribosome, PI3K-Akt signaling, metabolic pathways, DNA replication, cell adhesion molecules (CAMs), and biosynthesis of secondary metabolites. Results of our present study indicates that these pathways potentially regulate estrus expression. Among these signaling pathways, ECM-receptor interaction and olfactory transduction had significant difference in three of four comparison groups. The extracellular matrix (ECM) consists of a complex mixture of structural and functional macromolecules, and plays an important role in tissue and organ morphogenesis63. Specific interaction between cells and the ECM leads to the direct or indirect control of cellular activities, such as adhesion, migration, differentiation, proliferation, and apoptosis64. In addition, a previous study performed a genome-wide analysis of domestic pigs and Tibetan wild boars, and found that 35 genes were enriched in olfactory transduction pathway65. It is a better response to a wider range of food types because of resource-poor plateau65. Moreover, a better sense of smell may also be favored by artificial selection because it enhances disease aversion and facilitates the estrus expression and ovulation of females, which is stimulated by the pheromones in the saliva of boars and then enhances sexual receptive behavior of females66, 67. In the present study, most DEGs in the pathways affected by different stages of estrus within breeds were activated and overexpressed at estrus. These pathways also have important roles in modulating the balance of integrating cell proliferation, energy supplementation, nutrient delivery, and steroid hormone synthesis, which are important processes for sustaining normal folliculogenesis34 and estrus.
In addition, 16 genes involved in cell adhesion molecules (CAMs) were also downregulated at estrus. CAMs, as cell surface proteins, were involved in many biological processes, such as cell adhesion, proliferation, differentiation, developmental processes of fertilization, embryogenesis, and embryonic development68, 69. During the rapid growth and development of follicles, a large amount of energy is required to supply ATP for DNA and protein synthesis in the follicular membrane70. Cell cycle, cell cycle-yeast, ribosome, DNA replication, biosynthesis of secondary metabolites and metabolic pathways are related to the growth and development of the follicle34, as well as expression of estrus. In our present study, most of the DEGs involved in metabolic pathways (91/135) and cell cycle (26/27) were downregulated at estrus, which indicates that these DGEs involved in metabolic pathways and cell cycle pathways could inhibit the follicular development, and ovulation. However, the exact relationships between these signaling networks are not fully understood, and no evidences has been reported to support the effects of these pathways at estrus. In our present study, some DEGs repeatedly appeared in various signaling pathways, and their roles at estrus should be studied in the future.
In conclusion, we generated the expression profile of mRNA in pig follicles of Large White gilts at diestrus (LD) and estrus (LE), Mi gilts at diestrus (MD) and estrus (ME) using RNA-seq. A total of 122,804-335,295 SNPs, 6,140-14,947 InDel and 12 types of AS events (39.57% TSS, 34.90% TTS) were detected in the 11 samples. A total of 2,838 genes were differentially expressed between the groups. These DEGs are involved in important biological processes, such as single-organism process, binding, catalytic activity, cell adhesion and enriched in ECM-receptor interaction, olfactory transduction, ovarian steroidogenesis, cell cycle, steroid biosynthesis, CAMs, phagosome, and ribosome signaling pathways, which depicts a complex mechanism underlying the modulation of estrus characteristics. Thus, these newly identified DEGs should be considered as new candidate genes with functions in regulating estrus. These results provide useful information for future in-depth studies on estrus expression.
Materials and Methods
Ethics Statement
All experimental procedures were conducted according to the “Guidelines for Experimental Animals” of the Ministry of Science and Technology (Beijing, China). This study was reviewed and approved by the ethics committee of Nanjing Agricultural University. Animals were humanely sacrificed as necessary to ameliorate suffering.
Animals
Thirty Large White gilts and 30 Mi gilts were observed for expression of estrus at Yong Kang Agricultural Science and Technology Co., Ltd in Changzhou city, Jiangsu Province, China. The gilts were selected before their second estrus cycle. Their breed, group, body weight, and backfat thickness information are shown in Supplementary Table S1. The Large White and Mi gilts were raised in under a standardized feeding regimen with free access to water.
Estrus detection and sample collection
Estrus detection was carefully performed twice daily (at 7:00 and 15:00) at pro-estrus. Expression of estrus were defined as standing reflex, and reddening and swelling of the vulva71. Inspections to evaluate standing reflex, and reddening and swelling of the vulva were made on gilts individually by an experienced technician using a standardized routine3. A sexual mature boar was introduced into each pen for at least 15 min daily to ensure adequate stimulation, during which the gilts had directly head-to-head contact with the boar. Standing reflex was assessed by the back-pressure test. Reddening and swelling of the vulva was measured visually. When a standing reflex occurred, the expression of estrus were scored (0: no; 1: weak; 2: strong)13, 36, 72 according to a standard scoring system (Table 7).
Table 7.
Scoring systems for estrus expression of Large white and Mi gilts.
| Estrus expression | Standing reflex | Reddening and swelling of the vulva | Mucus discharge from the vulva | |
|---|---|---|---|---|
| Scoring standards | 0 | No standing reflex for the back-pressure test within 5 min, or weakly exhibits the standing reflex for the back-pressure test after 5 min | White, or no difference with skin color, no swelling | No mucus |
| 1 | Moderately exhibits the standing reflex after the back-pressure test (stands for boar but moves around some) within 5 min | Pink, slightly heavier than the skin color, slight swelling, a little fold | A small amount of mucus, pussy humid, can’t be pulled into filamentous | |
| 2 | Strongly exhibits the standing reflex after the back-pressure test (stands firm without any movement) | Red to fuchsia, significantly deeper than the skin color, swelling significantly, no fold, present bullate | Mucus presents transparent to yellow and viscous, can be formed mucus drops in the corner below the vulva, and mucus can be pulled into filamentous | |
After the first scoring, Large White and Mi gilts with scores of 2 points were selected (sampling flow chart is shown in Fig. 5). At the onset of standing reflex in the second estrus cycle, amount of 5 ml blood was collected from the anterior vena cava of gilts at the 10th day of estrus cycle. Blood samples were centrifuged at 3,000 rpm for 10 min, immediately after collection. The plasma was stored at −20 °C until analyses. Before the third estrus cycle, 6 Large White gilts and 6 Mi gilts were selected. The estrus cycles were about 21 d in length and the scores of the estrus expression were two points. At the first day of the third estrous, the day the gilts were at onset of exhibiting standing reflex, three Large White and three Mi gilts were slaughtered humanely by anesthesia. At the 10th day of estrous cycle, 3 Large White and 3 Mi gilts were slaughtered in the same way. Ovaries were dissected and all samples were collected with better ovulation points or preovulatory follicles on the surfaces of the ovaries. All samples were immediately frozen in liquid nitrogen and stored at −80 °C until RNA was isolated.
Figure 5.
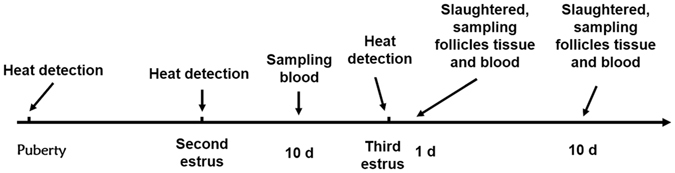
The sampling flow chart.
Total RNA isolation
Total RNA was extracted from the follicles using TRIzol reagent (Invitrogen) and treated with DNase I following the manufacturer’s instructions. Degradation and contamination of total RNA were monitored on 1% agarose gels. RNA concentration was measured using Qubit RNA Assay Kit in Qubit 2.0 Flurometer (Life Technologies, CA, USA), its purity was assessed using the NanoPhotometer® Spectrophotometer (IMPLEN, CA, USA), the concentration and integrity were assessed using a RNA Nano 6000 Assay Kit of the Agilent Bioanalyzer 2100 system (Agilent Technologies, CA, USA).
Library preparation for RNA-seq
According to the manufacturer’s manual, sequencing libraries were generated using NEBNext Ultra™ RNA Library Prep Kit for Illumina (NEB, USA). Amount of 3 μg RNA per sample was used to purify mRNA using poly-T oligo attached magnetic beads and then the purified mRNA was interrupted into short fragments (about 200 bp) by the fragmentation buffer. First strand cDNA was synthesized using random hexamer primer and M-MuLV Reverse Transcriptase (RNase H). After adding buffer, dNTPs, DNA polymerase I (New England Biolabs) and RNase H (Invitrogen), the second strand cDNA synthesis was subsequently performed using DNA polymerase I and RNase H. After adenylation of 3’ ends of DNA fragments, NEBNext Adapter was ligated to prepare for hybridization. The cDNA fragments with 150–200 bp in length were selected for PCR amplification to create cDNA libraries. The library preparations were sequenced on an Illumina Hiseq 2500 platform and generated 125 bp paired-end reads.
Data analysis
Raw data sequenced from the last step were saved as a format of fastq. All clean reads were obtained by rejecting low quality sequences or reads (it has more than 5% unknown nucleotides) and sequencing adapters. In addition, the Q20, Q30, and GC content were calculated. The reference genomes and the annotation file were downloaded from ENSEMBL database (http://www.ensembl.org/index.html). The software Bowtie2 (v2.2.3) was used for building the genome index. Clean data were mapped to the reference genome using TopHat (v2.0.12). More than 2 bp of mismatches were not considered. Unmapped or multi-position matched reads were excluded from further analyses. In addition, sequence saturation analyses of the four libraries were executed to provide an overview of the project. Reads count of each gene was counted using HTSeq (v0.6.0). RPKMs were then calculated to estimate the expression level of genes, which can eliminate the effect of sequencing depth and gene length on gene expression levels and the data could be compared directly27.
Identification of SNP, InDel, and Alternative splicing (AS)
SNP and InDel analyses were performed by mapping RNA-seq reads into the genomic of Sus scrofa (sscrofa10.2) using Samtools (v1.3.1)73. The AS events for each library using ASprofile.b (v1.0.4).
Identification of differentially expressed genes (DEGs)
The software DESeq (v1.16) was used for differential gene expression analysis between two samples with biological replicates using a model based on the negative binomial distribution. The P-value had been assigned to each gene and adjusted by the Benjamini and Hochberg’s approach for controlling the false discovery rate74. Genes with q ≤ 0.05 and |log2_ratio| ≥ 1 were identified as differentially expressed genes (DEGs).
GO and KEGG enrichment analysis
The GO (Gene Ontology, http://geneontology.org/) enrichment of DEGs was implemented by the hypergeometric test75, in which P-value was calculated and adjusted as q-value, and data background was genes in the whole genome. GO terms with q < 0.05 were considered to be significantly enriched. GO enrichment analysis can exhibit the biological functions of the DEGs. KEGG (Kyoto Encyclopedia of Genes and Genomes, http://www.kegg.jp/) is a database resource containing a collection of manually drawn pathway maps representing our knowledge on the molecular interaction and reaction networks76. The KEGG enrichment of DEGs was also implemented by the hypergeometric test, in which p-value was adjusted by multiple comparisons as q-value. KEGG terms with q < 0.05 were considered to be significantly enriched.
Real-time RT-PCR
RNA samples from the 11 gilts in the RNA-seq experiment were used to validate the results by quantitative real-time RT-PCR (qPCR), which was performed as previously described77. Total cDNA was synthesized using reverse transcriptase Kit (TaKaRa, Dalian). To amplify specific fragments referring to selected regulated genes, specific primers were designed with NCBI Primer-BLAST (Supplementary Table S2). Real-time PCR reactions were performed as described by the manufacturer in triplicate with MaximaTM SYBR Green/ROX qPCR Master Mix (Fermentas) on an Applied Biosystems Step One Plus system using the following program: 10 min at 95 °C; followed by 40 cycles of 15 s at 95 °C and 60 s at 60 °C; then a 55–95 °C melting curve detection. The GAPDH gene was used as a control in the experiments. All amplifications were followed by dissociation curve analysis of the amplified products. Relative expression levels of the selected target genes were calculated with the 2(-Delta Delta C[T]) method78. The statistical difference in gene expression between groups was analyzed by IBM SPSS Statistics (v20.0). The results are presented as mean ± standard deviation. The correlation between the results of RNA-seq and qPCR was calculated using correlation test (pearson correlation) by IBM SPSS Statistics (v20.0)38.
Electronic supplementary material
Acknowledgements
This work was supported by the Fundamental Research Funds for the Central Universities (KYZ201532) and the National Natural Science Foundation of China (31672465).
Author Contributions
B.Z. conceived and designed the experiments; Q.C., R.C. and F.X. performed the experiments; Q.C. analyzed the data, prepared figure and contributed writing the manuscript; Q.C., F.X., R.C., C.S. T.L., and Y.L. collected the samples; Q.C., B.Z. and A. P. S. reviewing the manuscript. All authors contributed to the manuscript at various stages.
Competing Interests
The authors declare that they have no competing interests.
Footnotes
Electronic supplementary material
Supplementary information accompanies this paper at doi:10.1038/s41598-017-04336-x
Publisher's note: Springer Nature remains neutral with regard to jurisdictional claims in published maps and institutional affiliations.
References
- 1.Gäde S, et al. A note on genetic parameters for estrus symptoms in sows. Applied Animal Behaviour Science. 2008;109:406–409. doi: 10.1016/j.applanim.2007.04.004. [DOI] [Google Scholar]
- 2.Eliasson L. Relationships between puberty and production traits in the gilt. 2. Oestrous symptoms at puberty. Animal Reproduction Science. 1991;25:255–264. doi: 10.1016/0378-4320(91)90020-Z. [DOI] [Google Scholar]
- 3.Eliasson-Selling, L. Puberty and oestrous symptoms in gilts with special reference to the relationship with production traits. (Sveriges Lantbruksuniv., 1991).
- 4.Knauer MT, Cassady J, Newcom D, See MT. Phenotypic and genetic correlations between gilt estrus, puberty, growth, composition, and structural conformation traits with first-litter reproductive measures. J Anim Sci. 2011;89:935–942. doi: 10.2527/jas.2009-2673. [DOI] [PubMed] [Google Scholar]
- 5.Knauer, M., See, M., Cassady, J. & Newcom, D. Understanding the genetic and phenotypic relationships between gilt development and estrus behavior traits with sow reproductive lifetime.
- 6.Eliasson L. A study on puberty and oestrus in gilts. Journal of Veterinary Medicine Series A. 1989;36:46–54. doi: 10.1111/j.1439-0442.1989.tb00701.x. [DOI] [PubMed] [Google Scholar]
- 7.Signoret, J. Reproductive-behaviour of pigs. J Reprod Fertil, 105–117 (1970). [PubMed]
- 8.Bazer FW, Thatcher WW, Martinatbotte F, Terqui M. Sexual-Maturation and Morphological Development of the Reproductive-Tract in Large White and Prolific Chinese Meishan Pigs. J Reprod Fertil. 1988;83:723–728. doi: 10.1530/jrf.0.0830723. [DOI] [PubMed] [Google Scholar]
- 9.White BR, Mclaren DG, Dziuk PJ, Wheeler MB. Age at Puberty, Ovulation Rate, Uterine Length, Prenatal Survival and Litter Size in Chinese Meishan and Yorkshire Females. Theriogenology. 1993;40:85–97. doi: 10.1016/0093-691X(93)90343-4. [DOI] [PubMed] [Google Scholar]
- 10.Bolet G, et al. Components of Prolificacy in Hyperprolific Large White Sows Compared with the Meishan and Large White Breeds. Genet Sel Evol. 1986;18:333–342. doi: 10.1186/1297-9686-18-3-333. [DOI] [PMC free article] [PubMed] [Google Scholar]
- 11.Ding W, et al. Formation of primordial follicles and immunolocalization of PTEN, PKB and FOXO3A proteins in the ovaries of fetal and neonatal pigs. The Journal of reproduction and development. 2010;56:162–168. doi: 10.1262/jrd.09-094H. [DOI] [PubMed] [Google Scholar]
- 12.Sterning M, Rydhmer L, Einarsson S, Andersson K. Oestrous symptoms in primiparous sows. 1. Duration and intensity of external oestrous symptoms. Animal Reproduction Science. 1994;36:305–314. doi: 10.1016/0378-4320(94)90076-0. [DOI] [Google Scholar]
- 13.Rydhmer L, Eliasson-Selling L, Johansson K, Stern S, Andersson K. A genetic study of estrus symptoms at puberty and their relationship to growth and leanness in gilts. Journal of animal science. 1994;72:1964–1970. doi: 10.2527/1994.7281964x. [DOI] [PubMed] [Google Scholar]
- 14.Zavy MT, Geisert RD, Buchanan DS, Norton SA. Estrogen-Induced Pseudopregnancy in Gilts - Its Use in Estrus Synchronization and Subsequent Influence on Litter Response. Theriogenology. 1988;30:721–732. doi: 10.1016/0093-691X(88)90307-X. [DOI] [PubMed] [Google Scholar]
- 15.Knauer, M. Genetics of gilt estrous behavior. (2009).
- 16.Kuehn LA, Nonneman DJ, Klindt JM, Wise TH. Genetic relationships of body composition, serum leptin, and age at puberty in gilts. J Anim Sci. 2009;87:477–483. doi: 10.2527/jas.2008-0936. [DOI] [PubMed] [Google Scholar]
- 17.Hossner, K. L. Hormonal regulation of farm animal growth. 181–183 (CABI International, 2005).
- 18.Franczak A, Wojciechowicz B, Zmijewska A, Kolakowska J, Kotwica G. The effect of interleukin 1beta and interleukin 6 on estradiol-17beta secretion in the endometrium of pig during early pregnancy and the estrous cycle. Theriogenology. 2013;80:90–98. doi: 10.1016/j.theriogenology.2013.03.020. [DOI] [PubMed] [Google Scholar]
- 19.Low YL, et al. Multi-variant pathway association analysis reveals the importance of genetic determinants of estrogen metabolism in breast and endometrial cancer susceptibility. PLoS genetics. 2010;6:e1001012. doi: 10.1371/journal.pgen.1001012. [DOI] [PMC free article] [PubMed] [Google Scholar]
- 20.Franczak A, Wojciechowicz B, Kotwica G. Transcriptomic analysis of the porcine endometrium during early pregnancy and the estrous cycle. Reprod Biol. 2013;13:229–237. doi: 10.1016/j.repbio.2013.07.001. [DOI] [PubMed] [Google Scholar]
- 21.Chen, H. Y. et al. Differential Gene Expression in Ovaries of Qira Black Sheep and Hetian Sheep Using RNA-Seq Technique. Plos One10 (2015). [DOI] [PMC free article] [PubMed]
- 22.Samborski A, Graf A, Krebs S, Kessler B, Bauersachs S. Deep sequencing of the porcine endometrial transcriptome on day 14 of pregnancy. Biology of reproduction. 2013;88:84. doi: 10.1095/biolreprod.113.107870. [DOI] [PubMed] [Google Scholar]
- 23.Li MD, Enfield FD. A Characterization of Chinese Breeds of Swine Using Cluster-Analysis. J Anim Breed Genet. 1989;106:379–388. doi: 10.1111/j.1439-0388.1989.tb00254.x. [DOI] [Google Scholar]
- 24.Fan B, et al. Genetic variation analysis within and among Chinese indigenous swine populations using microsatellite markers. Anim Genet. 2002;33:422–427. doi: 10.1046/j.1365-2052.2002.00898.x. [DOI] [PubMed] [Google Scholar]
- 25.Hunter MG, Biggs C, Foxcroft GR, McNeilly AS, Tilton JE. Comparisons of endocrinology and behavioural events during the periovulatory period in Meishan and large-white hybrid gilts. J Reprod Fertil. 1993;97:475–480. doi: 10.1530/jrf.0.0970475. [DOI] [PubMed] [Google Scholar]
- 26.Hunter MG, et al. Periovulatory endocrinology in high ovulating Meishan sows. The Journal of endocrinology. 1996;150:141–147. doi: 10.1677/joe.0.1500141. [DOI] [PubMed] [Google Scholar]
- 27.Mortazavi A, Williams BA, McCue K, Schaeffer L, Wold B. Mapping and quantifying mammalian transcriptomes by RNA-Seq. Nature methods. 2008;5:621–628. doi: 10.1038/nmeth.1226. [DOI] [PubMed] [Google Scholar]
- 28.Low YL, et al. Multi-variant pathway association analysis reveals the importance of genetic determinants of estrogen metabolism in breast and endometrial cancer susceptibility. PLoS Genet. 2010;6:e1001012. doi: 10.1371/journal.pgen.1001012. [DOI] [PMC free article] [PubMed] [Google Scholar]
- 29.Porubek D. CYP17A1: A Biochemistry, Chemistry, and Clinical Review. Current Topics in Medicinal Chemistry. 2013;13:1364–1384. doi: 10.2174/1568026611313120002. [DOI] [PubMed] [Google Scholar]
- 30.Ang LS, Cruz RP, Hendel A, Granville DJ. Apolipoprotein E, an important player in longevity and age-related diseases. Experimental Gerontology. 2008;43:615–622. doi: 10.1016/j.exger.2008.03.010. [DOI] [PubMed] [Google Scholar]
- 31.Ying LS, et al. Complement component 7 (C7), a potential tumor suppressor, is correlated with tumor progression and prognosis. Oncotarget. 2016;7:86536–86546. doi: 10.18632/oncotarget.13294. [DOI] [PMC free article] [PubMed] [Google Scholar]
- 32.Wang SH, et al. An evaluation of association between common variants in C4BPB/C4BPA genes and schizophrenia. Neuroscience Letters. 2015;590:189–192. doi: 10.1016/j.neulet.2015.02.005. [DOI] [PubMed] [Google Scholar]
- 33.Kwon, S. G. et al. Identification of Differentially Expressed Genes Associated with Litter Size in Berkshire Pig Placenta. Plos One11 (2016). [DOI] [PMC free article] [PubMed]
- 34.Liu HH, et al. The comprehensive mechanisms underlying nonhierarchical follicular development in geese (Anser cygnoides) Animal Reproduction Science. 2015;159:131–140. doi: 10.1016/j.anireprosci.2015.06.007. [DOI] [PubMed] [Google Scholar]
- 35.Hatzirodos, N. et al. Transcriptome profiling of granulosa cells of bovine ovarian follicles during growth from small to large antral sizes. BMC genomics15 (2014). [DOI] [PMC free article] [PubMed]
- 36.Knauer M, Cassady J, Newcom D, See M. Estimates of variance components for genetic correlations among swine estrus traits. J Anim Sci. 2010;88:2913–2919. doi: 10.2527/jas.2009-2639. [DOI] [PubMed] [Google Scholar]
- 37.Zeng XC, et al. Exploring differentially expressed genes in the ovaries of estrous and anestrous Qira black sheep using RNA-seq technique. Indian J Anim Sci. 2016;86:158–162. [Google Scholar]
- 38.Wang, Y. Y. et al. Analyses of Long Non-Coding RNA and mRNA profiling using RNA sequencing during the pre-implantation phases in pig endometrium. Sci Rep-Uk6 (2016). [DOI] [PMC free article] [PubMed]
- 39.Ka H, Seo H, Kim M, Choi Y, Lee CK. Identification of Differentially Expressed Genes in the Uterine Endometrium on Day 12 of the Estrous Cycle and Pregnancy in Pigs. Mol Reprod Dev. 2009;76:75–84. doi: 10.1002/mrd.20935. [DOI] [PubMed] [Google Scholar]
- 40.Li XJ, Zhou J, Liu LQ, Qian K, Wang CL. Identification of genes in longissimus dorsi muscle differentially expressed between Wannanhua and Yorkshire pigs using RNA-sequencing. Anim Genet. 2016;47:324–333. doi: 10.1111/age.12421. [DOI] [PubMed] [Google Scholar]
- 41.Romanini C, et al. Typing short amplicon binary polymorphisms: supplementary SNP and Indel genetic information in the analysis of highly degraded skeletal remains. Forensic Science International: Genetics. 2012;6:469–476. doi: 10.1016/j.fsigen.2011.10.006. [DOI] [PubMed] [Google Scholar]
- 42.Kornblihtt, A. R. et al. Alternative splicing: a pivotal step between eukaryotic transcription and translation (vol 14, pg 153, 2013). Nature Reviews Molecular Cell Biology14 (2013). [DOI] [PubMed]
- 43.Florea, L., Song, L. & Salzberg, S. L. Thousands of exon skipping events differentiate among splicing patterns in sixteen human tissues. F1000Research2 (2013). [DOI] [PMC free article] [PubMed]
- 44.Bonnet A, et al. Transcriptome profiling of sheep granulosa cells and oocytes during early follicular development obtained by laser capture microdissection. BMC genomics. 2011;12:417. doi: 10.1186/1471-2164-12-417. [DOI] [PMC free article] [PubMed] [Google Scholar]
- 45.Satchell L, et al. Ovarian expression of insulin-like peptide 3 (INSL3) and its receptor (RXFP2) during development of bovine antral follicles and corpora lutea and measurement of circulating INSL3 levels during synchronized estrous cycles. Endocrinology. 2013;154:1897–1906. doi: 10.1210/en.2012-2232. [DOI] [PubMed] [Google Scholar]
- 46.Xue K, Kim JY, Liu J-y, Tsang BK. Insulin-like 3-induced rat preantral follicular growth is mediated by growth differentiation factor 9. Endocrinology. 2013;155:156–167. doi: 10.1210/en.2013-1491. [DOI] [PubMed] [Google Scholar]
- 47.Dubaisi S, Fang H, Kocarek TA, Runge-Morris M. Transcriptional Regulation of Human Cytosolic Sulfotransferase 1C3 by Peroxisome Proliferator-Activated Receptor gamma in LS180 Human Colorectal Adenocarcinoma Cells. Molecular pharmacology. 2016;90:562–569. doi: 10.1124/mol.116.106005. [DOI] [PMC free article] [PubMed] [Google Scholar]
- 48.Duniec-Dmuchowski Z, et al. Expression of the orphan cytosolic sulfotransferase SULT1C3 in human intestine: characterization of the transcript variant and implications for function. Drug metabolism and disposition: the biological fate of chemicals. 2014;42:352–360. doi: 10.1124/dmd.113.055665. [DOI] [PMC free article] [PubMed] [Google Scholar]
- 49.Rico, C. et al. HIF1 Activity in Granulosa Cells Is Required for FSH-Regulated Vegfa Expression and Follicle Survival in Mice. Biol Reprod90 (2014). [DOI] [PubMed]
- 50.Navanukraw C, Thammasiri J, Moonmanee T, Natthakornkul J. Expression of vascular endothelial growth factor and hypoxia-inducible factor-1 alpha during the periovulatory period in goats. Turk J Vet Anim Sci. 2014;38:699–706. doi: 10.3906/vet-1404-54. [DOI] [Google Scholar]
- 51.Fraser HM. Regulation of the ovarian follicular vasculature. Reproductive biology and endocrinology: RB&E. 2006;4:18. doi: 10.1186/1477-7827-4-18. [DOI] [PMC free article] [PubMed] [Google Scholar]
- 52.Irusta G, Abramovich D, Parborell F, Tesone M. Direct survival role of vascular endothelial growth factor (VEGF) on rat ovarian follicular cells. Molecular and cellular endocrinology. 2010;325:93–100. doi: 10.1016/j.mce.2010.04.018. [DOI] [PubMed] [Google Scholar]
- 53.Manna PR, Huhtaniemi IT, Stocco DM. Detection of hCG Responsive Expression of the Steroidogenic Acute Regulatory Protein in Mouse Leydig Cells. Biological procedures online. 2004;6:83–93. doi: 10.1251/bpo76. [DOI] [PMC free article] [PubMed] [Google Scholar]
- 54.Yamashita H, Murayama C, Takasugi R, Miyamoto A, Shimizu T. BMP-4 suppresses progesterone production by inhibiting histone H3 acetylation of StAR in bovine granulosa cells in vitro. Molecular and cellular biochemistry. 2011;348:183–190. doi: 10.1007/s11010-010-0653-9. [DOI] [PubMed] [Google Scholar]
- 55.Adib A, et al. Progesterone improves the maturation of male-induced preovulatory follicles in anoestrous ewes. Reproduction. 2014;148:403–416. doi: 10.1530/REP-14-0263. [DOI] [PubMed] [Google Scholar]
- 56.Yang Y, et al. Ovarian Transcriptome Analysis of Portunus trituberculatus Provides Insights into Genes Expressed during Phase III and IV Development. Plos One. 2015;10:e0138862. doi: 10.1371/journal.pone.0138862. [DOI] [PMC free article] [PubMed] [Google Scholar]
- 57.Hatzirodos N, et al. Transcriptome profiling of granulosa cells from bovine ovarian follicles during atresia. BMC genomics. 2014;15:40. doi: 10.1186/1471-2164-15-40. [DOI] [PMC free article] [PubMed] [Google Scholar]
- 58.Argov N, Sklan D. Expression of mRNA of lipoprotein receptor related protein 8, low density lipoprotein receptor, and very low density lipoprotein receptor in bovine ovarian cells during follicular development and corpus luteum formation and regression. Mol Reprod Dev. 2004;68:169–175. doi: 10.1002/mrd.20072. [DOI] [PubMed] [Google Scholar]
- 59.Miller WL, Auchus RJ. The molecular biology, biochemistry, and physiology of human steroidogenesis and its disorders. Endocrine reviews. 2011;32:81–151. doi: 10.1210/er.2010-0013. [DOI] [PMC free article] [PubMed] [Google Scholar]
- 60.Ying SJ, et al. Effect of nutrition on plasma lipid profile and mRNA levels of ovarian genes involved in steroid hormone synthesis in Hu sheep during luteal phase. Journal of animal science. 2013;91:5229–5239. doi: 10.2527/jas.2013-6450. [DOI] [PubMed] [Google Scholar]
- 61.Johnson AL, Woods DC. Dynamics of avian ovarian follicle development: cellular mechanisms of granulosa cell differentiation. General and comparative endocrinology. 2009;163:12–17. doi: 10.1016/j.ygcen.2008.11.012. [DOI] [PubMed] [Google Scholar]
- 62.Palma GA, et al. Biology and biotechnology of follicle development. TheScientificWorldJournal. 2012;2012:938138. doi: 10.1100/2012/938138. [DOI] [PMC free article] [PubMed] [Google Scholar]
- 63.Ling YH, et al. Exploring differentially expressed genes in the ovaries of uniparous and multiparous goats using the RNA-Seq (Quantification) method. Gene. 2014;550:148–153. doi: 10.1016/j.gene.2014.08.008. [DOI] [PubMed] [Google Scholar]
- 64.Bosman FT, Stamenkovic I. Functional structure and composition of the extracellular matrix. J Pathol. 2003;200:423–428. doi: 10.1002/path.1437. [DOI] [PubMed] [Google Scholar]
- 65.Li MZ, et al. Genomic analyses identify distinct patterns of selection in domesticated pigs and Tibetan wild boars. Nat Genet. 2013;45:1431–U1180. doi: 10.1038/ng.2811. [DOI] [PubMed] [Google Scholar]
- 66.Mak GK, et al. Male pheromone-stimulated neurogenesis in the adult female brain: possible role in mating behavior. Nature neuroscience. 2007;10:1003–1011. doi: 10.1038/nn1928. [DOI] [PubMed] [Google Scholar]
- 67.Marchese S, Pes D, Scaloni A, Carbone V, Pelosi P. Lipocalins of boar salivary glands binding odours and pheromones. European journal of biochemistry. 1998;252:563–568. doi: 10.1046/j.1432-1327.1998.2520563.x. [DOI] [PubMed] [Google Scholar]
- 68.Sun MK, Xie W. Cell adhesion molecules in Drosophila synapse development and function. Sci China Life Sci. 2012;55:20–26. doi: 10.1007/s11427-012-4273-3. [DOI] [PubMed] [Google Scholar]
- 69.Simopoulou M, Nikolopoulou E, Dimakakos A, Charalabopoulos K, Koutsilieris M. Cell Adhesion Molecules and In Vitro Fertilization. In Vivo. 2014;28:683–690. [PubMed] [Google Scholar]
- 70.Seol HS, Sato K, Murakami H, Toyomizu M, Akiba Y. Changes in gene expression involved in energy utilization during chicken follicle development. Animal Reproduction Science. 2006;95:283–294. doi: 10.1016/j.anireprosci.2005.09.016. [DOI] [PubMed] [Google Scholar]
- 71.Brandt Y, Lundeheim N, Madej A, Rodriguez-Martinez H, Einarsson S. Effects of ACTH injections during estrus on concentrations and patterns of progesterone, estradiol, LH, and inhibin α and time of ovulation in the sow. Domestic animal endocrinology. 2007;32:122–137. doi: 10.1016/j.domaniend.2006.02.002. [DOI] [PubMed] [Google Scholar]
- 72.Sterning M, Rydhmer L, Eliasson-Selling L. Relationships between age at puberty and interval from weaning to estrus and between estrus signs at puberty and after the first weaning in pigs. J Anim Sci. 1998;76:353–359. doi: 10.2527/1998.762353x. [DOI] [PubMed] [Google Scholar]
- 73.Li H, et al. The Sequence Alignment/Map format and SAMtools. Bioinformatics. 2009;25:2078–2079. doi: 10.1093/bioinformatics/btp352. [DOI] [PMC free article] [PubMed] [Google Scholar]
- 74.Benjamini Y, Drai D, Elmer G, Kafkafi N, Golani I. Controlling the false discovery rate in behavior genetics research. Behavioural brain research. 2001;125:279–284. doi: 10.1016/S0166-4328(01)00297-2. [DOI] [PubMed] [Google Scholar]
- 75.Ashburner M, et al. Gene ontology: tool for the unification of biology. The Gene Ontology Consortium. Nature genetics. 2000;25:25–29. doi: 10.1038/75556. [DOI] [PMC free article] [PubMed] [Google Scholar]
- 76.Kanehisa M, et al. KEGG for linking genomes to life and the environment. Nucleic acids research. 2008;36:D480–484. doi: 10.1093/nar/gkm882. [DOI] [PMC free article] [PubMed] [Google Scholar]
- 77.Streyl D, et al. Gene expression profiling of bovine peripartal placentomes: detection of molecular pathways potentially involved in the release of foetal membranes. Reproduction. 2012;143:85–105. doi: 10.1530/REP-11-0204. [DOI] [PubMed] [Google Scholar]
- 78.Livak KJ, Schmittgen TD. Analysis of relative gene expression data using real-time quantitative PCR and the 2−ΔΔCT method. methods. 2001;25:402–408. doi: 10.1006/meth.2001.1262. [DOI] [PubMed] [Google Scholar]
Associated Data
This section collects any data citations, data availability statements, or supplementary materials included in this article.