

Abstract
To improve the capabilities of conventional methodologies in facilitating industrial water allocation under uncertain conditions, an integrated approach was developed through the combination of operational research, uncertainty analysis, and violation risk analysis methods. The developed approach can (a) address complexities of industrial water resources management (IWRM) systems, (b) facilitate reflections of multiple uncertainties and risks of the system and incorporate them into a general optimization framework, and (c) manage robust actions for industrial productions in consideration of water supply capacity and wastewater discharging control. The developed method was then demonstrated in a water-stressed city (i.e., the City of Dalian), northeastern China. Three scenarios were proposed according to the city’s industrial plans. The results indicated that in the planning year of 2020 (a) the production of civilian-used steel ships and machine-made paper & paperboard would reduce significantly, (b) violation risk of chemical oxygen demand (COD) discharge under scenario 1 would be the most prominent, compared with those under scenarios 2 and 3, (c) the maximal total economic benefit under scenario 2 would be higher than the benefit under scenario 3, and (d) the production of rolling contact bearing, rail vehicles, and commercial vehicles would be promoted.
Introduction
Water is one of the most vital natural resources in the world. In the past century, water in the earth was subject to significant changes due to rising water consumption that was driven by industrialization and urbanization1–3. Meanwhile, deterioration of water quality caused by industrial wastewater discharge has emerged in many developing countries4. For example, one-third of wastewater was discharged by industrial sectors in China according to environmental statistics of 20135. Water managers of multiple jurisdictions are facing dual challenges from water resources shortage and water quality reduction. Such challenges will be aggravated in the future due to a significant increase in industrial water demand6, 7. Particularly, with the implementation of sustainable development plans for society, economy, and environment in China8, it is of importance to mitigate industrial impacts on water resources deficit and water quality decline in the near future9–12. Moreover, uncertain future conditions (e.g., unknown water inflows and diverse industrial activities) will continuously require novel methods to support decision making in industrial water resources management (IWRM) systems13–15.
Over the past decade, IWRM has attracted many studies16. The studies were mostly focused on water resources consumption of a single industrial sector or mill (e.g., a electroplating plant17, wine-producing industry18, iron and steel industry19, and process industries20). Similarly, industrial wastewater discharge was commonly focused within a specific industrial process or mill21–23. With the rapid development of urbanization and industrialization, conflicts among and within multiple water users (e.g., industrial and agricultural sectors) were considered24. Wang et al.25 evaluated the water reallocation alternatives from agriculture to industry based on multi-attribute decision support model. Also, many methods were adopted for supporting decision making in IWRM, such as mathematical programming26, multi-attribute decision support models27, and system analysis methods18. For example, Lin et al.28 evaluated water resource management strategies in high-tech industries of Taiwan by multiple-criteria decision analysis (MCDA). In terms of water allocation for multiple sectors, optimizing methods were adopted to identify desired strategies29–31. For example, Mushtaq and Moghaddasi32 proposed an optimization model to maximize economic benefits under a number of water-related, technical and administrative constraints. Li et al.33 proposed an interval multi-objective programming model to support the long-term industrial water resources management in Binhai New Area, Tianjin, China. Concurrently, it is economically and technically infeasible to maintain zero discharge of industrial wastewater. A lot of studies focused on treatment technologies for industrial wastewater (e.g., Arivoli et al.34) and waste load allocation for industrial wastewater discharge (e.g., Qin et al.35).
As responses to social, economic, and environmental disturbances, the following multi-level uncertainties posed a major challenge to decision making in the IWRM systems36–38: (a) variations in water demands and supply, as well as wastewater discharge may perturb signal identification and assessment39, (b) many forecasting data in social, economic, and environmental programs would not truly reflect real situations40, 41, and (c) the implications of randomness of data and vagueness of expert’s judgments may also lead to unexpected events42–44. Hence, water managers should consider uncertain features of the IWRM systems and recover equilibrium among industrial, agricultural, and residential water users45–48. Also, water pollutants discharged by industrial sectors may exceed the predetermined control targets, posing a potential violation risk for sustainable development49. To address the uncertainties and variations in the IWRM systems, a number of approaches (e.g., inexact optimization techniques, sensitivity analysis, statistical approaches and fuzzy sets theory) were developed50–53. Monte Carlo simulation (MCS) was widely used in data uncertainty analysis54–57. Fuzzy sets theory was applied for implicating vagueness of subjective judgments58. For example, Ren et al.59 developed a stochastic linear fractional programming model for desirable industrial structure under different risk probabilities of water resources.
Also, two-stage stochastic programming (TSP) was widely proved to be an effective tool for water allocation under uncertain conditions50. Meanwhile, an incident (e.g., failure to meet total allowable target on wastewater discharge) may be generated by multiple uncertainties of the IWRM systems. To quantitatively and systematically explore the likelihood of the incident, violation risk analysis should be incorporated60, 61. Previously, risk-based decision-making has been advocated for water resources management62–64. Studies on risk analysis of IWRM systems can be classified into the following two categories: (a) assessing health risk caused by industrial wastewater discharge65–68, and (b) analyzing water shortage risk arising from industrial water consumption69, 70. However, violation risk of wastewater discharge caused by various and uncertain industrial activities was rarely considered by previous studies.
To improve the capabilities of conventional methodologies for supporting industrial water resources management (IWRM) in uncertain and risky conditions, an integrated approach will be developed based on the combination of uncertainty analysis, violation analysis, and optimization model. The methodology could effectively reflect and address equilibrium between industrial water supply and demand in consideration of economic development and environmental protection. In detail, the paper will focus on the following aspects: (i) analyzing uncertainties of water demands, economic benefits, and wastewater discharge of future industrial activities, (ii) assessing violation risk of wastewater discharge by multiple industries, and (iii) allocating water resources to multiple industries under uncertain and risky conditions. The method can (a) systematically reflect and address complexities of IWRM systems, (b) effectively facilitate reflections of multiple uncertainties and risks of the system and incorporate them into a general optimization framework, and (c) successfully manage robust actions for industrial productions in consideration of water supply capacity and wastewater discharge. The developed method will then be demonstrated in a water-stressed city (i.e., city of Dalian) in northeastern China.
Results and discussions
COD discharge in industrial activities
Organic pollution by wastewater discharge from industrial activity affects humans and ecosystems worldwide71. In China, wastewater control is carried out based on the total allowable limits of water pollutants [e.g., chemical oxygen demand (COD)]. In detail, reduction of COD discharge of Dalian City would be no less than 2.04 Mt in 2015 compared with the discharge amount in 2010, according to the 12th Five-Year Plan for environmental protection.
The amounts of COD discharges for manufacturing industrial products in 2020 are estimated based on the national statistics72. Thus, the data quality scores of can be described as (4.8, 3.5, 4.2, 2.6, 3.1, 0.8) within level V. The uncertainty features of COD discharges in 57 industrial products are described in Fig. 1.
Figure 1.
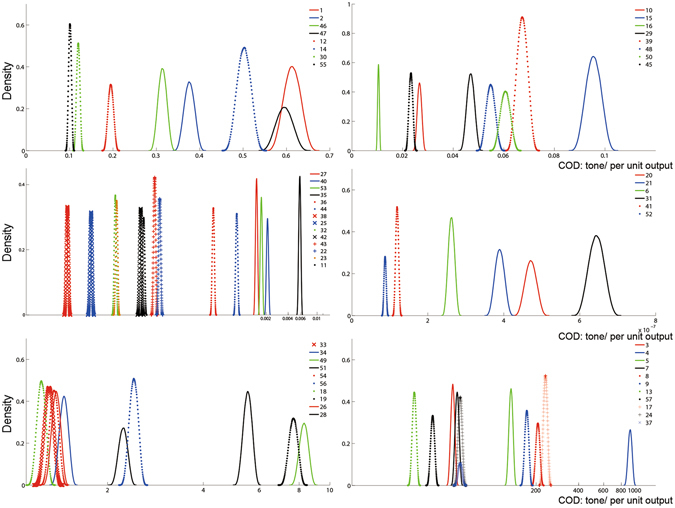
Uncertain feature of COD discharge in 57 industrial products of Dalian City. Based on the hybrid approach for data analysis, uncertain features of COD discharges in 57 industrial products of Dalian City can be described as probability density functions. Code numbers of products in the figure are listed in Table S3 of Supplementary Information.
Industrial water and wastewater management with discharge caps
There are multiple industrial plans in Dalian City (Table S5 of Supplementary Information). It is indicated that water resources could not fulfill all plans of industrial production. Thus, industrial plans have to be modified under the following three scenarios: (i) taking no account of the minimum growth rates for industries; (ii) considering development goals of top six industries in water-use efficiency perspective (i.e., garments, traditional Chinese medicines, rolling contact bearing, meta-cutting machines, rail vehicles, and civilian-used steel ships); and (iii) considering development goals of top six industries in economic benefit perspective (i.e., crude oil processed, rolling contact bearing, civilian-used steel ships, rail vehicles, light vehicles, and commercial vehicles). The final solutions contain the following three parts.
(1) Outputs of industrial products
In this study, five α-cut levels are proposed for solving fuzzy parameter (i.e., discharge cap of COD in the future [i.e., ]). The solutions for industrial production are shown in Table S13 of Supplementary Information. The outputs of civilian-used steel ships would decrease by more than 80% in at least three α-cut levels under the three scenarios. Meanwhile, the output of machine-made paper & paperboard would reduce more than 97% (Fig. 2). The output of metal shaping equipment would reduce less than 20% in at least one α-cut level. The details of the output strategies are described as the follows: a) under scenario 1, the outputs of seven types of industrial products (i.e., edible vegetable oil, fresh or chilled meat, compound floorboard, machine-made paper & paperboard, crude oil processed, civilian-used steel ships, and air conditioners) would reduce more than 80% in at least three α-cut levels; b) under scenario 2, the outputs of nine types of industrial products (i.e., salt, edible vegetable oil, machine-made paper & paperboard, crude oil processed, sodium carbonate, rolled steel, industrial boiler, civilian-used steel ships, and printers) would decrease by more than 80% in at least three α-cut levels; and c) under scenario 3, the outputs of three types of industrial products (i.e., fresh or chilled meat, rolled steel, and civilian-used steel ships) would decrease by more than 80% in at least three α-cut levels.
Figure 2.
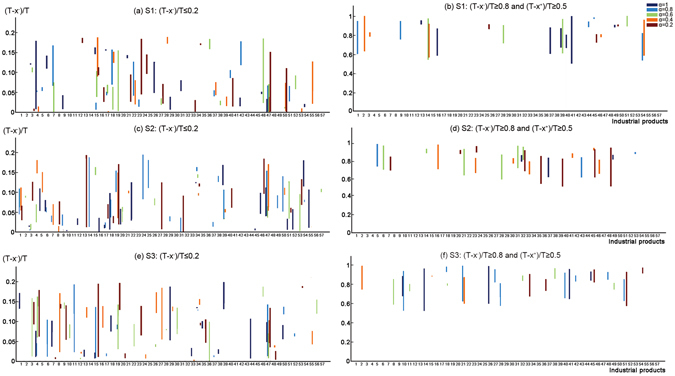
Output ratios of industrial products in 2020.
(2) Violation risks of wastewater discharge
Violation risk of COD discharge under scenario 1 would be more prominent than those under scenarios 2 and 3. Violation risk of COD discharge under scenario 3 would be more prominent than that under scenarios 2 in four α-cut levels. The results of violation risks are described as follows (Fig. 3): (a) the upper bounds of COD discharge for manufacturing industrial products would be the same as the maximum allowance limits under scenario 1; (b) the upper bounds of COD discharge for manufacturing industrial products would be less than the maximum allowance limits under scenario 2; and (c) the upper bounds of COD discharge for manufacturing industrial products would be less than the maximum allowance limits under scenario 3.
Figure 3.
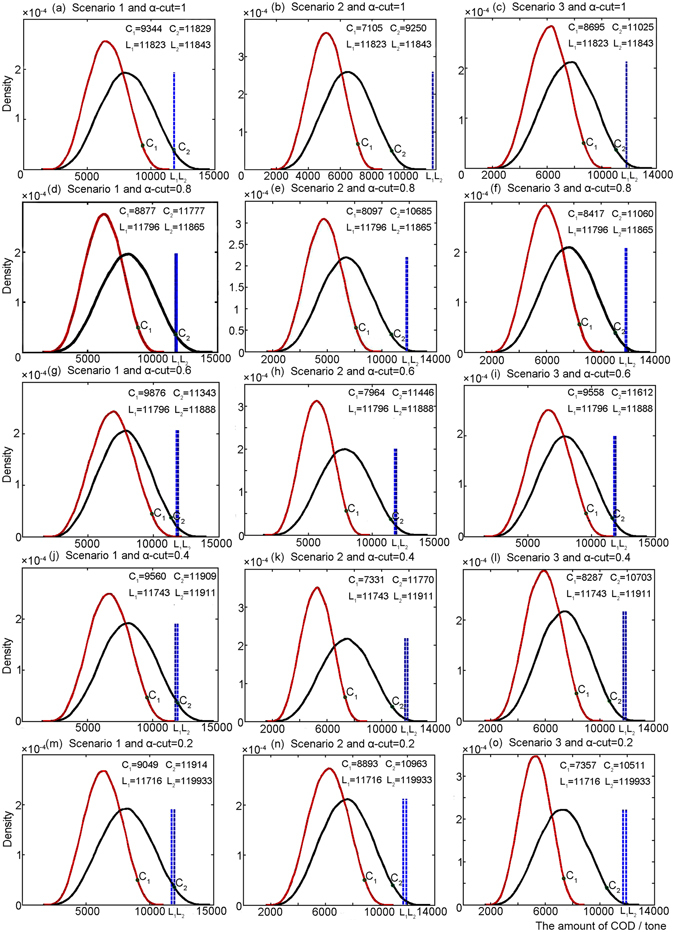
Violation risks of COD discharge in Scenarios 1 to 3. The parameters of C1 and C2 indicate probability of the incident (i.e., failure to meet total allowable target on wastewater discharge) would be 0.05. The parameters of L1 and L2 indicate the lower and upper bounds of discharge caps in COD.
(3) Planning adjustment
Under scenarios 2 and 3, multiple industrial products are chosen and modified (Fig. 4). Three types of industrial products (i.e., rolling contact bearing, rail vehicles, and civilian-used steel ships) are included in both scenarios. Generally, the total economic benefit under scenario 2 would be higher than that under scenario 3. Under scenario 2, manufacturing rolling contact bearing and rail vehicles would be promoted; conversely, manufacturing traditional Chinese medicines and civilian-used steel ships would not be encouraged. Under scenario 3, manufacturing rolling contact bearing and commercial vehicles would be promoted; conversely, manufacturing crude oil processed would not be encouraged.
Figure 4.
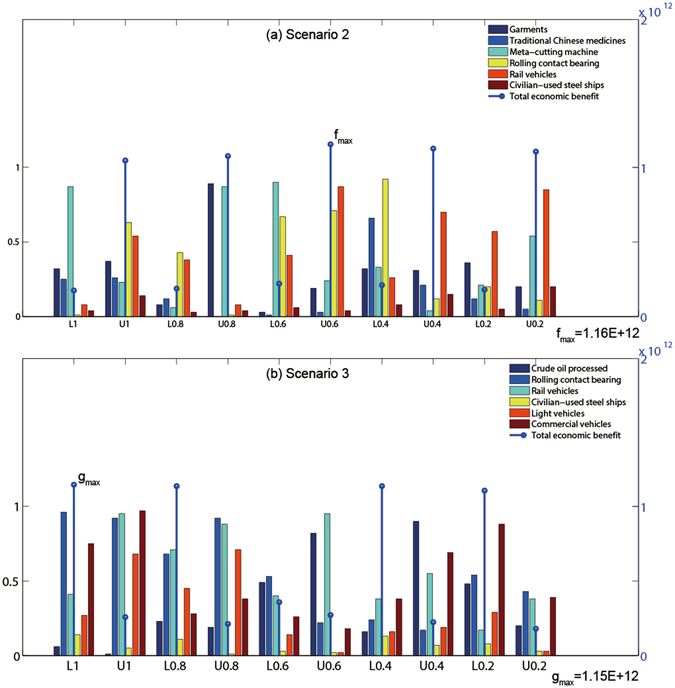
Planning modifications in scenarios 1 and 2. The letter of “L” represents the lower bound of interval numbers. The letter of “U” represents the upper bound of interval numbers. The numbers after the letters “L” and “U” are the multiple α-cut levels.
Conclusions
In this research, traditional methods for industrial water resources management (IWRM) were improved through the integration of operational research, uncertainty analysis, and violation risk analysis methods. This improved conventional industrial water resources management in (a) systematically reflecting multiple uncertain and risky features of IWRM systems, (b) adequately incorporating the features into industrial water and wastewater management, and (c) adequately managing robust actions for industrial productions in consideration of water supply capacity and wastewater discharge caps. This represented an improvement upon conventional methods for water resources management and violation risk analysis. The developed method was then demonstrated in Dalian. The following three scenarios were proposed according to different emphases in industrial development: (i) taking no account of the minimum growth rates for industries; (ii) considering development goals of top six industries in water-use efficiency perspective; and (iii) considering development goals of top six industries in economic benefit perspective. The results indicated that in the planning year (i.e., 2020) (a) the production of civilian-used steel ships and machine-made paper & paperboard would reduce significantly; (b) violation risk of COD discharge under scenario 1 would be the most prominent, compared with scenarios 2 and 3; and (c) the production of rolling contact bearing, rail vehicles, and commercial vehicles would be promoted.
Methods
It is a challenge for IWRM systems to realize conflicting goals on both economic benefits and wastewater discharges within multi-level uncertain conditions (Fig. 5)73. The multi-level complexities and uncertainties can be summarized as follows: (a) variations of water demands and supply, as well as wastewater discharge in the IWRM systems, (b) complexities of relationships between water demands and economic benefits of industries, (c) uncertainties of wastewater loadings among industries, and (d) likelihood that violation events occur.
Figure 5.
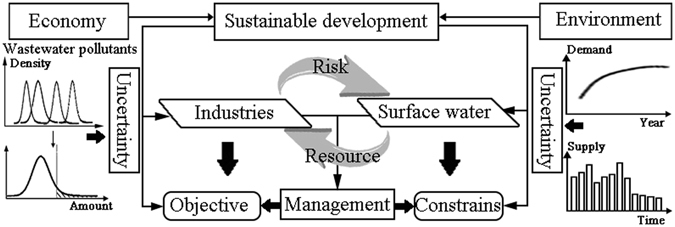
Industrial water and wastewater management under uncertain environmental-economic conditions.
In this study, the following four parts were incorporated into IWRM (Fig. 6): (a) making preliminary plans for water allocations in the 1st-stage decision making, which contains water demand, wastewater discharge and economic benefit analyses, (b) analyzing data uncertainty in IWRM systems, and violation risks of wastewater discharge, (c) equilibrating water supply and demand, and adjusting the plans for the 2nd- stage decision making, and (d) formulating an optimization model (i.e., fuzzy inexact two-stage programming), with consideration of economic benefits, water demands, and pollutant reductions in the IWRM systems.
Figure 6.
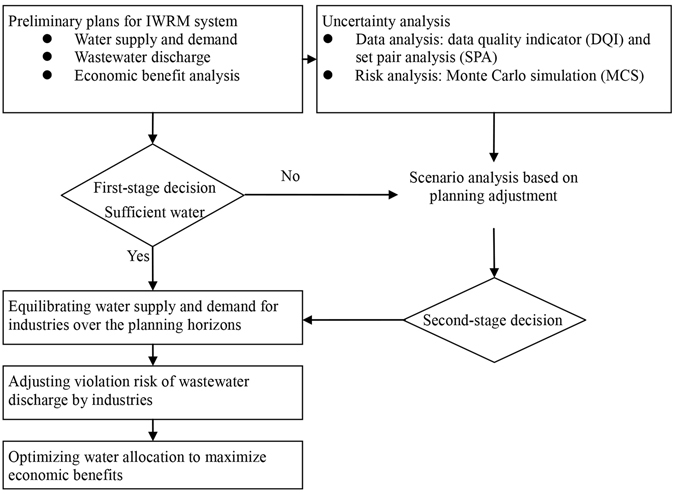
Industrial water resources management framework.
Uncertainty analysis
Uncertainty analysis is composed by the following two methods: (a) a hybrid approach of data quality scores and fuzzy set pair analysis for analyzing parameter variations in the IWRM systems (e.g., water demands, wastewater discharge, and economic benefits); and (b) violation risk analysis based on Monte Carlo simulation for evaluating the likelihood of the incident (i.e., failure to meet wastewater discharge caps).
Data analysis
In this research, approaches of data quality score and fuzzy sets pair analyses are adopted for facilitating uncertainty analysis. Based on the previous study by Yue et al.74, data quality scores are used to assess data quality from multiple perspectives75 (see Section S1.1 of Supplementary Information). Concurrently, a number of indicators will outweigh others in affecting data variations within meta-data vectors76. Thus, fuzzy set pair analysis (FSAP) is proposed to facilitate multi-criteria assessment of data quality76. The relationship between data quality scores and data quality levels can be defined as the matrix H A-B in Equation 1:
| 1 |
where data quality scores are described into set A [i.e., ], according to data quality pedigree matrix in Table S1 of Supplementary Information; levels of data quality are describe in set B [i.e., ]; H A-B is a set pair formed by sets A and B. In terms of the relationship between sets A and B, the connection degree of can be defined by the following equation77, 78:
| 2 |
where is the connection degrees of data quality scores (i.e., set A) and a certain level of data quality (i.e., ); and are the uncertain coefficients between the ranges of 0 to 1, reflecting discrepancy degrees of set A and B; J is the contrary degree coefficient and specified as −1; N denotes the total number of element of matrix H A−B; is the number of elements same with b j in ; is the number of elements same with b j + 1 in ; is the number of elements same with b j + 2 in ; is the number of elements that are more than b j + 2 in (Fig. 7).
Figure 7.
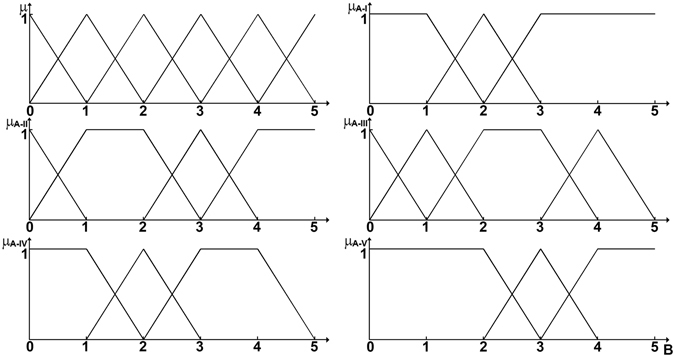
Levels of DQI (Set ).
Equations 1 and 2 can make quantitative comparative analysis of attributes in identical, discrepancy and contrary aspects between data quality scores and data quality level79, 80. When and are assigned by the values between the range of 0 to1, they can reflect the proportion of certainty and uncertainty. The results of can describe connection degree between data quality scores and levels. The bigger index in D A−B (e.g., D A−III) means set A would be associated with the level (e.g., level III) in higher probability. Then, data uncertainty can be estimated by the following transformation matrix (Table 1).
Table 1.
Transformation matrix.
| set B | Beta distribution function | |
|---|---|---|
| Shape parameters | Range endpoints (±r%) | |
| V | (5, 5) | 10 |
| IV | (3, 3) | 20 |
| III | (1, 1) | 30 |
| II | (1, 1) | 40 |
| I | (1, 1) | 50 |
Violation risk analysis
As wastewater discharge tend to be influenced by variation in densities and categories of industrial activities of the IWRM systems, the total amount of industrial wastewater may exceed the maximum allowable limit (i.e., violation of wastewater discharge). Depending on what is known and not known, violation risk of wastewater discharge can be analyzed based on uncertainty bounds which exceed classical deterministic margins80–83. To accommodate this kind of uncertainty, there are two main techniques, i.e., probability and possibility theories for cognitive uncertainties44. In this paper, based on the data analysis, the amount of COD discharge by a certain industry in future year could be estimated by random variables with beta distribution function, i.e., . Thus, total amount of COD discharge can be described by Equation 3:
| 3 |
where is total amount of COD discharge; is amount of COD discharge by the j th industry per unit production; is the output of the j th industry. The violation risk can be described by the relationship between discharge amount and control target, [i.e., ] (Equations 4 and 5)84:
| 4 |
| 5 |
where and are the probability density functions of and ; α and β are distribution shape parameters; a and b are range endpoints based on the results in data analysis. Meanwhile, the probability density functions of and are applied by Monte Carlo simulation upon 50,000 iterations to analyze data ranges85.
Industrial water allocation with wastewater caps
Consider a problem in which a water manager is in charge of supplying water resources to industries for producing multiple products in a city (e.g., cars, garments, and furniture)86, 87. The industries want to expand their activities and need to know how much water they can obtain. The water manager can formulate the problem through maximizing the economic benefits of industrial products with consideration of economic benefits, water demands, and wastewater discharge in the IWRM systems. An inexact risk management optimization model is effective for water allocation in multiple users over time and uncertain parameters88. Thus, the problem can be described by the following equations:
| 6 |
s.t.
| 7 |
| 8 |
| 9 |
| 10 |
| 11 |
| 12 |
where f: Economic benefit of industrial production;
: Profit of per unit output for the industrial product;
: Preliminary plan of the industry in the first-stage decision making;
: Economic loss of the industry when 1 m3 water would not be delivered;: Shortage of output on the industrial product in the second-stage decision making;
: Water supply capacity of the l th water source;
: Water-use quota for the industrial product;
: Amount of water for agricultural crop;
: Amount of water for social user (e.g., residents, schools, and hospitals);
q l: total amount of seasonal flow (m3) of the l th river;
: Minimum growth rate for the product in the industrial plan;
: The output of the product in the base year;
: Annual economic growth rate of the city;
N: Number of years between the planning year and base year;
: Output of the industrial product in the base year;
: Profit of per unit output for the industrial product in the base year.
Electronic supplementary material
Acknowledgements
This work was supported by the National Key Research Program of China (No. 2016YFC0502806 and 2016YFC0502802), the National Natural Science Foundation of China (No. 51421065 and 51661125010), and the Social Science Project of Zhejiang Province (12JCJJ10YB). The authors much appreciate the editor and the anonymous reviewers for their constructive comments and suggestions which are extremely helpful for improving the paper.
Author Contributions
The work presented here was carried out in collaboration among all authors. YUE W.C., CAI Y.P., and YANG Z.F. explored the operational research, uncertainty analysis, and violation risk analysis methods. YUE W.C., XU L.Y., YIN X.A., and SU M.R. provided the case study for demonstrating the methods. All authors have contributed to the paper preparation, have seen and approved the manuscript.
Competing Interests
The authors declare that they have no competing interests.
Footnotes
Electronic supplementary material
Supplementary information accompanies this paper at doi:10.1038/s41598-017-04508-9
Publisher's note: Springer Nature remains neutral with regard to jurisdictional claims in published maps and institutional affiliations.
Contributor Information
Yanpeng Cai, Email: yanpeng.cai@bnu.edu.cn.
Zhifeng Yang, Email: zfyang@bnu.edu.cn.
References
- 1.Hoekstra AY, Mekonnen MM. The water footprint of humanity. Proceedings of the National Academy of Sciences of the United States of America. 2012;109:3232–3237. doi: 10.1073/pnas.1109936109. [DOI] [PMC free article] [PubMed] [Google Scholar]
- 2.Dalin C, Konar M, Hanasaki N, Rinaldo A, Rodriguez-Iturbe I. Evolution of the global virtual water trade network. Proceedings of the National Academy of Sciences of the United States of America. 2012;109:5989–5994. doi: 10.1073/pnas.1203176109. [DOI] [PMC free article] [PubMed] [Google Scholar]
- 3.Kummu M, et al. The world’s road to water scarcity: shortage and stress in the 20th century and pathways towards sustainability. Scientific Reports. 2016;6:38495. doi: 10.1038/srep38495. [DOI] [PMC free article] [PubMed] [Google Scholar]
- 4.Ludwig F, van Slobbe E, Cofino W. Climate change adaptation and Integrated Water Resource Management in the water sector. Journal of Hydrology. 2014;518:235–242. doi: 10.1016/j.jhydrol.2013.08.010. [DOI] [Google Scholar]
- 5.National Bureau of Statistics & Ministry of Environmental Protection. China statistical yearbook on environment. 11–34 (China Statistics Press, 2014).
- 6.Ercin AE, Hoekstra AY. Water footprint scenarios for 2050: A global analysis. Environment International. 2014;64:71–82. doi: 10.1016/j.envint.2013.11.019. [DOI] [PubMed] [Google Scholar]
- 7.Schewe J, et al. Multimodel assessment of water scarcity under climate change. Proceedings of the National Academy of Sciences of the United States of America. 2014;111:3245–3250. doi: 10.1073/pnas.1222460110. [DOI] [PMC free article] [PubMed] [Google Scholar]
- 8.Kuang W, Liu J, Dong J, Chi W, Zhang C. The rapid and massive urban and industrial land expansions in China between 1990 and 2010: A CLUD-based analysis of their trajectories, patterns, and drivers. Landscape and Urban Planning. 2016;145:21–33. doi: 10.1016/j.landurbplan.2015.10.001. [DOI] [Google Scholar]
- 9.Kalteh AM, Hiorth P, Bemdtsson R. Review of the self-organizing map (SOM) approach in water resources: Analysis, modelling and application. Environmental Modelling & Software. 2008;23:835–845. doi: 10.1016/j.envsoft.2007.10.001. [DOI] [Google Scholar]
- 10.United Nations Development Programme. Human Development Report 2006. Beyond Scarcity: Power, Poverty, and the Global Water Crisis. (UNDP, 2006).
- 11.Wu J. Urban ecology and sustainability: The state-of-the-science and future directions. Landscape and Urban Planning. 2014;125:209–221. doi: 10.1016/j.landurbplan.2014.01.018. [DOI] [Google Scholar]
- 12.Wu J, Xiang WN, Zhao J. Urban ecology in China: Historical developments and future directions. Landscape and Urban Planning. 2014;125:222–233. doi: 10.1016/j.landurbplan.2014.01.018. [DOI] [Google Scholar]
- 13.Welsh WD, et al. An integrated modelling framework for regulated river systems. Environmental Modelling & Software. 2013;39:81–102. doi: 10.1016/j.envsoft.2012.02.022. [DOI] [Google Scholar]
- 14.Matrosov ES, Padula S, Harou JJ. Selecting portfolios of water supply and demand management strategies under uncertainty-contrasting economic optimisation and ‘robust decision making’ approaches. Water Resources Management. 2013;27:1123–1148. doi: 10.1007/s11269-012-0118-x. [DOI] [Google Scholar]
- 15.Zarghami M, Safari N, Szidarovszky F, Islam S. Nonlinear interval parameter programming combined with cooperative games: a tool for addressing uncertainty in water allocation using water diplomacy framework. Water Resources Management. 2015;29:4285–4303. doi: 10.1007/s11269-015-1060-5. [DOI] [Google Scholar]
- 16.Ene SA, Teodosiu C, Robu B, Volf I. Water footprint assessment in the winemaking industry: a case study for a Romanian medium size production plant. Journal of Cleaner Production. 2013;43:122–135. doi: 10.1016/j.jclepro.2012.11.051. [DOI] [Google Scholar]
- 17.Zhou Q, Lou HH, Huang YL. Design of a switchable water allocation network based on process dynamics. Industrial & Engineering Chemistry Research. 2001;40:4866–4873. doi: 10.1021/ie010304+. [DOI] [Google Scholar]
- 18.Castex V, Moran Tejeda E, Beniston M. Water availability, use and governance in the wine producing region of Mendoza, Argentina. Environmental Science & Policy. 2015;48:1–8. doi: 10.1016/j.envsci.2014.12.008. [DOI] [Google Scholar]
- 19.Gu Y, et al. Calculation of water footprint of the iron and steel industry: a case study in Eastern China. Journal of Cleaner Production. 2015;92:274–281. doi: 10.1016/j.jclepro.2014.12.094. [DOI] [Google Scholar]
- 20.Bandyopadhyay S, Cormos CC. Water management in process industries incorporating regeneration and recycle through a single treatment unit. Industrial & Engineering Chemistry Research. 2008;47:1111–1119. doi: 10.1021/ie0712232. [DOI] [Google Scholar]
- 21.Ochando-Pulido JM, Rodriguez-Vives S, Hodaifa G, Martinez-Ferez A. Impacts of operating conditions on reverse osmosis performance of pretreated olive mill wastewater. Water Research. 2012;46:4621–4632. doi: 10.1016/j.watres.2012.06.026. [DOI] [PubMed] [Google Scholar]
- 22.Cai L, Wu Y, Wu Y, Yamauti S, Saito N. Highly efficient treatment of industrial wastewater by solution plasma with low environmental load. Water Science and Technology. 2013;68:923–928. doi: 10.2166/wst.2013.321. [DOI] [PubMed] [Google Scholar]
- 23.Wimmer F, et al. Modelling the effects of cross-sectoral water allocation schemes in Europe. Climatic Change. 2015;128:229–244. doi: 10.1007/s10584-014-1161-9. [DOI] [Google Scholar]
- 24.Divakar L, Babel MS, Perret SR, Das Gupta A. Optimal allocation of bulk water supplies to competing use sectors based on economic criterion - An application to the Chao Phraya River Basin, Thailand. Journal of Hydrology. 2011;401:22–35. doi: 10.1016/j.jhydrol.2011.02.003. [DOI] [Google Scholar]
- 25.Wang X, Yang H, Shi M, Zhou D, Zhang Z. Managing stakeholders’ conflicts for water reallocation from agriculture to industry in the Heihe River Basin in Northwest China. Science of the Total Environment. 2015;505:823–832. doi: 10.1016/j.scitotenv.2014.10.063. [DOI] [PubMed] [Google Scholar]
- 26.Zhang Q, Feng X, Chu KH. Evolutionary graphical approach for simultaneous targeting and design of resource conservation networks with multiple contaminants. Industrial & Engineering Chemistry Research. 2013;52:1309–1321. doi: 10.1021/ie300507q. [DOI] [Google Scholar]
- 27.Reiter G, Lindorfer J. Global warming potential of hydrogen and methane production from renewable electricity via power-to-gas technology. International Journal of Life Cycle Assessment. 2015;20:477–489. doi: 10.1007/s11367-015-0848-0. [DOI] [Google Scholar]
- 28.Lin WS, Lee M, Huang YC, Den W. Identifying water recycling strategy using multivariate statistical analysis for high-tech industries in Taiwan. Resources Conservation and Recycling. 2015;94:35–42. doi: 10.1016/j.resconrec.2014.11.007. [DOI] [Google Scholar]
- 29.Kumaraprasad G, Muthukumar K. Design of mass exchange network and effluent distribution system for effective water management. Journal of Cleaner Production. 2009;17:1580–1593. doi: 10.1016/j.jclepro.2009.07.002. [DOI] [Google Scholar]
- 30.Guelli Ulson de Souza SM, Xavier MF, da Silva A, Ulson de Souza AA. Water reuse and wastewater minimization in chemical industries using differentiated regeneration of contaminants. Industrial & Engineering Chemistry Research. 2011;50:7428–7436. doi: 10.1021/ie200305z. [DOI] [Google Scholar]
- 31.Chaturvedi ND, Bandyopadhyay S. Simultaneously targeting for the minimum water requirement and the maximum production in a batch process. Journal of Cleaner Production. 2014;77:105–115. doi: 10.1016/j.jclepro.2013.11.079. [DOI] [Google Scholar]
- 32.Mushtaq S, Moghaddasi M. Evaluating the potentials of deficit irrigation as an adaptive response to climate change and environmental demand. Environmental Science & Policy. 2011;14:1139–1150. doi: 10.1016/j.envsci.2011.07.007. [DOI] [Google Scholar]
- 33.Li Y, et al. An inexact multi-objective programming model for water resources management in industrial parks of Binhai New Area, China. Water science and technology: a journal of the International Association on Water Pollution Research. 2015;72:1879–1888. doi: 10.2166/wst.2015.413. [DOI] [PubMed] [Google Scholar]
- 34.Arivoli A, Mohanraj R, Seenivasan R. Application of vertical flow constructed wetland in treatment of heavy metals from pulp and paper industry wastewater. Environmental Science and Pollution Research. 2015;22:13336–13343. doi: 10.1007/s11356-015-4594-4. [DOI] [PubMed] [Google Scholar]
- 35.Qin XS, Huang GH, Chen B, Zhang BY. An interval-parameter waste-load-allocation model for river water quality management under uncertainty. Environmental Management. 2009;43:999–1012. doi: 10.1007/s00267-009-9278-8. [DOI] [PubMed] [Google Scholar]
- 36.Varouchakis EA, Palogos I, Karatzas GP. Application of Bayesian and cost benefit risk analysis in water resources management. Journal of Hydrology. 2016;534:390–396. doi: 10.1016/j.jhydrol.2016.01.007. [DOI] [Google Scholar]
- 37.Cai, Y., Huang, G., Yang, Z. & Tan, Q. Identification of optimal strategies for energy management systems planning under multiple uncertainties. Applied Energy86, 480–495 (2009).
- 38.Cai, Y., Huang, G., Yang, Z. & Lin, Q. Community-scale renewable energy systems planning under uncertainty-An interval chance-constrained programming approach. Renewable & Sustainable Energy Reviews13, 721–735 (2009).
- 39.Vanderhaegen, F., Polet, P. & Zieba, S. A reinforced iterative formalism to learn from human errors and uncertainty. Engineering Applications of Artificial Intelligence22, 654–659 (2009).
- 40.Singh A. Land and water management planning for increasing farm income in irrigated dry areas. Land Use Policy. 2015;42:244–250. doi: 10.1016/j.landusepol.2014.08.006. [DOI] [Google Scholar]
- 41.Poff NL, et al. Sustainable water management under future uncertainty with eco-engineering decision scaling. Nature Climate Change. 2016;6:25–34. doi: 10.1038/nclimate2765. [DOI] [Google Scholar]
- 42.Zhang Z, Polet P, Vanderhaegen F, Millot P. Artificial neural network for violation analysis. Reliability Engineering & System Safety. 2004;84:3–18. doi: 10.1016/j.ress.2003.07.001. [DOI] [Google Scholar]
- 43.Simonovic SP. A new method for spatial and temporal analysis of risk in water resources management. Journal of Hydroinformatics. 2009;11:320–329. doi: 10.2166/hydro.2009.018. [DOI] [Google Scholar]
- 44.Baudrit C, Dubois D, Perrot N. Representing parametric probabilistic models tainted with imprecision. Fuzzy Sets and Systems. 2008;159:1913–1928. doi: 10.1016/j.fss.2008.02.013. [DOI] [Google Scholar]
- 45.Meng Q, et al. Designing a new cropping system for high productivity and sustainable water usage under climate change. Scientific Reports. 2017;7:41587. doi: 10.1038/srep41587. [DOI] [PMC free article] [PubMed] [Google Scholar]
- 46.Sun S, et al. Alleviating pressure on water resources: A new approach could be attempted. Scientific Reports. 2015;5:14006. doi: 10.1038/srep14006. [DOI] [PMC free article] [PubMed] [Google Scholar]
- 47.Cai, Y., Huang, G. Tan, Q., & Chen, B. Identification of optimal strategies for improving eco-resilience to floods in ecologically vulnerable regions of a wetland. Ecological Modelling222, 360–369 (2010).
- 48.Tan, Q., Huang, G. & Cai, Y. Radial interval chance-constrained programming for agricultural non-point source water pollution control under uncertainty. Agricultural Water Management98, 1595–1606 (2011).
- 49.Mitchell B. Use of the most likely failure point method for risk estimation and risk uncertainty analysis. Journal of Hazardous Materials. 2002;91:1–24. doi: 10.1016/S0304-3894(01)00378-8. [DOI] [PubMed] [Google Scholar]
- 50.Liu W, Wang S, Zhang L, Ni Z. Water pollution characteristics of Dianchi Lake and the course of protection and pollution management. Environmental Earth Sciences. 2015;74:3767–3780. doi: 10.1007/s12665-015-4152-x. [DOI] [Google Scholar]
- 51.Wang S, Huang GH. A multi-level Taguchi-factorial two-stage stochastic programming approach for characterization of parameter uncertainties and their interactions: An application to water resources management. European Journal of Operational Research. 2015;240:572–581. doi: 10.1016/j.ejor.2014.07.011. [DOI] [Google Scholar]
- 52.Carrasco IJ, Chang SY. Random Monte Carlo simulation analysis and risk assessment for ammonia concentrations in wastewater effluent disposal. Stochastic Environmental Research and Risk Assessment. 2005;19:134–145. doi: 10.1007/s00477-004-0221-5. [DOI] [Google Scholar]
- 53.Ghosh S, Mujumdar PP. Fuzzy waste load allocation model: A multiobjective approach. Journal of Hydroinformatics. 2010;12:83–96. doi: 10.2166/hydro.2010.028. [DOI] [Google Scholar]
- 54.Tan RR, Culaba AB, Purvis MRI. Application of possibility theory in the life-cycle inventory assessment of biofuels. International Journal of Energy Research. 2002;26:737–745. doi: 10.1002/er.812. [DOI] [Google Scholar]
- 55.May JR, Brennan DJ. Application of data quality assessment methods to an LCA of electricity generation. The International Journal of Life Cycle Assessment. 2003;8:215. doi: 10.1007/BF02978474. [DOI] [Google Scholar]
- 56.Tan RR. Using fuzzy numbers to propagate uncertainty in matrix-based LCI. The International Journal of Life Cycle Assessment. 2008;13:585. doi: 10.1007/s11367-008-0032-x. [DOI] [Google Scholar]
- 57.Chen L, Han Z, Wang G, Shen Z. Uncertainty analysis for an effluent trading system in a typical nonpoint-sources-polluted watershed. Scientific Reports. 2016;6:1–12. doi: 10.1038/s41598-016-0001-8. [DOI] [PMC free article] [PubMed] [Google Scholar]
- 58.Dubois D, Prade H. The legacy of 50 years of fuzzy sets: A discussion. Fuzzy Sets and Systems. 2015;281:21–31. doi: 10.1016/j.fss.2015.09.004. [DOI] [Google Scholar]
- 59.Ren CF, Guo P, Li M, Gu JJ. Optimization of industrial structure considering the uncertainty of water resources. Water Resources Management. 2013;27:3885–3898. doi: 10.1007/s11269-013-0385-1. [DOI] [Google Scholar]
- 60.Yao H, Qian X, Yin H, Gao H, Wang Y. Regional risk assessment for point source pollution based on a water quality model of the Taipu River, China. Risk Analysis. 2015;35:265–277. doi: 10.1111/risa.12259. [DOI] [PubMed] [Google Scholar]
- 61.Bach PM, Staalesen S, McCarthy DT, Deletic A. Revisiting land use classification and spatial aggregation for modelling integrated urban water systems. Landscape and Urban Planning. 2015;143:43–55. doi: 10.1016/j.landurbplan.2015.05.012. [DOI] [Google Scholar]
- 62.Su HT, Tung YK. Comparisons of risk-based decision rules for the application of water resources planning and management. Water Resources Management. 2014;28:3921–3935. doi: 10.1007/s11269-014-0718-8. [DOI] [Google Scholar]
- 63.Cai, Y., Huang, G., Yang, Z., Sun, W. & Chen, B. Investigation of public’s perception towards rural sustainable development based on a two-level expert system. Expert Systems with Applications36, 8910–8924 (2009).
- 64.Hu, Q., Huang, G., Cai, Y. P. & Sun, W. Planning of Electric Power Generation Systems under Multiple Uncertainties and Constraint-Violation Levels. Journal of Environmental Informatics23, 55–64 (2014).
- 65.Hou D, Ge X, Huang P, Zhang G, Loaiciga H. A real-time, dynamic early-warning model based on uncertainty analysis and risk assessment for sudden water pollution accidents. Environmental Science and Pollution Research. 2014;21:8878–8892. doi: 10.1007/s11356-014-2936-2. [DOI] [PubMed] [Google Scholar]
- 66.Krishna AK, Mohan KR. Risk assessment of heavy metals and their source distribution in waters of a contaminated industrial site. Environmental Science and Pollution Research. 2014;21:3653–3669. doi: 10.1007/s11356-013-2359-5. [DOI] [PubMed] [Google Scholar]
- 67.Clark B, Masters S, Edwards M. Profile sampling to characterize particulate lead risks in potable water. Environmental Science & Technology. 2014;48:6836–6843. doi: 10.1021/es501342j. [DOI] [PubMed] [Google Scholar]
- 68.Spisso A, Pacheco PH, Gomez FJ, Fernanda Silva M, Martinez LD. Risk Assessment on Irrigation of Vitis vinifera L. cv Malbec with Hg Contaminated Waters. Environmental Science & Technology. 2013;47:6606–6613. doi: 10.1021/es3047476. [DOI] [PubMed] [Google Scholar]
- 69.Berger M, van der Ent R, Eisner S, Bach V, Finkbeiner M. Water Accounting and Vulnerability Evaluation (WAVE): Considering atmospheric evaporation recycling and the risk of freshwater depletion in water footprinting. Environmental Science & Technology. 2014;48:4521–4528. doi: 10.1021/es404994t. [DOI] [PubMed] [Google Scholar]
- 70.Gunasekara NK, Kazama S, Yamazaki D, Oki T. Water conflict risk due to water resource availability and unequal distribution. Water Resources Management. 2014;28:169–184. doi: 10.1007/s11269-013-0478-x. [DOI] [Google Scholar]
- 71.Wen Y, Schoups G, van de Giesen N. Organic pollution of rivers: Combined threats of urbanization, livestock farming and global climate change. Scientific Reports. 2017;7:43289. doi: 10.1038/srep43289. [DOI] [PMC free article] [PubMed] [Google Scholar]
- 72.National Bureau of Statistics & Ministry of Environmental Protection. China statistical yearbook on environment. 11–34 (China Statistics Press, 2013).
- 73.Cai, Y., Huang, G., Tan, Q. & Liu, L. An integrated approach for climate-change impact analysis and adaptation planning under multi-level uncertainties. Part I: Methodology. Renewable & Sustainable Energy Reviews15, 2779–2790 (2011).
- 74.Yue W, Cai Y, Xu L, Tan Q, Yin XA. Adaptation strategies for mitigating agricultural GHG emissions under dual-level uncertainties with the consideration of global warming impacts. Stochastic Environmental Research and Risk Assessment. 2017;31:961–979. doi: 10.1007/s00477-016-1244-4. [DOI] [Google Scholar]
- 75.Ocampo-Duque W, Osorio C, Piamba C, Schuhmacher M, Domingo JL. Water quality analysis in rivers with non-parametric probability distributions and fuzzy inference systems: Application to the Cauca River, Colombia. Environment International. 2013;52:17–28. doi: 10.1016/j.envint.2012.11.007. [DOI] [PubMed] [Google Scholar]
- 76.Wang E, et al. An AHP-weighted aggregated data quality indicator (AWADQI) approach for estimating embodied energy of building materials. International Journal of Life Cycle Assessment. 2012;17:764–773. doi: 10.1007/s11367-012-0417-8. [DOI] [Google Scholar]
- 77.Zou Q, Zhou JZ, Zhou C, Song LX, Guo J. Comprehensive flood risk assessment based on set pair analysis-variable fuzzy sets model and fuzzy AHP. Stochastic Environmental Research and Risk Assessment. 2013;27:525–546. doi: 10.1007/s00477-012-0598-5. [DOI] [Google Scholar]
- 78.Yue WC, Cai YP, Rong QQ, Li CH, Ren LJ. A hybrid life-cycle and fuzzy-set-pair analyses approach for comprehensively evaluating impacts of industrial wastewater under uncertainty. Journal of Cleaner Production. 2014;80:57–68. doi: 10.1016/j.jclepro.2014.05.097. [DOI] [Google Scholar]
- 79.Zhao, K. Q. Set pair analysis and its preliminary application. 20–21 (Hangzhou Science and Technology Press, 2000).
- 80.Jin JL, et al. Forewarning of sustainable utilization of regional water resources: a model based on BP neural network and set pair analysis. Natural Hazards. 2012;62:115–127. doi: 10.1007/s11069-011-0037-9. [DOI] [Google Scholar]
- 81.Alzbutas R, Iesmantas T, Povilaitis M, Vitkute J. Risk and uncertainty analysis of gas pipeline failure and gas combustion consequence. Stochastic Environmental Research and Risk Assessment. 2014;28:1431–1446. doi: 10.1007/s00477-013-0845-4. [DOI] [Google Scholar]
- 82.Dong C, Huang GH, Tan Q. A robust optimization modelling approach for managing water and farmland use between anthropogenic modification and ecosystems protection under uncertainties. Ecological Engineering. 2015;76:95–109. doi: 10.1016/j.ecoleng.2014.04.003. [DOI] [Google Scholar]
- 83.Lagoa CM, Shcherbakov PS, Barmish BR. Probabilistic enhancement of classical robustness margins: The unirectangularity concept. Systems & Control Letters. 1998;35:31–43. doi: 10.1016/S0167-6911(98)00023-1. [DOI] [Google Scholar]
- 84.Sasikumar K, Mujumdar PP. Application of fuzzy probability in water quality management of a river system. International Journal of Systems Science. 2000;31:575–591. doi: 10.1080/002077200290894. [DOI] [Google Scholar]
- 85.Canter KG, Kennedy DJ, Montgomery DC, Keats JB, Carlyle WM. Screening stochastic life cycle assessment inventory models. International Journal of Life Cycle Assessment. 2002;7:18–26. doi: 10.1007/BF02978906. [DOI] [Google Scholar]
- 86.Huang G, Loucks D. An inexact two-stage stochastic programming model for water resources management under uncertainty. Civil Engineering Systems. 2000;17:95–118. doi: 10.1080/02630250008970277. [DOI] [Google Scholar]
- 87.Liu XM, Huang GH, Wang S, Fan YR. Water resources management under uncertainty: Factorial multi-stage stochastic program with chance constraints. Stochastic Environmental Research and Risk Assessment. 2016;30:945–957. doi: 10.1007/s00477-015-1143-0. [DOI] [Google Scholar]
- 88.Ji L, Niu DX, Xu M, Huang GH. An optimization model for regional micro-grid system management based on hybrid inexact stochastic-fuzzy chance-constrained programming. International Journal of Electrical Power & Energy Systems. 2015;64:1025–1039. doi: 10.1016/j.ijepes.2014.08.014. [DOI] [Google Scholar]
Associated Data
This section collects any data citations, data availability statements, or supplementary materials included in this article.