

Abstract
Current imaging techniques for the characterization of differentiated corneal limbal stem cells are destructive and cannot be used in eye bank for monitoring the regenerated epithelium in culture. We presented a minimally invasive, multimodal, marker-free imaging method for the investigation of epithelia regenerated with cultured human donor corneal limbal epithelial stem cells. Two-photon fluorescence and harmonic generation signals were collected from specimens in culture and used for evaluating the structure and morphology of epithelia cultured on two different bio-scaffolds; in addition, donor human corneal tissues were used as controls. The method provided reliable information on the organization of cellular and extracellular components of biomaterial substrates and was highly sensitive to determine differences between the density packing arrangement of epithelial cells of different biomaterials without relying on inferences from exogenous labels. The present minimally invasive standardized quality control methodology can be reliably translated to eye banks and used for monitoring harvested corneal limbal stem cells growth and differentiation in bioengineered materials.
Introduction
In stem cell research, there is a high demand on techniques for the minimally-invasive, marker-free observation of growth, proliferation, differentiation, and stability of living stem cells under near-physiological conditions1–6. The development and validation of reliable means for monitoring regenerated corneal epithelial cells using entirely endogenous sources of contrast would represent a significant challenge in efficiently controlling stem cell growth and differentiation in tissue engineering and stem cell therapy for eye care.
Limbal stem cells deficiency (LSCD) has been defined as the destruction or dysfunction of the stem cells containing limbal epithelium, leading to failure of corneal epithelial regeneration, accompanied by chronic inflammation, stromal scarring, neovascularization and persistent epithelial defects. The disease leads to visual loss due to severe corneal opacity and is associated with high risk of corneal graft failure from rejection exceeding 35% at three years7.
Current imaging techniques for the characterization of differentiated corneal limbal stem cells include immunocytochemistry, immunofluorescence microscopy and electron microscopy. The analyzed specimens, however, cannot be used for further operations due to the destructive effects of the examination procedures that require exogenous markers and cannot be used in eye bank for monitoring the regenerated epithelia during culture. The greatest advantages of two-photon optical microscopy over immunofluorescence and electron microscopy imaging include no requirements for fixation and dyes, molecular specificity, decreased out of focus photodamage, increased imaging depths and intrinsic optical sectioning, which ultimately provides the possibility of three-dimensional (3D) reconstruction of the anisotropic structural organization of tissues. The reliability of two-photon optical microscopy to image differentiated stem cells has been formerly shown by Uchugonova and König8.
In this study, we present a minimally-invasive approach based on two-photon optical microscopy for investigating the epithelia regenerated from human corneal epithelial limbal stem cells on different bio-scaffold substrates, such as the hemicornea and fibrin gel7, 9. The hemicornea is a human-derived bioscaffold and consists of a donor anterior corneal stromal lenticule; the fibrin gel is the golden standard for cultivating human limbal epithelial stem cells and treating patients with LSCD7, 9, 10. Data of regenerated epithelia and their substrates were compared with human donor eye bank corneoscleral tissues with intact epithelium and de-epithelialized anterior corneal stromal lenticules, which were used as controls.
Results
All specimens were imaged without the need of labelling. In the hemicornea, the regenerated epithelium resembled the normal architecture of the human cornea; the resulting epithelium was stratified into three to five cell layers, with basal cuboidal cells differentiating upward to wing cells. In all cases, the basal epithelial plane was firmly attached to the underlying Bowman’s layer; in 50% of specimens, it showed some digital invasions of the limbal basal epithelium in the palisades of Vogt (Fig. 1 and Supplementary Video 1)11. The sub-basal nerve plexus could be resolved in the hemicornea and consisted of a network of tiny fibers entering the basal epithelial layer (Fig. 2). The stromal keratocytes of hemicornea showed a dendritic-like morphology and formed a syncytium throughout the stromal depth (Fig. 3)12. High-resolution images of the hemicornea’s stroma were collected both in forward (F-SHG) and backward (B-SHG) directions. The collagen fibers of the hemicornea were regularly arranged and intertwined with each other, as found in the normal human cornea (Fig. 4).
Figure 1.
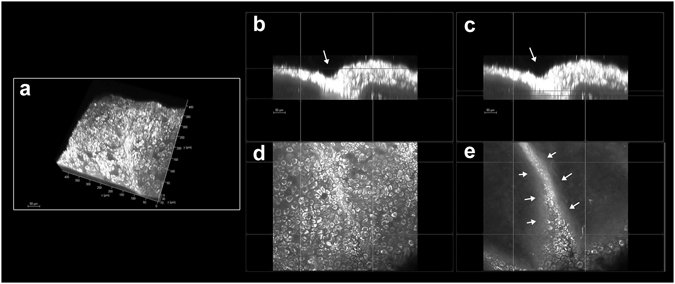
Pseudo-palisade of Vogt in the hemicornea. (a) Three-dimensional (3D) reconstruction of the hemicornea (TPEF signal) showing the pseudo-palisade of Vogt (scale bar 50 µm). Cross-sections (b and c; 400 × 60 µm) and enface (d and e; 400 × 400 µm) images of the hemicornea at different depths highlighting the intrastromal digital invasion by basal epithelial cells (arrows). This structure was randomly observed in scattered regions the hemicornea. The palisades of Vogt are distinctive features of the adult corneoscleral limbus and represent the specialized microenvironment (niche) of corneal stem cells.
Figure 2.

Basal nerve plexus in the hemicornea. (a) 3D reconstruction of the hemicornea (TPEF signal) showing the basal nerve plexus (scale bar 50 µm). (b) The nerve fiber bundles (arrows) run parallel to each other forming thin branches that penetrate into the basal epithelial plane. The corneal epithelium is one of the most highly innervated structures in the human body; proper innervation is necessary for maintenance of normal corneal functions. There is strong evidence from laboratory studies that the nerve fibers provide trophic support to the corneal epithelium.
Figure 3.
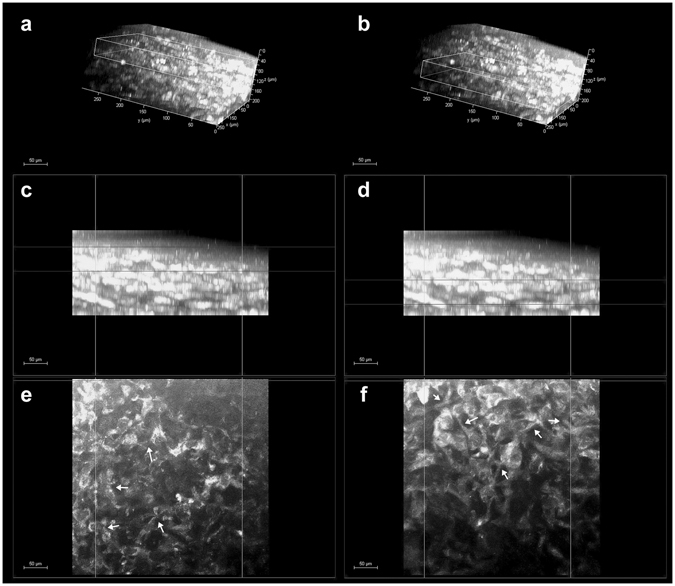
Corneal stroma keratocytes in the hemicornea. (a and b) 3D reconstruction of the hemicornea (TPEF signal) showing the stromal keratocytes at different depths (scale bar 50 µm). The white box in panel A encloses the anterior stroma ranging between 40 and 90 µm depth (c and e); the white box in panel b encloses the stroma ranging between 120 and 170 µm depth (d and f). The panels c, d and e, f show the cross-section and en face images of the hemicornea stroma respectively. The stromal keratocytes show a dendritic-like morphology with processes connecting the cells to each other forming cellular networks (syncytium; arrows).
Figure 4.

Organization of anterior stromal collagen fibers in the human cornea. (Upper row) 3D reconstruction of the anterior 250 µm stroma of the human cornea (forward SHG signal) showing the depth-dependent organization and arrangement of collagen fibers (scale bar 100 µm). Middle row) cross-section images of the corneal stroma; from the left to right, the boxes enclose regions of the stroma at varying depths, ranging from the most anterior stroma underlying the Bowman’s layer to 250 µm depth. (Lower row) corresponding enface images of the stroma. In the most anterior stroma (a), the collagen fibers are arranging in tiny and short bundles densely intertwined at different planes; they arrange in thin and densely packed lamellae intersecting each other across 100- and 150-µm depth (b, c and d); these lamellae become increasingly wider and thicker with increasing depth. From ≥200 µm depth, the collagen lamellae shows a grid-like structure, crossing each other at almost vertical angles (e and f).
The epithelial layer stratification and cell morphology in fibrin gel were significantly different from hemicornea. Inhomogeneous stratification and hyperproliferation of epithelial cells were observed in fibrin scaffolds; by visual inspection, the cells showed differences of shape and size across depth and were not firmly attached to each other, even at the basal layer (Fig. 5). No pseudo-palisades of Vogt were seen in any fibrin gel; no SHG emission spectra were recorded from fibrin scaffolds.
Figure 5.

Regenerated epithelium on fibrin gel. (Upper row) 3D reconstruction of the fibrin gel (TPEF signal) with cultivated limbal corneal epithelial cells (scale bar 100 µm). The white boxes highlight the characteristics of regenerated epithelium, which are shown in the middle (cross-section images) and lower (enface images) rows at different depths respectively. Middle rows) abnormal stratification of the regenerated epithelium was found in all specimens. (Lower rows) the cells show also variations in shape and size across depth and are not confluent even at the basal plane (arrows). Neither TPEF nor SHG signals could be collected from fibrin scaffolds.
The cell density was 4236 ± 760 cells/mm2, 2925 ± 643 cells/mm2 and 6806 ± 436 cells/mm2 for the basal epithelial layer of the hemicornea, fibrin gel and control corneal tissue respectively; the cell spacing was measured to be 12.8 ± 1.1 µm, 15.1 ± 1.8 µm and 9.6 ± 0.5 µm for the basal epithelial cells respectively. The density and spacing of cells were significantly different between the bio-scaffolds and the control corneal tissues (P < 0.001); differences between the two bio-scaffolds were also statistically significant (P < 0.01). The percentage of hexagonal Voronoi tiles at the basal epithelial layer was 41 ± 7%, 37 ± 10% and 48 ± 6% respectively. The differences between the fibrin gel and control corneal tissue approached statistical significance (P = 0.05).
The mean TPEF signal intensity of the basal epithelial layer was 118 ± 29 au, 52 ± 12 au and 112 ± 47 au for the hemicornea, fibrin gel and corneoscleral tissue respectively. The difference in the results was statistically significant between the hemicornea and fibrin gel (P < 0.001) and between the fibrin gel and control corneal tissue (P < 0.01). The mean TPEF signal intensity of the keratocytes lying in the most anterior stroma beneath the Bowman’s layer was 63 ± 10 au and 50 ± 12 au in the hemicornea and control corneal tissue (P = 0.14) respectively.
The high dispersion (i.e., low coherency values) of the collagen fiber orientation distribution was attributed to the highly intertwined arrangement of these fibers crossing each other at variable angles in the most anterior corneal stroma. The arrangement of collagen fibers in the hemicornea showed relatively higher coherency values than the anterior stromal lenticules that were used as controls; the average coherency values were 0.24 ± 0.04 and 0.21 ± 0.07 (P = 0.03) respectively. Backward SHG images provided similar information as forward SHG images in terms of orientation for the stromal collagen fibers with differences within 15 degrees up to 65 µm stromal depth in the hemicornea (mean Δγ = 4.4 ± 5.3 degrees) and control anterior stromal lenticule (mean Δγ = 4.0 ± 7.0 degrees) respectively. The forward to backward second harmonic generations ratio, F/B, showed comparable values between the hemicornea and control anterior stromal lenticules, except for the most anterior 20 µm depth (Fig. 6). The main results of this work were summarized in Table 1.
Figure 6.
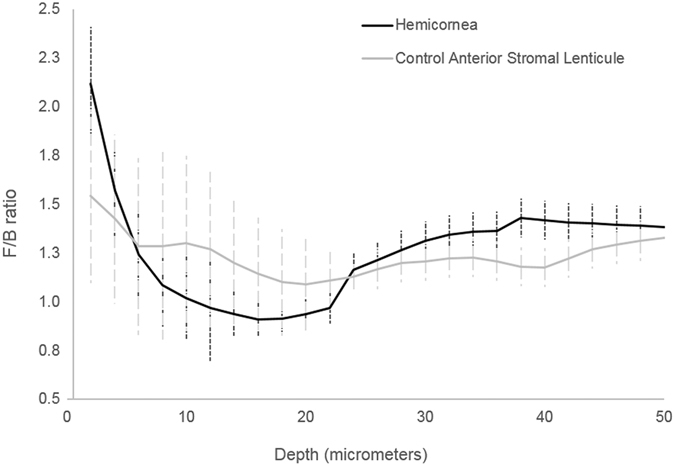
F/B ratio of the hemicornea and control anterior stromal lenticule. Averaged measured forward/backward SHG intensities as a function of depth (from the Bowman’s layer to 50 µm depth) for the hemicornea (black curve) and control anterior stromal lenticules (grey curve). The vertical lines represent ± SD.
Table 1.
Main results (mean ± SD) of the two-photon fluorescence (TPEF) and second harmonic generation (SHG) signals used for evaluating the hemicornea and fibrin gel in comparison with donor human corneal tissues.
| Corneal tissues (control; n = 3) | Anterior stromal lenticules (control; n = 3) | Hemicornea (n = 6) | Fibrin gel (n = 3) | |
|---|---|---|---|---|
| Epithelial cell density (cells/mm2) | 6806 ± 436*,# | N.A. | 4236 ± 760† | 2925 ± 643 |
| Epithelial cell spacing (µm) | 9.6 ± 0.5*,# | N.A. | 12.8 ± 1.1† | 15.1 ± 1.8 |
| Epithelial cell packing arrangement (% of 6n) | 48 ± 6# | N.A. | 41 ± 7 | 37 ± 10 |
| TPEF epithelium (a.u.) | 112 ± 47# | N.A. | 118 ± 29† | 52 ± 12 |
| TPEF stroma (a.u.) | 50 ± 12* | N.A. | 63 ± 10 | N.A. |
| Coherency | N.A. | 0.21 ± 0.07* | 0.24 ± 0.04 | N.A. |
| Δγ (degrees) | N.A. | 4.0 ± 7.0 | 4.4 ± 5.3 | N.A. |
6n: hexagonal Voronoi tiles.
N.A.: not applicable.
*P ≤ 0.05 between control and hemicornea.
#P ≤ 0.05 between control and fibrin gel.
†P ≤ 0.05 between hemicornea and fibrin gel.
Discussion
To the best of our knowledge, this is the first study reporting the feasibility and reliability of two-photon optical microscopy to investigate the epithelia regenerated by human corneal epithelial limbal stem cells on different biomaterials. The complementary collection of SHG and TPEF emission spectra was valuable to obtain marker-free, quantitative information on fresh regenerated epithelia of cultured human corneal limbal epithelial stem cells. The epithelial architecture of the hemicornea was almost comparable to the native human corneal tissue, though the preferred cell packing density arrangement of the basal layer showed values lower than controls. Data of control donor tissues were in fair accordance with previous in vivo study evaluating the corneal basal epithelial layer of adult subjects13, 14; using confocal corneal microscopy, the size and density of the basal epithelial cells in the peripheral cornea of living healthy subjects have been found to be 10.1 ± 0.8 µm and 7120 ± 362 cells/mm2 respectively13, 14. As far as we know, based on a thorough literature search, no data on cell density of the epithelia grown onto fibrin gels have been previously reported. Overall, the present method showed significant differences in the packing density arrangement of epithelia grown on different biomaterial substrates; it may be valuable to assess novel techniques of stem cell therapy, as they will become available.
High-resolution TPEF images of stromal keratocytes were collected from all hemicorneas; we were also able to resolve the anterior stromal nerve fibers, which have not been observed before in biomaterial substrates, entering the basal epithelial layer of the regenerated epithelium of hemicornea 15. Based on current knowledge, the stroma of hemicornea could represent an active matrix for supporting, through cell-to-cell communication, all the aspects of the overlying epithelial cells’ growth and differentiation15. Although the role of the mesenchyme in the initial establishment of the histo-architecture and its instructive influence on the developing overlying epithelial structures has been well established only during embryonic development15, 16, tissue-specific differentiation of the epithelial corneal phenotype could be probably determined by a combination of stroma-mediated mechanisms and intrinsic epithelial properties even in adult and post-mortem tissues.
Analysis of second harmonic generation signals was done in order to characterize the main structural corneal stroma components, i.e., the collagen fiber, and how their organization and arrangement vary through the thickness17, 18. The results were in accordance with previous studies showing the high dispersion of orientation distribution of collagen fibers through the anterior human corneal stroma19, 20. The complementary information provided by the two parameters, i.e. the preferred orientation of collagen fibers and the coherency value, which gives a measure of the degree of order of fibers aligned along this preferential direction, may be valuable for understanding the structural integrity of the most anterior stroma21, 22, which supports epithelial cells’ sliding movements and stratification. The present method provided information on the preferred orientation of stromal collagen fibers from the backward SHG images that were consistent with forward SHG images. This was verified both in the hemicornea and control anterior stromal lenticules. Based on these results, analysis of backward SHG images only may be valuable for monitoring the structure of the hemicornea stroma, because this will be the most likely configuration for the possible future diagnostic implementations of the technique.
Since collagen fibrils are the primary cause of scattering in corneal stroma, the structural differences in collagen organization and arrangement probably contributed to the F/B ratio differences in the most 20 µm anterior stroma between samples. Specifically, differences in the extrafibrillar spacing and collagen fibrils as well as in collagen fibers’ arrangement (as depicted by the statistically significant different coherency values between samples) could contribute to variable scattering between samples23–25. It could not be excluded that tissue manipulation during epithelial stem cell cultivation may have an influence in the structural differences of the most anterior stroma25.
The corneal stroma lenticules of hemicornea had 200 µm targeted depth and allowed us to collect more efficiently the SHG signal emitted in the backward direction. For collagenous specimens with thickness of λ/4 (λ is the excitation wavelength), whose molecular distribution possesses an axial periodicity in the vicinity of λ/4, up to 25% of the SHG power is radiated in backward directed23, 26. In addition, the radiated SHG power in the backward direction increases when the size of the scattering structure along the optical axis is much lower than λ and also because collagen fibrils in the corneal stroma are less aligned with respect to the optical axis26, 27. SHG microscopy can be also configured to extract more information on the collagen architecture and preferred organization throughout stromal depth through polarisation resolved methods21. It should be object of further investigation if this methodology could be used to detect the biosynthesis (fibrillogenesis) or remodelling of collagen in bio-engineered scaffolds1, 23, 28, 29.
Since the main scope of this work was to thoroughly identify and characterize the structure and morphology of cellular and extracellular components of the bio-scaffolds, we could not collect information on the metabolic information of the regenerated epithelia. On the other hand, the present methodology could be enhanced, through the careful selection of combinations of excitation wavelengths (e.g., 755 nm and 860 nm) and selective emission filters (e.g., 460 nm and 525 nm), to identify the intrinsic cellular fluorophores (e.g., NADH and FAD) and achieve metabolic information5, 6, 13, 30, 31. In addition, two-photon fluorescence lifetime imaging has been already shown to be valuable for real time monitoring of stem cell differentiation8. Collectively, both intensity-based and lifetime-based image analysis would make two-photon microscopy a powerful tool for quantitatively monitoring of epithelial stem cell differentiation during in vitro cultivation in order to optimize culture conditions, though the potential risk of photodamage for repeated scans of the sample over time should be assessed32. In this study, no change of epithelial cell morphology or other adverse effects were observed after repeated scanning.
Current management of unilateral LSCD is carried out using a complex multistage approach that requires several years for its fulfilment and definite restoration of vision, though in less than 60% of cases. This approach includes using autologous limbal stem cell transplantation grown onto fibrin gel to regenerate the corneal epithelium followed by penetrating keratoplasty to repair scarring to the anterior corneal stroma, which is often caused by caustic burns. The hemicornea would repair both the epithelial and stromal damage (anterior stromal scarring is most commonly associated with superficial neovascularization) with a “one step” surgical procedure thus saving time and improving patient care.
In conclusion, the present methodology can be helpful to gain information on growth and differentiation of regenerated epithelia under near-physiological conditions. Miniaturization of the technology (e.g., using fiber optics and more compact pulsed IR laser sources) would greatly hasten the translation of two-photon optical microscopy in the eye bank as a valuable tool to establish and standardize quantitative, minimally-invasive, quality control methodology for harvested corneal limbal stem cells growth and differentiation. In addition to investigation for research and clinical purposes, the present methodology may be helpful for developing valid alternative method for assessing safety and toxicity of drugs and medical devices by imaging human corneal bio-engineered tissues, such as the hemicornea, as innovative in vitro organotypic culture systems33.
Methods
The study was conducted in compliance with the guidelines of the Declaration of Helsinki for research involving the use of human tissues and with the guidelines for the clinical translation of stem cells of the International Society for stem cells. Written informed consent from the next of kin was obtained for the use of samples in research. The laboratory study was approved by the local ethical committee (Provincia di Venezia, Italy). Donors did not have history of corneal pathologies, eye surgery or any major systemic diseases. The scaffolds were prepared in the Fondazione Banca degli Occhi del Veneto (Venezia Zelarino, Italy), as fully described in previous work7, 9, 10. A donor corneoscleral tissue was placed in an artificial anterior chamber and the hemicornea was obtained by microkeratome resection of an anterior stromal lenticule with 200 µm targeted depth. Thereafter, limbal corneal keratinocytes were plated onto the hemicornea and cultured under submerged conditions for 7 days and air lifted for 14 further days; the corneal epithelial cells that were plated on fibrin gel were cultivated at the air-liquid interface for 14 days. The submerged culture technique has been shown to prevent early differentiation and retain more stem cells as opposed to the stratification and differentiation that is observed in extended airlift culture techniques, and to provide highly reproducible outcome (i.e., the eye bank technicians had high success rate, ≥70%, in making and harvesting cell sheets with similar morphologic characteristics in both biomaterial substrates)7, 9. Donor corneoscleral tissues with intact epithelium and 200 µm targeted depth anterior stromal lenticules prepared by microkeratome resection were used as controls.
The tissues and biomaterials used in this work included six hemicorneas and three fibrin gels with cultivated epithelial limbal stem cells, three donor corneoscleral tissues with intact epithelium and three donor anterior stromal lenticules.
Two-photon microscopy imaging
The two-photon microscopy set-up used in this study was based on a Leica DM6000CS (Leica Microsystems GmbH, Germany) upright microscope. A tunable Ti:sapphire laser (VISION II, Coherent, CA, USA) with an integrated proprietary prism-based unit designed to compensate the broadest range of Group Velocity Dispersion was used as excitation source to perform two-photon emission fluorescence (TPEF) and second harmonic generation (SHG) axial scanning measurements in all specimens. This laser presents a tunable wavelength range from 680 to 1080 nm, operating with a pulse width of 140 fs at 80 MHz of repetition rate. The laser power was attenuated by an Electro-Optical-Modulator (EOM) and then coupled into the Leica SP8-Spectral Scan-Head (Leica Microsystems GmbH, Germany) where it passed through the x-y scanning module, allowing the scanning in the x-y focal plane, before being focused by a HCX IRAPO 25x/0.95 NA, water immersion objective with a working distance of 2.5 mm (Leica Microsystems GmbH, Germany). Such lens was ideal for deep tissue imaging at high-resolution, with high transmission in visible and infrared ranges, and axial and lateral colour correction for multiphoton excitation. The whole system was enclosed in a black plastic box in order to assure eye-safety for any IR scattering light from the tissue samples.
Each specimen was placed upward on a quartz microscope slide under the microscope and illuminated by the laser tuned to 712 nm or 810 nm for collecting the TPEF or the SHG signals from cellular and extracellular components of each sample respectively. For each sample, the TPEF and SHG signals were collected consecutively in the same imaging session. The laser power was 15 mW before entering the water immersion objective in all sessions; it was measured before and during each session of measurements in order to allow direct comparison of measurements between different sessions of experiments34. The TPEF light was collected in backward direction by a nondescan detector (NDD) for reflected light and the SHG signal was collected both in backward and forward directions by a pair of NDDs in the transmission and reflected paths of the microscope respectively. For the transmission NDD unit, the incoming light first went through a short pass filter (λ < 680 nm, SP680) and then was filtered by a 10 nm FWHM band pass filter centered at 405 nm (FF01-405/10-25, Semrock Inc., Rochester, NY, USA) in order to image only the SHG forward signal emitted by the corneal stroma. The reflected light coming from the sample was first filtered by an IR filter SP680 and then encountered a dichroic beam splitter (Di02R405-25x36 Semrock Inc., Rochester, NY, USA). Each of the transmitted and the reflected light paths from the dichroic entered to each of the two reflection NDDs; the reflected light was filtered by a band pass filter 447/60 (Semrock Inc., Rochester, NY, USA) and entered into the reflection NDD unit and the transmitted light was again filtered by FF01-405/10-25 to provide the backward SHG signal.
In order to compare data between different sessions of experiments, the NDDs sensitivity settings for collecting the TPEF and SHG signals were the same for all specimens. The TPEF emission spectra collected with this configuration were consistent with the literature values for NAD(P)H and flavins, enabling visualization of cellular structures (mitochondria)6, 16, 27. Under 2-photon excitation at 700–750 nm wavelengths, tissue fluorophores are primarily derived from the aromatic amino acids such as tryptophan, tyrosine and phenylalanine which emit at 400–600 nm wavelengths. The TPEF enabled visualization of epithelial and stromal cells and nerve fibers. The SHG emission spectrum (400–430 nm) is consistent with collagen, which holds noncentrosymmetric structure, excited at wavelength between 800–860 nm17, 18, 29, 31.
Each sample was scanned twice for collecting either TPEF or SHG signals with a 2 µm or 4 µm step size in the z-axis, extending from above the epithelial surface to below the anterior 200 µm stroma; images with 1024 × 1024 pixels resolution (2 frames average) were recorded on several locations of the hemicornea and fibrin gel and in the central and para-central regions of the corneoscleral tissue. Image visualization were carried out using proprietary Leica software and an image processing package (Image J, NIH, www.imagej.nih.gov/ij/ ) and custom-written macros.
Image analysis
A sampling area of 120 × 120 µm was used to analyse the TPEF images of the basal epithelial layer of the biomaterials and corneoscleral tissues as well as the TPEF signal of the most anterior stromal keratocytes lying at 60 ± 10 µm from the epithelial surface of both the hemicornea and control corneal tissue (i.e., beneath the Bowman’s membrane). Cellular fluorescence was measured as the mean intensity of all pixels within the sampling area; in TPEF images of the stroma, the average fluorescence intensity from an area devoid of cells was first measured and subtracted as background using the proprietary Leica software.32 Data were exported in a text array for statistics.
The density, spacing and preferred packing arrangements of cells were analysed on several sampling areas of 120 × 120 µm. Image cell labelling process was performed using an algorithm implemented with the image processing toolbox in Matlab (The Mathworks Inc, Natick MA, USA)35, 36; cells were selected by two expert investigators (ML and GL) and the results for each sampling window recorded (Supplementary Fig. 1). The x, y coordinates of the cell centroids were then stored in a text array and used to calculate the cell metrics. The number of cells in each sampling area was divided by the epithelial area to derive an estimate of cell density (cells/mm2). Cell spacing was calculated as the distance of the closest cell in the array for each of the cell, which is equivalent to the nearest neighbour distance (NND; µm)37. Cell packing arrangement was analyzed using Voronoi diagrams. This approach is commonly used in computational geometry to subdivide a plane into regions based on distance to point sites38. The Voronoi tessellation was implemented by the voronoi Matlab function from the bidimensional coordinates of labelled cells35, 36. Each Voronoi cell was coded by a different colour corresponding to the number of their neighbouring cones: gray = tetragonal (4n) arrangement, yellow = pentagonal (5n) arrangement, green = hexagonal (6n) arrangement; blue = heptagonal (7n) arrangement and white = octagonal (8n) arrangement. The Voronoi regions containing pixels that extended beyond the bounds of each section were excluded from further analysis, thus creating a buffer zone to minimize the boundary effect.
The plugin OrientationJ (http://bigwww.epfl.ch/demo/orientation/) in ImageJ was used for analysis of stromal collagen fiber orientations, based on the evaluation of the structure tensor in a local neighborhood, as previously described by Vielreicher et al.29, 39. The Dominant Direction function was used to calculate the preferred fiber orientation and the coherency values over 120 × 120 µm sampling area for each SHG (both forward and backward) image stack from the Bowman’s layer to a maximum of 65 µm in the anterior stroma. Coherency, C, was used as a measure for the local degree of order of fibers (0 = isotropic symmetry/disordered system of fibers; 1 = anisotropic symmetry/ordered system along the dominant direction).
The preferred fiber orientation, computed by calculating the structure tensor and its associated eigenvalues, corresponds to the direction of the eigenvector associated to the smallest eigenvalues of the tensor, i.e λmin, i.e., whose orientation is perpendicular to the maximum direction of the gradient22. For each SHG image, we extracted the fiber orientation distribution (Supplementary Fig. 2) obtained by evaluating the preferred fiber orientation for each pixel and then computing the histograms of the orientations using 180 equally spaced bins.
Coherency is a measure of confidence or anisotropy index, defined as:
If C ≈ 0, which corresponds to λ max = λ min, then the region of interest is rotational symmetric without any dominant direction, the structure has no preferred orientation and collagen fibers are distributed in each direction. If C ≈ 1, which corresponds to λ max > 0, λ min ≈ 0, the fibers in the region of interest are well-aligned and a preferred orientation exists. For 0 < C < 1, the preferred fiber orientation lies between the gradient directions. In general, a coherency close to 1 indicates that the structure holds a preferred orientation and spatial anisotropy exists in the region of interest; a coherency value close to 0 indicates that there is no preferred fiber direction and isotropy symmetry exists.
The difference of the preferred fiber orientation (Δγ) for the forward and backward SHG images was used as a parameter for comparison between SHG signals40.
The measurement of the forward and backward SHG intensities has been shown to be valuable for collecting information on the structure of fibrillar tissues, such as the corneal stroma24. Owing to its coherent nature, SHG is usually observed to be emitted in the forward (transmitted) direction. If axial scatterers are separated by a multiple of distance of λSHG/2, i.e., λ/4, an appreciable backward (coherent) directed SHG is observable. In addition, the backward SHG signal may also be produced from multiple scattered forward (incoherent) SHG. If perfect phase match occurs, i.e., ΔK = K2ϖ − 2Kϖ = 0, the SHG emission is 100% forward directed and co-propagates along laser beam direction. If imperfect phase match (as usual) is present, it gives rise to a corresponding distribution of forward and backward emitted components and, as a result, SHG in tissues is described as quasi-coherent. In tissue imaging, the measured directionality of the SHG signal (F/B ratio) will comprise a convolution of the initially emitted directionality (FSHG/BSHG) and the subsequent scattering of these photons at λSHG 24, 41. The FSHG/BSHG is highly dependent upon the fibril diameter, the packing density and regularity relative to the size-scale of the SHG wavelength. The bulk optical properties are related to density (primarily the scattering coefficient, µs) and organization (primarily the scattering anisotropy, g) of the fibrillar assembly24, 41. Specifically, structures that are ordered on the size of λSHG in the axial direction will give rise to predominantly forward SHG, whereas the emission from smaller and/or more random structures with larger Δk values will have relatively less forward directed signal and higher backward signals.
It should be kept in mind that FSHG/BSHG is not the quantity measured in an experiment, which we define as F/B ratio. The first metric takes into consideration the quasi-coherent interactions associated with fibril diameter, packing density and randomness in the fibrillary matrix41. The latter metric, which was calculated as the ratio of the mean (forward and backward) SHG signal intensity for all the frames in each stack, consists of the emitted directionality and components arising from forward and backward scattering of the initially emitted photons. The F/B ratio was calculated in the region of interest (120 µm side) in order to obtain information on the structural differences between the stroma of the hemicornea and control anterior lenticules. The greater the F/B ratio, the greater the fibril packing density (if < λSHG) and/or the larger the fibril diameters (approximately λSHG, independent of the packing arrangement)24, 25, 41.
We chose to use sample areas of 120 μm side in the central region of each TPEF and SHG images in order to have an area big enough to evaluate the main features of the epithelia regenerated on the two different bioscaffolds and the stromal collagen fiber orientation respectively as well as to avoid any loss of information that may occur at the edges of the images due to the samples’ shape or locally due intrinsic heterogeneity of biological tissues (e.g., filter effects, such as loss of laser intensity and/or loss of SHG signal)23–25, 41, 42.
Statistics
Data were expressed as mean ± standard deviation. Statistics were performed using the SPSS software (SPSS Inc., version 17.0). The normal data distribution was tested by using the one-sample Kolmogorov-Smirnov test. The analysis of variance and the Tukey pairwise test were used to test significance between TPEF signal intensity and cell metrics among biomaterials. Statistical significance was set at P < 0.05 for all the tests performed.
Sample size (allocation ratio 2:1) was calculated to determine a mean difference of 1200 (±600) cells/mm2 between the epithelia regenerated on the two different biomaterials at a significance level of 5% and a power of 81%.
Electronic supplementary material
Acknowledgements
This work was supported by the Italian Ministry of Health grant n. GR2010-236138, the National Framework Program for Research and Innovation PON grant n. 01_00110 and Fondazione Roma.
Author Contributions
M.L. designed the experiments. V.B. and E.D.I. prepared the bio-scaffolds with regenerated epithelia. M.L., G.L and S.S. performed the microscopy experiments and processed/analyzed data. All authors interpreted results, wrote and revised the manuscript.
Competing Interests
The authors declare that they have no competing interests.
Footnotes
Electronic supplementary material
Supplementary information accompanies this paper at doi:10.1038/s41598-017-05486-8
Publisher's note: Springer Nature remains neutral with regard to jurisdictional claims in published maps and institutional affiliations.
References
- 1.Wang HY, Wei RH, Zhao SZ. Evaluation of corneal cell growth on tissue engineering materials as artificial cornea scaffolds. Int. J. Ophthalmol. 2013;6:873–878. doi: 10.3980/j.issn.2222-3959.2013.06.23. [DOI] [PMC free article] [PubMed] [Google Scholar]
- 2.Massie I, et al. Advanced imaging and tissue engineering of the human limbal epithelial stem cell niche. Methods Mol. Biol. 2015;1235:179–202. doi: 10.1007/978-1-4939-1785-3_15. [DOI] [PMC free article] [PubMed] [Google Scholar]
- 3.Genicio N, Gallo Paramo J, Shortt AJ. Quantum dot labeling and tracking of cultured limbal epithelial cell transplants in vitro. Invest. Ophthalmol. Vis. Sci. 2015;56:3051–3059. doi: 10.1167/iovs.14-15973. [DOI] [PMC free article] [PubMed] [Google Scholar]
- 4.Nakamura T, et al. Microspectroscopy of spectral biomarkers associated with human corneal stem cells. Mol. Vis. 2010;16:359–368. [PMC free article] [PubMed] [Google Scholar]
- 5.Quinn KP, et al. Quantitative metabolic imaging using endogenous fluorescence to detect stem cell differentiation. Sci. Rep. 2013;3:3432. doi: 10.1038/srep03432. [DOI] [PMC free article] [PubMed] [Google Scholar]
- 6.Rice WL, Kaplan DL, Georgakoudi I. Two-photon microscopy for non-invasive, quantitative monitoring of stem cell differentiation. PLoS ONE. 2010;5:e10075. doi: 10.1371/journal.pone.0010075. [DOI] [PMC free article] [PubMed] [Google Scholar]
- 7.Rama P, et al. Limbal stem-cell therapy and long-term corneal regeneration. N. Engl. J. Med. 2010;363:147–155. doi: 10.1056/NEJMoa0905955. [DOI] [PubMed] [Google Scholar]
- 8.Uchugonova A, König K. Two-photon autofluorescence and second-harmonic imaging of adult stem cells. J. Biomed. Opt. 2008;13:054068. doi: 10.1117/1.3002370. [DOI] [PubMed] [Google Scholar]
- 9.Barbaro V, Ferrari S, Fasolo A, Ponzin D, Di Iorio E. Reconstruction of a human hemicornea through natural scaffolds compatible with the growth of corneal epithelial stem cells and stromal keratocytes. Mol. Vis. 2009;15:2084–2093. [PMC free article] [PubMed] [Google Scholar]
- 10.Li C, et al. A novel method for preservation of human corneal limbal tissue. Invest. Ophthalmol. Vis. Sci. 2013;54:4041–4047. doi: 10.1167/iovs.13-11648. [DOI] [PubMed] [Google Scholar]
- 11.Kawakita T, et al. Intrastromal invasion by limbal epithelial cells is mediated by epithelial -mesenchymal transition activated by air exposure. Am. J. Pathology. 2005;167:381–393. doi: 10.1016/S0002-9440(10)62983-5. [DOI] [PMC free article] [PubMed] [Google Scholar]
- 12.Doughty MJ. A descriptive and quantitative study of the keratocytes of the corneal stroma of albino rabbits using transmission electron microscopy. Tissue Cells. 2001;33:408–422. doi: 10.1054/tice.2001.0195. [DOI] [PubMed] [Google Scholar]
- 13.Chan EH, Eric Chen L, Rao JY, Deng XS. Limbal basal cell density decreases in limbal stem cells deficiency. Am. J. Ophthalmol. 2015;160:678–684. doi: 10.1016/j.ajo.2015.06.026. [DOI] [PMC free article] [PubMed] [Google Scholar]
- 14.Romano AC, et al. Different cell sizes in human limbal and central basal epithelial measured by confocal microscopy and flow cytometry. Invest. Ophthalmol. Vis. Sci. 2003;44:5125–5129. doi: 10.1167/iovs.03-0628. [DOI] [PubMed] [Google Scholar]
- 15.Carrier P, et al. Impact of cell source on human cornea reconstructed by tissue engineering. Invest. Ophthalmol. Vis. Sci. 2009;50:2645–2652. doi: 10.1167/iovs.08-2001. [DOI] [PubMed] [Google Scholar]
- 16.McLoughlin CB. Mesenchymal influences on epithelial differentiation. Symp. Soc. Exp. Biol. 1963;17:359–388. [PubMed] [Google Scholar]
- 17.Labate C, et al. Multiscale investigation of the depth-dependent mechanical anisotropy of the human corneal stroma. Invest. Ophthalmol. Vis. Sci. 2015;56:4053–4060. doi: 10.1167/iovs.15-16875. [DOI] [PMC free article] [PubMed] [Google Scholar]
- 18.Winkler M, et al. Nonlinear optical macroscopic assessment of 3-D corneal collagen organization and axial biomechanics. Invest. Ophthalmol. Vis. Sci. 2011;2:8818–8827. doi: 10.1167/iovs.11-8070. [DOI] [PMC free article] [PubMed] [Google Scholar]
- 19.Muller LJ, Pels E, Vrensen GF. The specific architecture of the anterior stroma accounts for maintenance of corneal curvature. Br. J. Ophthalmol. 2001;85:437–443. doi: 10.1136/bjo.85.4.437. [DOI] [PMC free article] [PubMed] [Google Scholar]
- 20.Morishige N, Takagi Y, Chikama T, Takahara A, Nishida T. Three-dimensional analysis of collagen lamellae in the anterior stroma of the human cornea visualized by second harmonic generation imaging microscopy. Invest. Ophthalmol. Vis. Sci. 2011;52:911–915. doi: 10.1167/iovs.10-5657. [DOI] [PubMed] [Google Scholar]
- 21.Lombardo M, Merino D, Loza-Alvarez P, Lombardo G. Translational label-free nonlinear imaging biomarkers to classify the human corneal microstructure. Biomed. Opt. Express. 2015;6:2803–2818. doi: 10.1364/BOE.6.002803. [DOI] [PMC free article] [PubMed] [Google Scholar]
- 22.Avila FJ, Bueno JM. Analysis and quantification of collagen organization with the structure tensor in second harmonic microscopy images of ocular tissues. Appl. Opt. 2015;54:9848–9853. doi: 10.1364/AO.54.009848. [DOI] [PubMed] [Google Scholar]
- 23.Williams RM, Zipfel WR, Webb WW. Interpreting second-harmonic generation images of collagen I fibrils. Biophysical J. 2005;88:1377–1386. doi: 10.1529/biophysj.104.047308. [DOI] [PMC free article] [PubMed] [Google Scholar]
- 24.Chen X, Nadiarynkh O, Plotnikov S, Campagnola PJ. Second harmonic generation microscopy for quantitative analysis of collagen fibrillar structure. Nat. Protoc. 2012;7(4):654–669. doi: 10.1038/nprot.2012.009. [DOI] [PMC free article] [PubMed] [Google Scholar]
- 25.Hsueh C-M, et al. Structural characterization of edematous corneas by forward and backward second harmonic generation imaging. Biophysical J. 2009;97:1198–1205. doi: 10.1016/j.bpj.2009.05.040. [DOI] [PMC free article] [PubMed] [Google Scholar]
- 26.Mertz J, Moreaux L. Second‐harmonic generation by focused excitation of inhomogeneously distributed scatterers. Opt. Commun. 2001;196:325–330. doi: 10.1016/S0030-4018(01)01403-1. [DOI] [Google Scholar]
- 27.Zipfel WR, et al. Live tissue intrinsic emission microscopy using multiphoton-excited native fluorescence and second harmonic generation. PNAS. 2003;100:7075–7080. doi: 10.1073/pnas.0832308100. [DOI] [PMC free article] [PubMed] [Google Scholar]
- 28.Tidu A, et al. Development of human corneal epithelium on organized fibrillated transparent collagen matrices synthesized at high concentration. Acta Biomater. 2015;22:50–58. doi: 10.1016/j.actbio.2015.04.018. [DOI] [PubMed] [Google Scholar]
- 29.Vielreicher, M., et al. Multiphoton microscopy analysis of extracellular collagen I network formation by mesenchymal stem cells, J. Tissue Eng. Regen. Med. (29 Dec 2015) [Epub ahead of print]. [DOI] [PubMed]
- 30.Huang S, Heikal AA, Webb WW. Two-photon fluorescence spectroscopy and microscopy of NAD(P)H and flavoprotein. Biophys. J. 2002;82:2811–2825. doi: 10.1016/S0006-3495(02)75621-X. [DOI] [PMC free article] [PubMed] [Google Scholar]
- 31.Batista A, Breunig HG, Uchugonova A, Morgado AM, König K. Two-photon spectral fluorescence lifetime and second-harmonic generation imaging of the porcine cornea with a 12-femtosecond laser microscope. J. Biomed. Opt. 2016;21:036002. doi: 10.1117/1.JBO.21.3.036002. [DOI] [PubMed] [Google Scholar]
- 32.Rice WL, Kaplan DL, Georgakoudi I. Quantitative biomarkers of stem cell differentiation based on intrinsic two-photon excited fluorescence. J. Biomed. Opt. 2007;12:060504–1. doi: 10.1117/1.2823019. [DOI] [PubMed] [Google Scholar]
- 33.Builles N, et al. Development of a hemicornea from human primary cell cultures for pharmacotoxicology testing. Cell Biol. Toxicol. 2007;23:279–292. doi: 10.1007/s10565-006-0191-0. [DOI] [PubMed] [Google Scholar]
- 34.Lombardo M, Micali N, Villari V, Serrao S, Lombardo G. All-optical method to assess stromal concentration of riboflavin in conventional and accelerated UV-A irradiation of the human cornea. Invest. Opthalmol. Vis. Sci. 2016;57:476–483. doi: 10.1167/iovs.15-18651. [DOI] [PubMed] [Google Scholar]
- 35.Lombardo M, Serrao S, Ducoli P, Lombardo G. Eccentricity dependent changes of density, spacing and packing arrangement of parafoveal cones, Ophthalmic Physiol. Optics. 2013;33:516–526. doi: 10.1111/opo.12053. [DOI] [PubMed] [Google Scholar]
- 36.Lombardo M, Serrao S, Ducoli P, Lombardo G. Influence of sampling window size and orientation on parafoveal cone packing density. Biomed. Opt. Express. 2013;4:1318–1331. doi: 10.1364/BOE.4.001318. [DOI] [PMC free article] [PubMed] [Google Scholar]
- 37.Galli-Resta L, Novelli E, Kryger Z, Jacobs GH, Reese BE. Modelling the mosaic organization of rod and cone photoreceptors with a minimal-spacing rule. Eur. J. Neurosci. 1999;11:1461–1469. doi: 10.1046/j.1460-9568.1999.00555.x. [DOI] [PubMed] [Google Scholar]
- 38.Duyckaerts C, Godefroy G. Voronoi tessellation to study the numerical density and the spatial distribution of neurons. J. Chem. Neuroanatomy. 2000;20:83–92. doi: 10.1016/S0891-0618(00)00064-8. [DOI] [PubMed] [Google Scholar]
- 39.Rezakhaniha R, et al. Experimental investigation of collagen waviness and orientation in the arterial adventitia using confocal laser scanning microscopy. Biomech. Model Mechanobiol. 2012;11:461–73. doi: 10.1007/s10237-011-0325-z. [DOI] [PubMed] [Google Scholar]
- 40.Rao RAR, Mehta MR, Leithem S, Toussaint KC., Jr. Quantitative analysis of forward and backward second-harmonic images of collagen fibers using Fourier transform second-harmonic-generation microscopy. Opt. Lett. 2009;34:3779–3781. doi: 10.1364/OL.34.003779. [DOI] [PubMed] [Google Scholar]
- 41.Nadiarnykh O, LaComb RB, Brewer MA, Campagnola PJ. Alterations of the extracellular matrix in ovarian cancer studied by Second Harmonic Generation imaging microscopy. BMC Cancer. 2010;10:94. doi: 10.1186/1471-2407-10-94. [DOI] [PMC free article] [PubMed] [Google Scholar]
- 42.Chu S-W, et al. Thickness dependence of optical second harmonic generation in collagen fibrils. Opt. Expr. 2007;15(19):12005–12010. doi: 10.1364/OE.15.012005. [DOI] [PubMed] [Google Scholar]
Associated Data
This section collects any data citations, data availability statements, or supplementary materials included in this article.