Abstract
Background
Given the tolerability of nPG in first-line therapy, we desired to evaluate the response and toxicity profiles of second-line gemcitabine with nab-paclitaxel (nPG) following FOLFIRINOX.
Methods
We retrospectively identified 30 patients who received first-line FOLFIRINOX for unresectable or metastatic pancreatic adenocarcinoma followed by second-line nPG. Response was evaluated by RECIST criteria and carbohydrate antigen 19-9 (CA19-9) change.
Results
Median age was 63 years with 77% percent having metastatic disease. Nineteen patients (63%) achieved PR based on CA19-9. Median overall survival (OS) with nPG was 12.4 months (mo) and median progression-free survival (PFS) was 3.7 mo. Median PFS and OS for patients with at least stable CA19-9 were 4.7 and 13.9 mo since initiation of nPG. Patients with an increased CA19-9 level during nPG had a shorter median PFS (1.4 mo) and OS (5.3 mo). A significant PFS difference was demonstrated in patients with at least stable disease as the best RECIST response versus in those with progressive disease (5.4 vs. 1.9 mo, P<0.001). Grade 3/4 adverse events include thrombocytopenia (33%), anemia (23%), nausea (17%), lymphopenia (7%), infectious complications (6%), diarrhea (3%), and neuropathy (3%).
Conclusions
This study demonstrates a clinical benefit of second-line nPG. The study also suggests a possible use of CA19-9 to predict response to therapy.
Keywords: Pancreatic cancer, FOLFIRINOX, gemcitabine, nab-paclitaxel, carbohydrate antigen 19-9 (CA19-9)
Introduction
Until recently, primary treatment for metastatic pancreatic cancer was single agent gemcitabine or gemcitabine plus erlotinib. Median historic survival times ranged between 6–6.2 months (mo) for either regimen (1). More recently, the ACCORD-11 trial compared a combination of 5-FU, oxaliplatin and irinotecan (FOLFIRINOX) to gemcitabine alone in patients with metastatic pancreatic cancer. This study revealed a response rate of 31.6% and median overall survival (OS) for the combination arm of 11.1 mo, compared to 6.8 mo for the gemcitabine-alone arm (2). These results suggested a role for FOLFIRINOX in the care of metastatic pancreatic cancer patients. Subsequent publication of the MPACT study compared first-line gemcitabine to the combination of gemcitabine and nab-paclitaxel (nPG). In this study, a response rate of 23% was seen and median OS was 8.7 mo for the combination arm versus 6.7 mo for gemcitabine alone (3,4). There were numerous differences between these two trials that make a direct comparison between them difficult. Although many side effects did not significantly differ between the regimens, a sizable number of patients with poorer performance status (PS) were enrolled in the MPACT trial. With regard to second-line trials, the CONKO-003 trial suggested a role for a fluoropyrimidine and oxaliplatin-based regimens after a first-line gemcitabine-based regimen (5). More recently, the Napoli-1 study demonstrated a 2-month median OS advantage for a liposomal encapsulated irinotecan (MM-398) with 5-FU, compared to 5-FU alone after gemcitabine failure (6). Given the tolerability of nPG in first-line therapy, we retrospectively identified patients treated with FOLFIRINOX who upon progression were treated with nPG in a combination of academic and community settings, thereby evaluating the response and toxicity profiles of nPG in the second-line setting.
Methods
We retrospectively identified via the electronic medical record at the University of Pittsburgh Medical Center Network in Pennsylvania all patients treated between January 2011 and October 2015 for unresectable or metastatic pancreatic cancer. Institutional Review Board consent was obtained for the review. Data were obtained from available electronic medical records and cross-sectional imaging. We then identified 30 patients treated with FOLFIRINOX as first-line therapy who upon progression or excessive toxicity were switched to nPG. Patients were excluded if they received combination 5-FU therapy that was not part of the FOLFIRINOX regimen. The primary metrics analyzed for this study were progression-free survival (PFS) and OS, response by radiological and carbohydrate antigen 19-9 (CA19-9) criteria. Adverse events were evaluated and graded through review of chart documentation according to the Common Terminology Criteria for Adverse Events (CTCAE version 4.0). Radiological response was defined by means of the Response Evaluation Criteria In Solid Tumors (RECIST 1.1) criteria. Radiologic response assessment was reviewed by investigators and an institution radiologist. CA19-9 response was defined as a decrease by greater than 50% from baseline for response and an increase by greater than 20% from baseline for progression (7-11). PFS was determined from time of first treatment of FOLFIRINOX to disease progression or toxicity and from time of nPG initiation to disease progression to disease progression or toxicity. Similarly, OS was determined from time of first treatment of FOLFIRINOX to death and from time of nPG initiation to death. The median PFS and OS were determined using the Kaplan-Meier method. The relationship between number of cycles of chemotherapy received and best RECIST 1.1 response was investigated with a cumulative logit model (12). Statistical significance required P<0.05. Statistical tests were performed using R 3.3.
Results
Patient characteristics
A total of 30 patients were identified via the electronic medical record that met the previously described inclusion and exclusion criteria from January 2011 to October 2015. The median age of the included patients was 63 years (range, 46–78 years). Of the 30 patients, 47% were female. Pancreatic head tumors were seen in 40% of patients, whereas 20% and 33% had pancreatic body and tail tumors, respectively (Table 1; two (7%) were of unknown location). At diagnosis, 7 patients had stage III disease and 23 patients were stage IV. The majority of the metastatic disease sites were liver (61%), lung (30%) and peritoneum (22%) at the time of diagnosis. At the start of nPG, the metastatic sites were liver (62%), peritoneum (35%), pulmonary (21%) and adrenal (4%). The majority of the patients had only one metastatic site at time of diagnosis (87%) and at time of nPG initiation (73%). Three patients had more than one metastatic site at the time of diagnosis (one peritoneum/pulmonary, one peritoneum/liver and one peritoneum/pulmonary/liver). Seven patients had more than one metastatic site at the time of nPG initiation (two peritoneum/pulmonary, three peritoneum/liver, one peritoneum/adrenal and one peritoneum/pulmonary/liver). Baseline CA19-9 at time of diagnosis for these patients was greater than 1,000 units/mL in 19 (63%) patients (Table 1). The average CA19-9 was 3,919 units/mL. Second-line therapy was initiated secondary to disease progression in 73% of the patients, whereas seven patients had to change therapy secondary to the toxicities of diarrhea, nausea, and fatigue.
Table 1. Patient demographics and baseline characteristics.
| Patient characteristics | N (%) |
|---|---|
| Total number of patients | 30 |
| Median age (range) | 63 [46–78] |
| Sex | |
| Male | 16 [53] |
| Female | 14 [47] |
| Tumor locations | |
| Head | 12 [40] |
| Body | 6 [20] |
| Tail | 10 [33] |
| Unknown | 2 [7] |
| Stage | |
| III | 7 [23] |
| IV | 23 [77] |
| Metastatic sites at diagnosis | |
| Liver | 14 [61] |
| Peritoneum | 5 [22] |
| Pulmonary | 7 [30] |
| Metastatic sites at start of gemcitabine/nab-paclitaxel (nPG) | |
| Liver | 16 [62] |
| Peritoneum | 9 [35] |
| Pulmonary | 8 [21] |
| Adrenal | 1 [4] |
| Number of metastatic sites at diagnosis | |
| 1 | 20 [87] |
| 2 | 2 [9] |
| 3 | 1 [4] |
| Number of metastatic sites at start of nPG | |
| 1 | 19 [73] |
| 2 | 6 [23] |
| 3 | 1 [4] |
| CA19-9 at baseline | |
| Normal | 2 [7] |
| 20–100 | 9 [30] |
| >1,000 | 19 [63] |
| Reason for second-line therapy | |
| Progression | 22 [73] |
| Toxicity | 7 [23] |
| No response | 1 [3] |
Efficacy of FOLFIRINOX
There were 151 cycles of FOLFIRINOX given to 30 patients. The median number of cycles of FOLFIRINOX received by our patients was 4 (range, 2–16). Eleven patients (37%) had an increase in CA19-9 by greater than 20% from baseline as their best response to FOLFIRINOX. There were seven patients with a partial response by CA19-9 (CA-PR) corresponding to a fall of greater than 50% by CA19-9 and six patients who had incomplete data. Of the patients with CA-PR, four patients had pancreatic head tumors with the remaining being split between body (two) and tail (one) locations. There was no noted relationship between the number of FOLFIRINOX cycles received and the changes in CA19-9 response to FOLFIRINOX (Figure S1).
Figure S1.
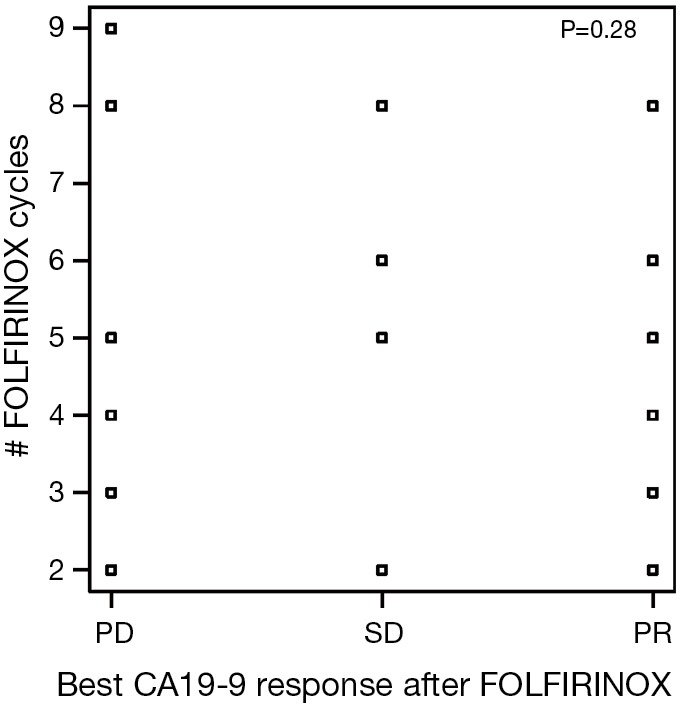
Best CA19-9 response for FOLFIRINOX in relation to number of FOLFIRINOX cycles received. PD, disease progression; SD, stable disease; PR, partial response.
At the end of the FOLFIRINOX treatment, based on RECIST criteria, 16 patients had stable disease (R-SD), one patient demonstrated a partial response (R-PR) with a greater than 20% reduction in measurement of targeted lesion from baseline as the best response. Seven patients (23%) were found to have progression. Similar to the lack of relationship between CA19-9 response and cumulative FOFIRINOX dosing, there was no correlation between tumor size and number of cycles of FOLFIRINOX received (Figure S2).
Figure S2.
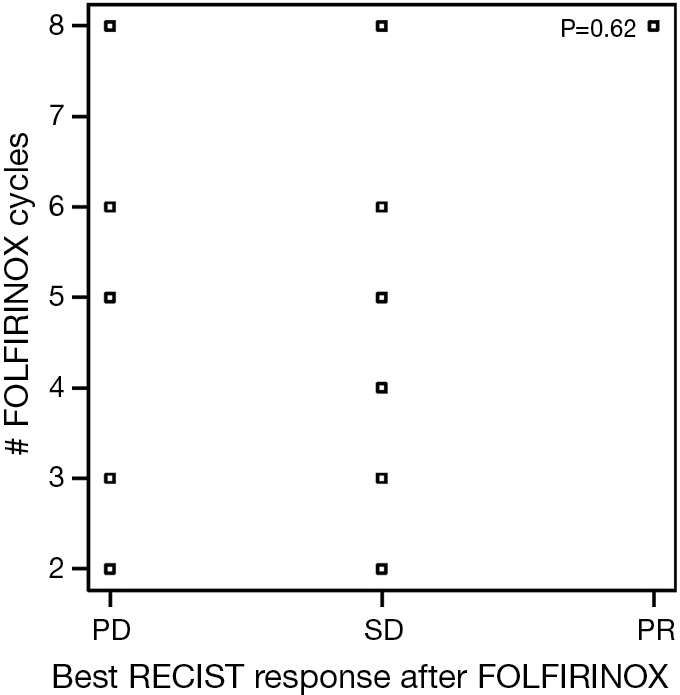
Best RECIST response for FOLFIRINOX in relation to number of FOLFIRINOX cycles received. PD, disease progression; SD, stable disease; PR, partial response.
Efficacy of nPG
There were 175 cycles of nPG given during the evaluation period. The median number of cycles of nPG received by patients was 4 (range, 1–21), which was similar to the FOLFIRINOX group. Two patients (7%) remained on nPG at the time of completion of data collection in October 2015. Nineteen of 30 patients (63%) achieved CA-PR during the course of treatment with this combination chemotherapy. A further 7% (2/30) of patients demonstrated progression of CA19-9 (CA-PD) as the best response with this therapy combination. At the end of nPG, 8 (27%) of patients demonstrated CA-PD and 13 (43%) patients continued to have a CA-PR. Six patients had missing data. At the end of nPG data collection, there were five (17%) patients with partial response based on RECIST criteria. We had incomplete imaging data on seven patients. There was also no relationship between the best CA19-9 response to nPG and number of nPG cycles received (Figure S3). There was no relationship between tumor size and the number of cycles of nPG chemotherapy received (Figure S4). Second-line nPG had a clinical benefit (SD and PR) of 73% by means of CA19-9 and 57% by means of imaging response.
Figure S3.
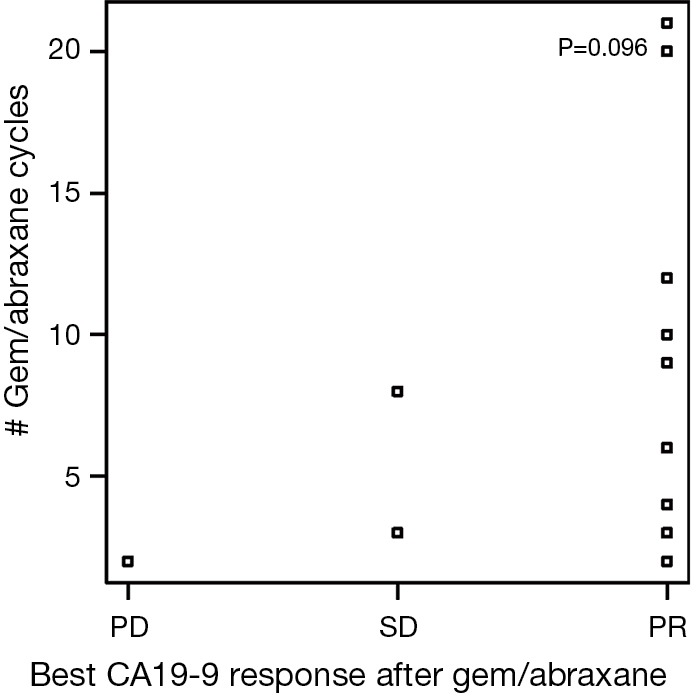
Best CA19-9 response for gemcitabine/nab-paclitaxel (nPG) in relation to number of nPG cycles received. PD, disease progression; SD, stable disease; PR, partial response.
Figure S4.

Best RECIST response for gemcitabine/nab-paclitaxel (nPG) in relation to number of nPG cycles received. PD, disease progression; SD, stable disease; PR, partial response.
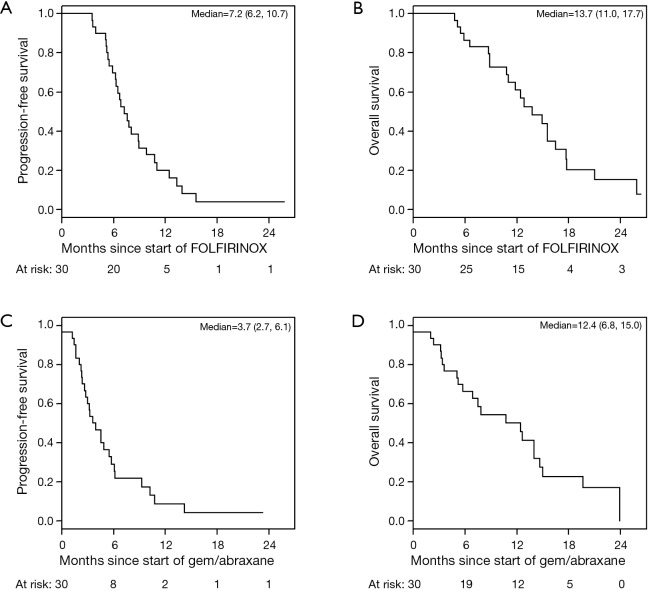
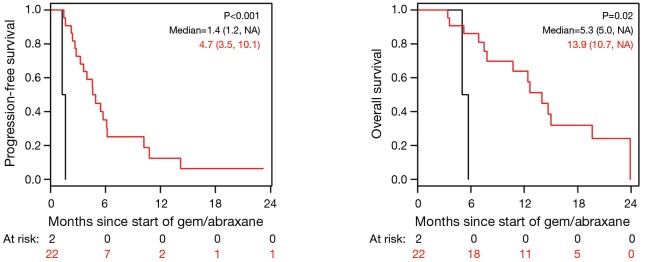
The median PFS for all patients since starting FOLFIRINOX was 7.2 mo [95% confidence interval (CI), 6.2–10.7] and was not influenced by the best CA19-9 response to FOLFIRINOX (Figure S5). Interestingly, those with PD as their best RECIST response to FOLFORINOX had a trend to improved survival perhaps because of an earlier change in chemotherapy to nPG (Figure S6). Median OS was noted to be 13.7 mo (95% CI, 11.0–17.7) since the start of FOLFIRINOX. OS since starting second-line nPG was 12.4 mo, with a median PFS of 3.7 mo (Figure 1). Median PFS and median OS for patients with stable or improved CA19-9 (CA-CR) were 4.7 mo (95% CI, 3.5–10.1) and 13.9 mo (95% CI, 10.7–NR) since the start of nPG, respectively. Those patients who did not have a CA19-9 decrease (CA-PD) during second-line nPG had a median PFS and median OS of 1.4 mo (95% CI, 1.2–NR) and 5.3 mo (95% CI, 5.0–NR), respectively (Figure 2). Patients who had a decrease of more than 90% in their CA19-9 reduction had a trend to a longer median OS (NR, 95% CI, 12.6–NR mo) and median PFS (6.1 mo, 95% CIM 4.8–NR) (Figure 3). The median PFS for patients with a CA19-9 reduction from 50–90% is 3.5 mo (95% CI, 2.6–NR) and with CA19-9 reduction less than 50% is 2.2 mo (95% CI, 1.6–NR). The median OS for patients with CA19-9 reduction from 50–90% is 12.4 mo (95% CI, 7.4–NR) and with CA19-9 reduction less than 50% is 5.7 mo (95% CI, 5.0–NR).
Figure S5.

Progression-free survival (PFS) based on best CA19-9 response to FOLFIRINOX since starting FOLFIRINOX. PD, disease progression; SD, stable disease; PR, partial response.
Figure S6.
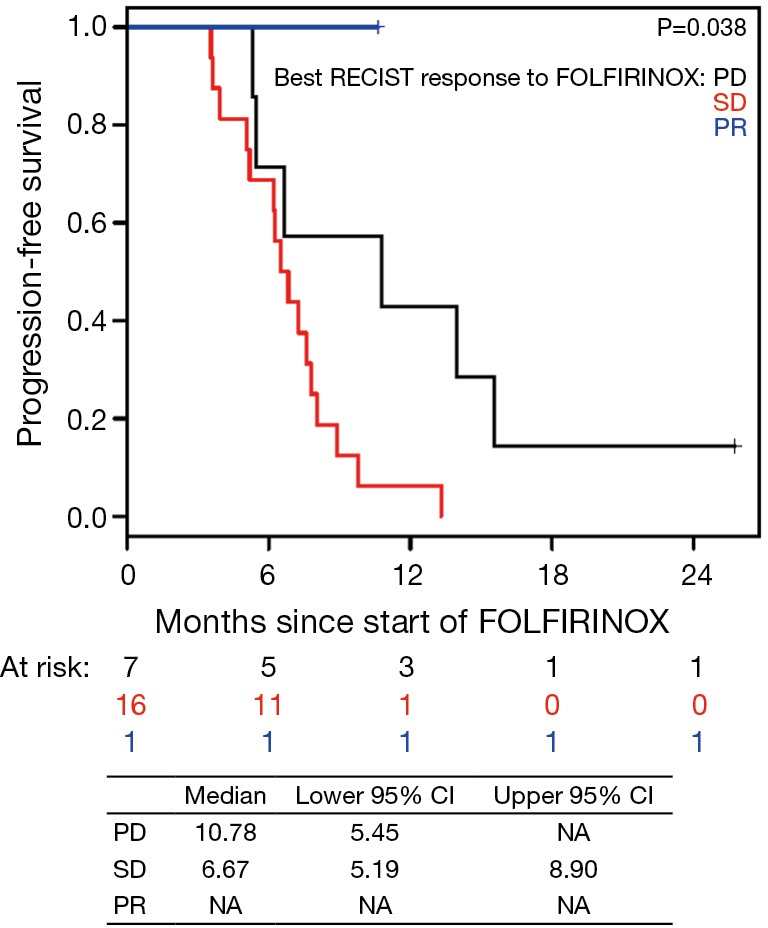
Progression-free survival (PFS) based on best RECIST response to FOLFIRINOX since starting FOLFIRINOX. PD, disease progression; SD, stable disease; PR, partial response.
Figure 1.
Progression-free survival (PFS) and overall survival (OS) of study subjects. (A,B) PFS and OS of study subjects from start of all treatment; (C,D) PFS and OS survival of study subjects after failure of FOLFIRINOX.
Figure 2.
Progression-free survival (PFS) and overall survival (OS) based on best CA19-9 response while on gemcitabine/nab-paclitaxel (nPG). Black, CA19-9 increase ≥20% from base line; red, CA19-9 increase <20% or any decrease in CA19-9.
Figure 3.
Progression-free survival (PFS) and overall survival (OS) based on degree of CA19-9 response while on gemcitabine/nab-paclitaxel (nPG). Black, best CA19-9 response <50% of baseline; red, best CA19-9 response 50–90% of baseline; blue, best CA19-9 response >90% of baseline.
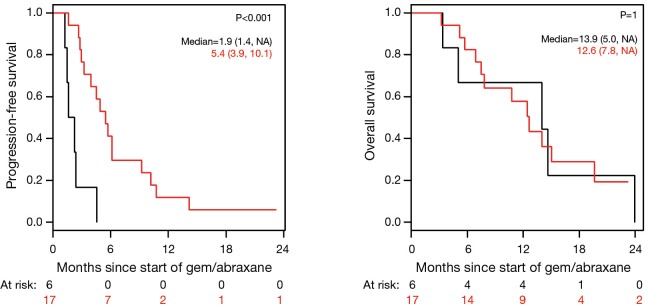
Patients on second-line nPG with a best RECIST R-SD and response of partial response (R-CR) demonstrated a statistically significant increase in PFS, with a median of 5.4 mo (95% CI, 3.9–10.1) versus 1.9 mo (95% CI, 1.4–NA) for patients with PD as the best RECIST response (R-PD) (P<0.001), but there was no statistically significant difference in OS (P=0.99) (Figure 4). There were no statistically significant differences in PFS or OS for patients who had R-PR versus R-SD based on CA19-9 or RECIST (Figures S7,S8).
Figure 4.
Progression-free survival (PFS) and overall survival (OS) based on best RECIST response to gemcitabine/nab-paclitaxel (nPG). Black, RECIST 1.1 disease progression; red, RECIST 1.1 stable disease, partial response, and complete response.
Figure S7.

Progression-free survival (PFS) based on best CA19-9 response to gemcitabine/nab-paclitaxel (nPG) since starting nPG. PD, disease progression; SD, stable disease; PR, partial response.
Figure S8.
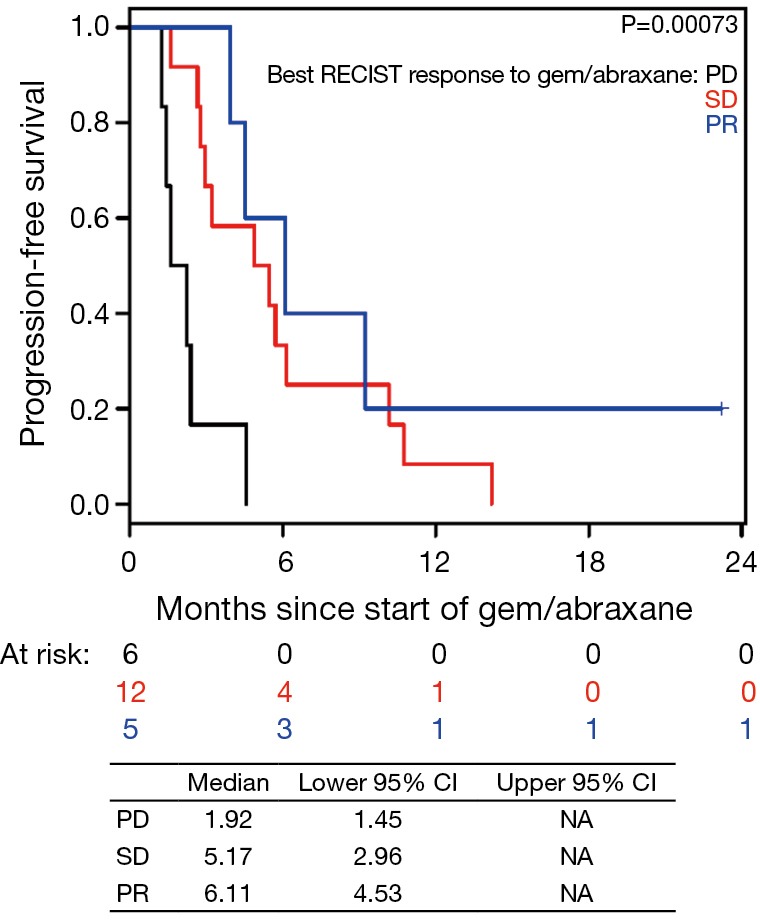
Progression-free survival (PFS) based on best RECIST response to gemcitabine/nab-paclitaxel (nPG) since starting nPG. PD, disease progression; SD, stable disease; PR, partial response.
Toxicity profile (nPG and FOLFIRINOX)
During FOLFIRINOX therapy, fatigue (87%) was the most common side effect sustained by patients, with six (20%) patients requiring either a change in therapy or dose adjustment for this reason. At the completion of nPG, fatigue was still the most common adverse event noted, however only one patient reported grade >2 fatigue; the majority (25, 83%) of patients reported grade 1 or 2 toxicity. Neuropathy due to FOLFIRINOX was a common complication, with 13 (43%) of patients having grade 1 or 2 toxicity and 1 (3%) with reported grade 3 neuropathy. With nPG, neuropathy occurred in 19 (63%) patients with grade 1 or 2 neuropathy and one (3%) patient with grade 3 neuropathy. Of the 19 patients having neuropathy during nPG, 11 patients had prior neuropathy during FOLFIRINOX. Nine (30%) patients reported new neuropathy symptoms and three (10%) patients developed worsening neuropathy during nPG. There was one patient (3%) who stopped nab-paclitaxel due to the onset of new neuropathic complications. The majority of the grade 3 or 4 toxicities with nPG were related to myelosuppression (anemia, thrombocytopenia, lymphopenia, and neutropenia), as noted in Table 2. nPG was stopped for one patient due to gemcitabine-associated thrombotic thrombocytopenic purpura (TTP). One patient on nPG had to stop therapy due to severe hepatic dysfunction from their tumor burden. There were three patients who had to change treatment to third-line therapy due to toxicity and side effects (nab-paclitaxel induced neuropathy, hepatic toxicity, and gemcitabine associated TTP).
Table 2. Toxicity profile of gemcitabine/nab-paclitaxel (nPG).
| CTCAE toxicity | Grade 1–2, n [%] | Grade 3–4, n [%] |
|---|---|---|
| Constitutional | ||
| Fatigue | 25 [83] | 1 [3] |
| Anorexia | 15 [50] | 0 [0] |
| Pain | 2 [7] | 0 [0] |
| Gastrointestinal | ||
| Constipation | 9 [30] | 0 [0] |
| Diarrhea | 11 [37] | 1 [3] |
| Abdominal pain | 12 [40] | 1 [3] |
| Nausea | 10 [33] | 5 [17] |
| Infectious disease | ||
| All infection | 8 [7] | 2 [6] |
| Pulmonary | ||
| Dyspnea | 3 [10] | 0 [0] |
| Cardiovascular | ||
| Hypertension | 0 [0] | 1 [3] |
| Edema | 13 [43] | 0 [0] |
| Thromboembolism | 1 [3] | 0 [0] |
| Renal | ||
| Acute kidney injury | 2 [7] | 0 [0] |
| Skin | ||
| Alopecia | 6 [20] | 0 [0] |
| Rash | 5 [17] | 0 [0] |
| Neurological | ||
| Neuropathy | 19 [63] | 1 [3] |
| Laboratory hematologic | ||
| Neutropenia | 7 [23] | 0 [0] |
| Anemia | 20 [67] | 7 [23] |
| Lymphopenia | 14 [47] | 2 [7] |
| Thrombocytopenia | 13 [43] | 10 [33] |
Discussion
Pancreatic cancer is a major cause of death whose incidence is on the rise. It is expected to become the second leading cause of cancer death by 2030 (13). With this in mind, maximizing available treatment options is critical. FOLFIRINOX remains a preferred standard of care option in patients who can tolerate this regimen. With the addition of nPG, the options of therapy available have increased. However, following initial therapy with either of these combinations further therapy options remain controversial. This study was undertaken to elucidate the potential benefits and toxicities of second-line nPG in a mixed academic and community setting.
In our patient population, we found that the median overall PFS and OS were 7.2 mo (95% CI, 6.2–10.7) and 13.7 mo (95% CI, 11.0–17.7), respectively, for patients receiving first-line FOLFIRINOX followed by second-line nPG. These data are comparable to historical data from the first-line FOLFIRINOX study, which demonstrated a median PFS and median OS of 6.4 mo (95% CI, 5.5–7.2) and 11.1 mo (95% CI, 9.0–13.1) respectively (2). From the start of nPG, the median PFS and OS were 3.7 mo (95% CI, 2.7–6.1) and 12.4 mo (95% CI, 6.8–15.0) respectively. These data compare favorably to the MPACT data, which demonstrated a median PFS of 5.5 mo (95% CI, 4.5–5.9) and median OS of 8.7 mo (95% CI, 7.9–9.7) in the first-line setting (3,4). Compared to the first-line MPACT study, the median PFS in this study was shorter, while median OS longer. However, the respective confidence intervals overlap.
Previously, Portal et al. described their experience with nPG after FOLFIRINOX failure (14). In their analyses, 57 patients were treated with nPG after failure of FOLFIRINOX for a median of four cycles (range, 1–12). They revealed a disease control rate of 58% and a 17.5% objective response rate based on RECIST 1.1 criteria. Median OS was 8.8 mo (95% CI, 6.2–9.7) with a median PFS of 5.1 mo (95% CI, 3.2–6.2). Our patients had a slightly lower median PFS of 3.7 mo, but an improved median OS rate of 12.4 mo. Based on best RECIST 1.1 response, our patients had a disease control rate of 73% and a 22% objective response rate. In the previous study by Portal et al., median OS for the combination of FOLFIRINOX followed by nPG was 18 mo. In the present study, the median OS was 13.8 mo, lower than that seen in the Portal et al. study. It appears that our patient population did not tolerate first-line FOLFIRINOX as well as those included in the previous paper. In the study by Portal et al., the median number of FOLFIRINOX cycles was 12, whereas in the present study the median number was four. This likely accounts for the observed difference in total median PFS and median OS between the two studies. The reason for this observation may be due to differences in our patient populations and treating physician familiarity with treating side effects of FOLFIRINOX. The median age of the evaluable patients in the current study was slightly older (63 vs. 59.9 years) than the Portal study, and a significant number of patients in this study received their care in the community setting where physicians may perhaps have less experience with managing FOLFIRINOX. It is interesting to note the difference between the median OS since initiation of FOLFIRINOX and the median OS since initiation of nPG in our study was relatively short at only 1.3 mo. This suggests that our patients did not derive a significant benefit from FOLFIRINOX, likely due to poor response or intolerance. However, the conclusion regarding the efficacy of nPG after FOLFIRINOX remains concordant between the two studies.
Significant data exist for the use of CA19-9 in the screening, pre-operative, postoperative, and metastatic settings as a predictive and prognostic marker to therapy (7,10). CA19-9 has been evaluated by O’Brien et al. as a screening biomarker for pancreatic cancer with noted 95% specificity and sensitivity of 68% at 1 year and 53% at 2 years before diagnosis of pancreatic cancer (15). Wentz and colleagues demonstrated that CA19-9 is an independent prognostic factor following curative resection of pancreatic adenocarcinoma (16). The cut-off of 1,000 units/mL for CA19-9 was used in this study because, previously, Maisey and colleagues were able to demonstrate that baseline CA19-9 above or below 968 µnits/mL is associated as an independent marker for OS (17). In a study by Hartwig et al., pre-operative CA19-9 level was evaluated in 1,626 consecutive patients who underwent primary pancreatic adenocarcinoma surgery and was noted to predict tumor resectability, stage of disease, and survival. The R0 rate was 15% in patients with CA19-9 greater or equal to 1,000 units/mL (18). It has also been noted that a decrease in CA19-9 postoperatively and postoperative CA19-9 of less than 200 units/mL were strong independent predictors of survival (19). In a previously published study, a CA19-9 response of greater than 50% during neoadjuvant therapy was associated with improved OS in addition to rate of R0 resection and pathologic response (20). CA19-9 has also been evaluated in the adjuvant and metastatic settings. The degree of CA19-9 response predicts how patients are responding to therapy. Post-treatment CA19-9 which has decreased by 25–90% is correlated with an improved median OS (11,21-24).
In the current study, we observed that CA19-9 response during nPG treatment is associated with favorable response to therapy (Figures 2,3). At the end of nPG data cutoff, there were 13 (43%) patients remaining in PR based on CA19-9. Six of these patients are still alive at the time of data collection. These findings of prolonged survival being correlated with CA19-9 response in patients treated with nPG (Figure S9) are similar to those reported in recent updates on the MPACT study. Interestingly, OS was not influenced by RECIST response to nPG (Figures 4,S10). Similar CA19-9 findings were noted in a retrospective study of the ACCORD11 phase III study which demonstrated a longer OS for patient with CA19-9 decrease at 8 weeks (25). These data suggest that CA19-9 is a useful marker to help predict response on nPG therapy and can be utilized to potentially identify those patients receiving particular benefit from second-line nPG therapy.
Figure S9.
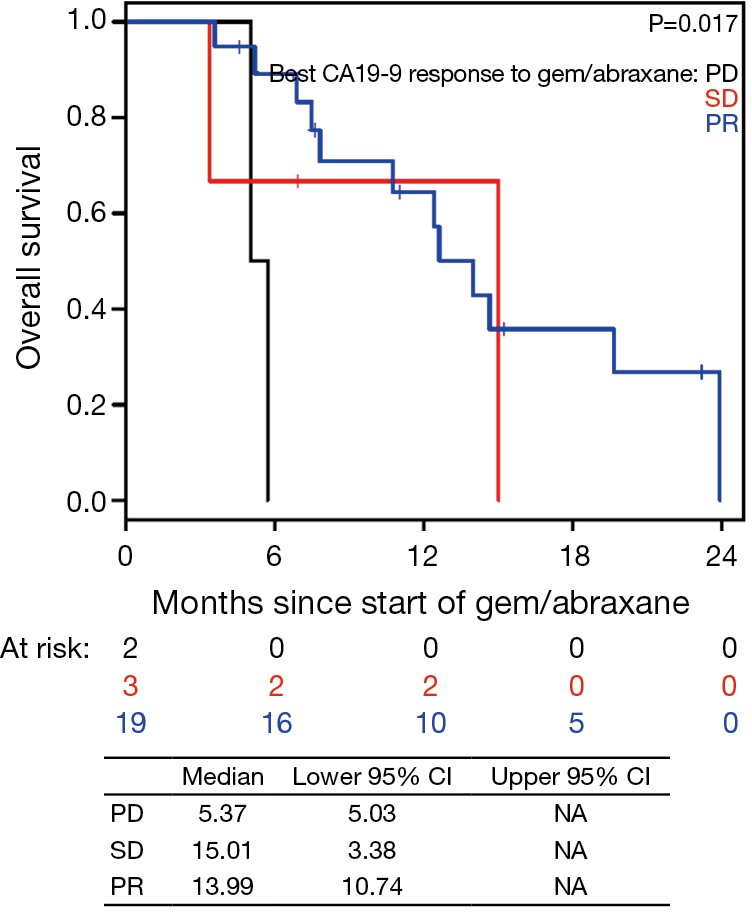
Overall survival (OS) based on best CA19-9 response to gemcitabine/nab-paclitaxel (nPG) since starting nPG. PD, disease progression; SD, stable disease; PR, partial response.
Figure S10.
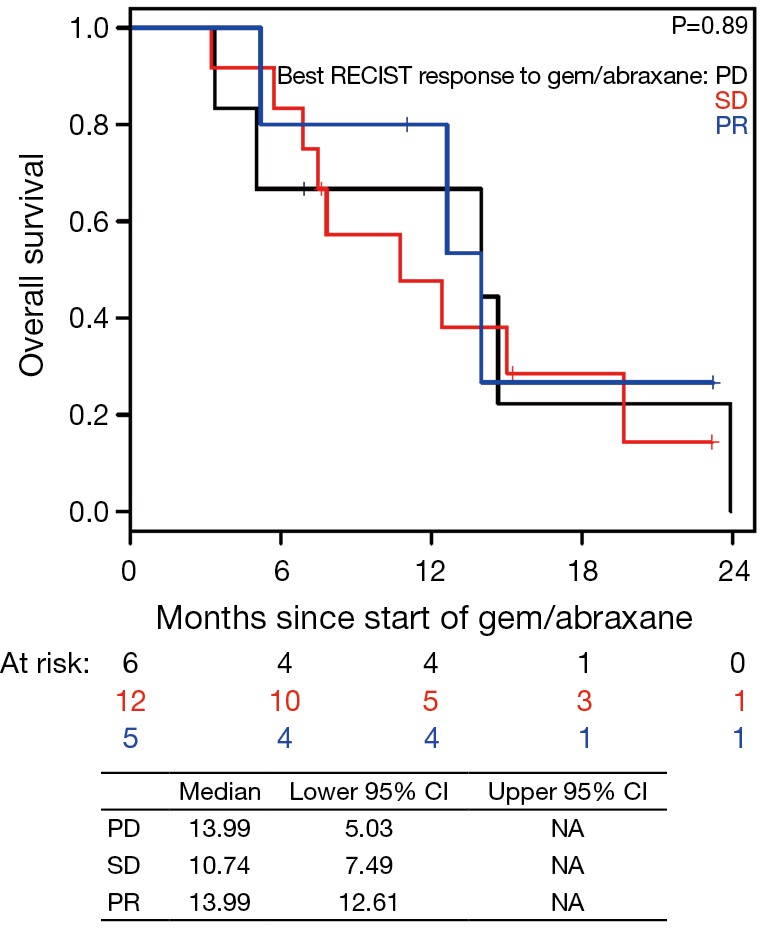
Overall survival (OS) based on best RECIST response to gemcitabine/nab-paclitaxel (nPG) since starting nPG. PD, disease progression; SD, stable disease; PR, partial response.
Toxicity was comparable for patients receiving nPG as to those receiving FOLFIRINOX. Fatigue is comparable between FOLFIRINOX and nPG with 87% and 84% grade 1 or 2 toxicity, respectively. There was one patient with grade 3 fatigue in the nPG group. There seems to be an increase in myelosuppression with nPG as compared to FOLFIRINOX. Grade 3–4 myelosuppression with neutropenia, anemia, lymphopenia, and thrombocytopenia was seen in 26.7% of patients receiving nPG as compared to 15% for patients receiving FOLFIRINOX. These data are likely due to the greater cumulative therapy received by those in the nPG group.
When compared to previous studies with nPG, the toxicity profile seen in our study was comparable to previous reports (3,4). Fatigue, diarrhea, and peripheral neuropathy were the most common non-hematologic adverse events in this study (3,4). Fatigue greater than or equal to grade 3 was noted to be 3% in this study and is similar to previous studies at 9–18% (3,4,14). Diarrhea rated as ≥ grade 3 was 3% in the current study as compared to 2–6% historically (3,4,14). In this study, grade ≥3 nausea was noted to be in 17% of the patients which is slightly higher as compared 3.5% seen by Portal et al. (14). However, grade 3 and 4 neuropathy occurred in only 3% of the current study as opposed to the 12.5–17% seen in previous study (3,4,14). In this study, only one patient stopped nPG secondary to neuropathy. Four patients had to stop nPG due to a combination of side effects.
With regard to hematologic adverse events, there were no noted grade ≥3 and 23% grade 1–2 neutropenia compared to historical grade ≥3 neutropenia rates of 12.5–38% (3,4,14,26). The lower rate in this present study may be due to the liberal use of pegfilgrastim in 47% of the patients. Grade ≥3 anemia was seen in 23% of the patients receiving nPG. This is similar to previous studies demonstrating 3.5–25% grade ≥3 anemia (3,4,14,26). Thrombocytopenia was the most common hematologic adverse event, occurring in 33% of the patients. This is higher than the reported rates of grade ≥3 thrombocytopenia of 6.5–25% (3,4,14,26). This may be related to differences between patient populations.
The majority of these patients (70%) required some form of dose reduction or delay during nPG. Hematologic adverse events were the most common etiologies for dose reduction or delay, with 62% of patients requiring such reductions. These hematologic toxicities are expected given the cumulative burden of chemotherapy induced toxicity. Gastrointestinal adverse events such as nausea, vomiting, and diarrhea were the most common non-hematologic adverse events accounting for 19% of the patients requiring dose reduction or delay. Overall, the overall toxicity profile is tolerable and similar to what has been reported in previous studies. Given these findings, nPG is a well-tolerated regimen in the second-line setting after FOLFIRINOX that appears to offer improvement in PFS and a trend to OS benefit in selected patients.
The limitations to this study are the retrospective design and small sample size. Due to the retrospective nature of the study, there are some data missing due to lack of documentation. Due to obtaining data from multiple facilities from within the University of Pittsburgh Medical Center network, there was heterogeneity in the availability of data from the community oncology centers and major academic center. This implies differences in the treating patterns of physician’s and the type of patients seen at each setting. These patients had differences in timing of second-line therapy, definition of progression, and dose modification. All identified patients were included in the final analysis.
Conclusions
In this study, locally advanced and metastatic pancreatic cancer patients were noted to have a median PFS of 3.7 mo and median OS of 12.4 mo since starting nPG. The overall median PFS and OS were 7.2 and 13.7 mo respectively. Those patients demonstrating stable or improved response by CA19-9 had significantly longer median PFS and median OS. Those with RECIST of stable or partial response demonstrated improved median PFS but not improved median OS. These findings demonstrate that the nPG regimen is a reasonable second-line option for patient who do not tolerate or progress with FOLFIRINOX. Additionally, this study suggests CA19-9 can be used as a predictive marker while these patients are on therapy. Despite previous chemotherapy, second-line nPG is tolerable with the most common toxicities being nausea, fatigue, neuropathy, thrombocytopenia, and anemia. With similarity in DCR, median PFS, and median OS from the time of starting nPG, this current study strengthen the previously reported benefits of nPG, with manageable toxicities in the second-line setting.
Acknowledgements
Funding: This project used the UPCI biostatistics facility that is supported in part by award P30CA047904.
Ethical Statement: The study was approved by the institutional ethics board of University of Pittsburgh (No. PRO15030346) and written informed consent was obtained from all patients.
Footnotes
Conflicts of Interest: The authors have no conflicts of interest to declare.
References
- 1.Moore MJ, Goldstein D, Hamm J, et al. Erlotinib plus gemcitabine compared with gemcitabine alone in patients with advanced pancreatic cancer: a phase III trial of the National Cancer Institute of Canada Clinical Trials Group. J Clin Oncol 2007;25:1960-6. 10.1200/JCO.2006.07.9525 [DOI] [PubMed] [Google Scholar]
- 2.Conroy T, Desseigne F, Ychou M, et al. FOLFIRINOX versus gemcitabine for metastatic pancreatic cancer. N Engl J Med 2011;364:1817-25. 10.1056/NEJMoa1011923 [DOI] [PubMed] [Google Scholar]
- 3.Von Hoff DD, Ervin T, Arena FP, et al. Increased survival in pancreatic cancer with nab-paclitaxel plus gemcitabine. N Engl J Med 2013;369:1691-703. 10.1056/NEJMoa1304369 [DOI] [PMC free article] [PubMed] [Google Scholar]
- 4.Goldstein D, El-Maraghi RH, Hammel P, et al. nab-Paclitaxel plus gemcitabine for metastatic pancreatic cancer: long-term survival from a phase III trial. J Natl Cancer Inst 2015;107.pii:dju413. 10.1093/jnci/dju413 [DOI] [PubMed] [Google Scholar]
- 5.Pelzer U, Schwaner I, Stieler J, et al. Best supportive care (BSC) versus oxaliplatin, folinic acid and 5-fluorouracil (OFF) plus BSC in patients for second-line advanced pancreatic cancer: a phase III-study from the German CONKO-study group. Eur J Cancer 2011;47:1676-81. 10.1016/j.ejca.2011.04.011 [DOI] [PubMed] [Google Scholar]
- 6.Wang-Gillam A, Li CP, Bodoky G, et al. Updated overall survival analysis of NAPOLI-1: Phase III study of nanoliposomal irinotecan (nal-IRI, MM-398), with or without 5-fluorouracil and leucovorin (5-FU/LV), versus 5-FU/LV in metastatic pancreatic cancer (mPAC) previously treated with gemcitabine-based therapy. J Clin Oncol 2016;34 suppl 4S;abstr 417.
- 7.Boeck S, Stieber P, Holdenrieder S, et al. Prognostic and therapeutic significance of carbohydrate antigen 19-9 as tumor marker in patients with pancreatic cancer. Oncology 2006;70:255-64. 10.1159/000094888 [DOI] [PubMed] [Google Scholar]
- 8.Hammad N, Heilbrun LK, Philip PA, et al. CA19-9 as a predictor of tumor response and survival in patients with advanced pancreatic cancer treated with gemcitabine based chemotherapy. Asia Pac J Clin Oncol 2010;6:98-105. 10.1111/j.1743-7563.2010.01290.x [DOI] [PMC free article] [PubMed] [Google Scholar]
- 9.Katz MH, Varadhachary GR, Fleming JB, et al. Serum CA 19-9 as a marker of resectability and survival in patients with potentially resectable pancreatic cancer treated with neoadjuvant chemoradiation. Ann Surg Oncol 2010;17:1794-801. 10.1245/s10434-010-0943-1 [DOI] [PMC free article] [PubMed] [Google Scholar]
- 10.Ballehaninna UK, Chamberlain RS. The clinical utility of serum CA 19-9 in the diagnosis, prognosis and management of pancreatic adenocarcinoma: An evidence based appraisal. J Gastrointest Oncol 2012;3:105-19. [DOI] [PMC free article] [PubMed] [Google Scholar]
- 11.Bauer TM, El-Rayes BF, Li X, et al. Carbohydrate antigen 19-9 is a prognostic and predictive biomarker in patients with advanced pancreatic cancer who receive gemcitabine-containing chemotherapy: a pooled analysis of 6 prospective trials. Cancer 2013;119:285-92. 10.1002/cncr.27734 [DOI] [PMC free article] [PubMed] [Google Scholar]
- 12.Agresti A. Categorical Data Analysis. Hoboken, NJ, USA: John Wiley & Sons, Inc., 2002. [Google Scholar]
- 13.Rahib L, Smith BD, Aizenberg R, et al. Projecting cancer incidence and deaths to 2030: the unexpected burden of thyroid, liver, and pancreas cancers in the United States. Cancer Res 2014;74:2913-21. 10.1158/0008-5472.CAN-14-0155 [DOI] [PubMed] [Google Scholar]
- 14.Portal A, Pernot S, Tougeron D, et al. Nab-paclitaxel plus gemcitabine for metastatic pancreatic adenocarcinoma after Folfirinox failure: an AGEO prospective multicentre cohort. Br J Cancer 2015;113:989-95. 10.1038/bjc.2015.328 [DOI] [PMC free article] [PubMed] [Google Scholar]
- 15.O’Brien DP, Sandanayake NS, Jenkinson C, et al. Serum CA19-9 is significantly upregulated up to 2 years before diagnosis with pancreatic cancer: implications for early disease detection. Clin Cancer Res 2015;21:622-31. 10.1158/1078-0432.CCR-14-0365 [DOI] [PMC free article] [PubMed] [Google Scholar]
- 16.Wentz SC, Zhao ZG, Shyr Y, et al. Lymph node ratio and preoperative CA 19-9 levels predict overall survival and recurrence-free survival in patients with resected pancreatic adenocarcinoma. World J Gastrointest Oncol 2012;4:207-15. 10.4251/wjgo.v4.i10.207 [DOI] [PMC free article] [PubMed] [Google Scholar]
- 17.Maisey NR, Norman AR, Hill A, et al. CA19-9 as a prognostic factor in inoperable pancreatic cancer: the implication for clinical trials. Br J Cancer 2005;93:740-3. 10.1038/sj.bjc.6602760 [DOI] [PMC free article] [PubMed] [Google Scholar]
- 18.Hartwig W, Strobel O, Hinz U, et al. CA19-9 in potentially resectable pancreatic cancer: perspective to adjust surgical and perioperative therapy. Ann Surg Oncol 2013;20:2188-96. 10.1245/s10434-012-2809-1 [DOI] [PubMed] [Google Scholar]
- 19.Ferrone CR, Finkelstein DM, Thayer SP, et al. Perioperative CA19-9 levels can predict stage and survival in patients with resectable pancreatic adenocarcinoma. J Clin Oncol 2006;24:2897-902. 10.1200/JCO.2005.05.3934 [DOI] [PMC free article] [PubMed] [Google Scholar]
- 20.Boone BA, Steve J, Zenati MS, et al. Serum CA 19-9 response to neoadjuvant therapy is associated with outcome in pancreatic adenocarcinoma. Ann Surg Oncol 2014;21:4351-8. 10.1245/s10434-014-3842-z [DOI] [PubMed] [Google Scholar]
- 21.Ko AH, Hwang J, Venook AP, et al. Serum CA19-9 response as a surrogate for clinical outcome in patients receiving fixed-dose rate gemcitabine for advanced pancreatic cancer. Br J Cancer 2005;93:195-9. 10.1038/sj.bjc.6602687 [DOI] [PMC free article] [PubMed] [Google Scholar]
- 22.Tsutsumi K, Kawamoto H, Hirao K, et al. Monitoring of CA19-9 and SPan-1 can facilitate the earlier confirmation of progressing pancreatic cancer during chemotherapy. Pancreatology 2012;12:409-16. 10.1016/j.pan.2012.07.009 [DOI] [PubMed] [Google Scholar]
- 23.Yang GY, Malik NK, Chandrasekhar R, et al. Change in CA 19-9 levels after chemoradiotherapy predicts survival in patients with locally advanced unresectable pancreatic cancer. J Gastrointest Oncol 2013;4:361-9. [DOI] [PMC free article] [PubMed] [Google Scholar]
- 24.Chiorean EG, Von Hoff DD, Reni M, et al. CA19-9 decrease at 8 weeks as a predictor of overall survival in a randomized phase III trial (MPACT) of weekly nab-paclitaxel plus gemcitabine vs gemcitabine alone in patients with metastatic pancreatic cancer. Ann Oncol 2016;27:654-60. 10.1093/annonc/mdw006 [DOI] [PMC free article] [PubMed] [Google Scholar]
- 25.Robert M, Jarlier M, Conroy T, et al. Retrospective analysis of CA19-9 decrease in patients with metastatic pancreatic carcinoma treated with FOLFIRINOX or gemcitabine in a randomized phase III study (ACCORD11/PRODIGE4). J Clin Oncol 2014;32 suppl;abstr 4115. [DOI] [PubMed]
- 26.Zhang Y, Hochster H, Stein S, et al. Gemcitabine plus nab-paclitaxel for advanced pancreatic cancer after first-line FOLFIRINOX: single institution retrospective review of efficacy and toxicity. Exp Hematol Oncol 2015;4:29. 10.1186/s40164-015-0025-y [DOI] [PMC free article] [PubMed] [Google Scholar]


