

Summary
Transgenic Bt rice expressing the insecticidal proteins derived from Bacillus thuringiensis Berliner (Bt) has been developed since 1989. Their ecological risks towards non‐target organisms have been investigated; however, these studies were conducted individually, yielding uncertainty regarding potential agroecological risks associated with large‐scale deployment of Bt rice lines. Here, we developed a meta‐analysis of the existing literature to synthesize current knowledge of the impacts of Bt rice on functional arthropod guilds, including herbivores, predators, parasitoids and detritivores in laboratory and field studies. Laboratory results indicate Bt rice did not influence survival rate and developmental duration of herbivores, although exposure to Bt rice led to reduced egg laying, which correctly predicted their reduced abundance in Bt rice agroecosystems. Similarly, consuming prey exposed to Bt protein did not influence survival, development or fecundity of predators, indicating constant abundances of predators in Bt rice fields. Compared to control agroecosystems, parasitoid populations decreased slightly in Bt rice cropping systems, while detritivores increased. We draw two inferences. One, laboratory studies of Bt rice showing effects on ecological functional groups are mainly either consistent with or more conservative than results of field studies, and two, Bt rice will pose negligible risks to the non‐target functional guilds in future large‐scale Bt rice agroecosystems in China.
Keywords: Bt rice, meta‐analysis, non‐target, functional guilds
Introduction
Genetically modified (GM) crops expressing cry genes derived from Bacillus thuringiensis Berliner (Bt) have been grown commercially since 1996 to control target insect pests worldwide (Cohen et al., 2008). GM crops production have been increasing, amounting to 179.7 million ha over 28 countries in 2015 (James, 2015). Despite the substantial economic and environmental benefits of deploying Bt crops (Klumper and Qaim, 2014; Raymond Park et al., 2011), real concerns about their ecological risks continue (Brookes and Barfoot, 2015). These concerns drive contemporary ecological risk assessments designed to guide current and future risk management.
Meta‐analyses have been applied widely in ecological risk assessments of Bt crops on non‐target arthropods (Comas et al., 2014; Naranjo, 2009; Peterson et al., 2011). Marvier et al. (2007) conducted a meta‐analysis to assess the ecological risks of Bt maize and Bt cotton on non‐target invertebrates, and reported that certain non‐target taxa were less abundant in Bt cotton and Bt maize fields compared with insecticide‐free control fields. Naranjo (2009) concluded that negative effects of Bt crops on predators and parasitoids in laboratory tests coincided with lower abundance in fields except for Bt rice and Bt eggplant cropping systems. They detected no differences in the abundances of non‐target organisms in Bt rice fields, while another study revealed reduced spider abundances in Bt rice cropping systems relative to controls (Peterson et al., 2011). These results highlight the need for a comprehensive analysis of the current state of our understanding of ecological risks associated with deploying Bt rice lines on a large scale.
Rice, Oryza sativa L., is one of the world's most important food crops (Zeigler and Barclay, 2008). Since development of the first transgenic Bt rice plant in 1989 (Yang et al., 1989), a series of Bt rice lines, expressing Cry1A, Cry1C, Cry2A or Cry1Ab/Vip3H, had been generated in China (Chen et al., 2011; Li et al., 2016). These lines effectively suppress stem borer, leaf folder and other lepidopteran pests (Chen et al., 2010; Wang et al., 2016; Ye et al., 2001a,b). Their environmental risks towards non‐target arthropods have been fully studied in laboratory and field settings (Chen et al., 2011; Cohen et al., 2008; Li et al., 2016). However, the results varied with transgenic rice lines and/or non‐target taxa, and accurate predictions of the influence of Bt rice on rice agroecosystems remain problematic. In this report, we addressed this issue by developing and presenting an analysis of the accessible literature on the influence of Bt rice on non‐target arthropod ecological functional guilds from laboratory to field conditions in China.
Results
Our database in this analysis contained 282 observations from 40 papers reporting laboratory studies and 585 observations from 27 papers reporting field studies (Tables S1 and S2). Details of the literature search are shown in Figure 1. Most of the data had no publication bias in our database (Figures S1–S3).
Figure 1.

PRISMA flow diagram showing the procedure used for selection of studies for meta‐analysis.
Laboratory studies
Among the three laboratory parameters we assessed, the survival or development of the indicated ecological functional groups were not significantly affected by Bt rice (Figure 2; Table 1). Also, the reproduction of predators, parasitoids and detritivores were similar between Bt and control rice. The effect size of herbivore reproduction was lower following Bt treatments, indicating herbivores on Bt rice laid fewer eggs (Table 1), although the herbivore data including thrips and aphids were highly heterogeneous (I 2 = 93.7%, P heterogeneity < 0.001). We re‐analysed the data after removing the information on thrips and aphids, which, again, revealed a significant reduction in herbivore reproduction (E = −0.449, P < 0.001, I 2 = 35.8%, P heterogeneity = 0.050; Figure S4). We conducted a subgroup analysis to understand the high heterogeneity of the development data on predators. The developmental rates of predators was restrained after feeding on lepidopteran prey from Bt rice (E = 1.754, P < 0.001; Figure S5), while other subgroups did not significantly affect by Bt rice.
Figure 2.
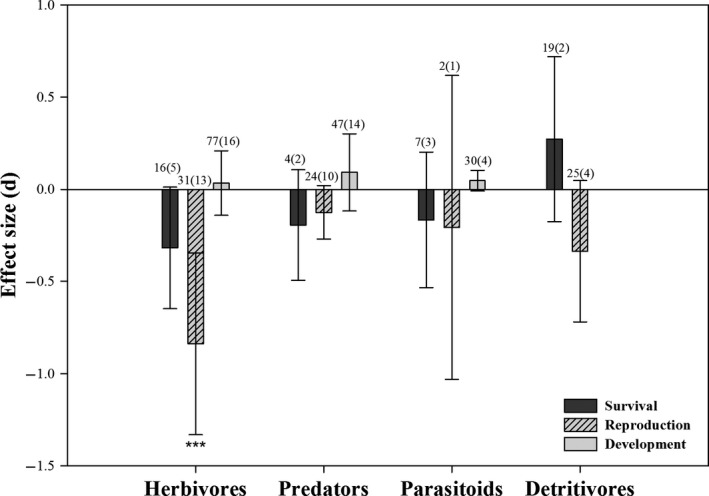
Meta‐analysis of laboratory studies examining the influence of Bt rice on non‐target ecological functional guilds biological parameters. For the development of detritivores, no data could be collected to conduct the analysis. Effect size (E) is Hedges’d, and error bars represent bias‐corrected 95% CI (confidence interval). Values above each bar indicate the total number of studies for each group (number of papers). Asterisks denote significant differences in the observed effect sizes among the comparisons (*P < 0.05; **P < 0.01; ***P < 0.001).
Table 1.
Influence of Bt rice on survival, development and reproduction of the ecological functional groups in laboratory
| Functional guilds | Survival | Reproduction | Development | |||
|---|---|---|---|---|---|---|
| E (95% CI) | P | E (95% CI) | P | E (95% CI) | P | |
| Herbivores | −0.318 (−0.648 to 0.012) | 0.059 | −0.838 (−1.331 to 0.345) | <0.001 | 0.034 (−0.141 to 0.208) | 0.707 |
| Parasitoids | −0.166 (−0.534 to 0.202) | 0.376 | −0.207 (−1.031 to 0.617) | 0.622 | 0.047 (−0.009 to 0.102) | 0.098 |
| Predators | −0.194 (−0.494 to 0.106) | 0.205 | −0.125 (−0.270 to 0.019) | 0.089 | 0.092 (−0.117 to 0.301) | 0.386 |
| Detritivores | 0.272 (−0.175 to 0.719) | 0.233 | −0.336 (−0.719 to 0.048) | 0.086 | – | – |
E = effect sizes, P = significance level, CI = confidence interval. ‘–’ means that no data could be collected to conduct the analysis for the development of detritivores.
Field studies
The abundance of non‐target herbivores (E = −0.286, 95% CI = −0.389 to −0.182, P < 0.001; Figure 3), including plant‐feeding thrips on Bt rice (E = −0.591, P < 0.001; Figure 4a), was significantly reduced, compared to controls. Predator abundances on Bt rice did not differ from controls (E = −0.028, 95% CI = −0.140 to 0.085, P = 0.629; Figure 3). The densities of three main predatory orders, Araneae, Hemiptera and Coleoptera, were similar between Bt rice and the control (Figure 4b). There was a slight reduction for the abundance of parasitoids in Bt rice paddies (E = −0.444, 95% CI = −0.882 to −0.005, P = 0.048). Populations of detritivores increased in Bt rice fields relative to controls (E = 0.309, 95% CI = 0.026 to 0.592, P = 0.032), possibly due to higher abundance of Collembola (E = 0.280, P = 0.016; Figure 4c).
Figure 3.

Meta‐analysis of field studies examining the influence of Bt rice on non‐target ecological functional guilds abundances. Asterisks denote significant differences in the observed effect sizes among the comparisons (*P < 0.05; **P < 0.01; ***P < 0.001).
Figure 4.

Meta‐analyses of field studies examining the influence of Bt rice on the taxa abundance of herbivores (a), predators (b) and detritivores (c). Asterisks denote significant differences in the observed effect sizes among the comparisons (*P < 0.05; **P < 0.01; ***P < 0.001).
Discussion
Many arthropods provide numerous ecosystem services in rice agricultural systems, such as biological control, pollination, crop residue decomposition and soil health improvement (Hao et al., 1998; Wolfenbarger et al., 2008). They are classified into ecological functional groups, herbivores, predators, parasitoids and detritivores, based on ecosystem services. Herbivores serve as prey for predators and hosts for parasitoids (Norris and Kogan, 2005). Predators and parasitoids are important natural enemies of crop pests in agroecosystems (Naranjo, 2005), and detritivores contribute to degrading plant litter and microorganisms (Rusek, 1998). Thus, our meta‐analysis focused on impacts of Bt rice on these ecological functional guilds. We interpret the overarching results to show that the results of laboratory studies are reasonable predictors of the outcomes of field studies.
The fecundity and field abundances of herbivores were significantly suppressed after consuming Bt rice. Thrips and aphids did not account for these differences, because removing the thrips and aphids data did not change the outcome of our analysis. This is reasonable because several studies reported that aphids preferred Bt maize or Bt cotton compared to controls (Faria et al., 2007; Liu et al., 2005). Bt maize and Bt cotton did not impact thrips (Li et al., 2007; Obrist et al., 2005), although they could accumulate Cry protein from Bt cotton (Kumar et al., 2014). Other studies also reported that the brown planthopper, a non‐target sucking pest of Bt rice, laid fewer eggs on Bt rice lines (KMD1 and KMD2) expressing the Cry1Ab protein in laboratory and field surveys (Chen et al., 2007, 2012; Gao et al., 2011). The results of an additional meta‐analysis on planthoppers were consistent with these reports (Figure S6). Our analyses predicate that populations of the non‐target herbivores including thrips and planthoppers in Bt rice fields are no more likely to achieve outbreak levels than insects in non‐Bt rice cropping systems. We speculate that thrips and planthoppers laid fewer eggs on Bt rice because of the direct actions of Bt insecticidal proteins and the indirect impacts of alterations in nutritional qualities of Bt rice plants.
Two recent meta‐analyses reported that predators developed more slowly in tri‐trophic tests involving Bt crop–herbivore–predator systems (Duan et al., 2010; Naranjo, 2009). This pattern may be attributed to the varied types of prey consumed by predators. After feeding on Cry1Ab‐containing rice leafrollers, Cnaphalocrocis medinalis, a Bt‐targeted pest, the Bt protein was present in its predator, the wolf spider, Pirata subpiraticus. However, there was neither a binding protein in the brush border membrane vesicles nor an accumulation with longer feeding time for Cry1Ab in the spider. The authors inferred the spiders suffered elongated development times, possibly due to reduced prey quality (Chen et al., 2009). Romeis et al. (2006) similarly concluded adverse Bt effects on predators were due to the reduced prey quality. Given that there are many prey types in rice fields, we infer that Bt rice does not influence predator abundance in field studies, in agreement with previous studies (Chen et al., 2009; Han et al., 2011; Lu et al., 2016; Tian et al., 2010).
Bt treatments led to small reductions in braconid parasitoid abundances in field, but not laboratory studies (Lu et al., 2014, 2016; Tian et al., 2008). Similarly, Bt maize led to negative effects on the parasitoid Macrocentrus cingulum Brischke (Hymenoptera: Braconidae) in previous meta‐analyses (Duan et al., 2010; Wolfenbarger et al., 2008). These findings indicate that the biological performance of some parasitoid species may be adversely affected by Bt crops after parasitizing Bt‐targeted lepidopteran pests. In our analysis, parasitoids were mainly composed of two families, larval parasitoids, Braconids, which parasitize Bt‐targeted pests and egg parasitoids, Mymaridae, which parasitize non‐targeted pests, such as planthoppers. The pooled effect size was significantly lower in Bt rice fields. The limited number of studies and the different sampling methods may help understand the variance among studies. Our assessment is based on 17 observations from four papers that met our selection criteria (Bai et al., 2012; Lu et al., 2014, 2016; Tian et al., 2008). This small data set may lead to inaccurate assessments of the effect size. Our interpretation is that combining collection methods in the field, specifically, vacuum suction and sticky cards, may lead to a more complete appreciation of parasitoid populations in future.
We found that the number of surviving springtails, juveniles and adults, did not decrease after feeding on Bt rice plant materials or artificial diets containing Bt protein in the laboratory. Contrarily, the number of springtails in Bt rice cropping systems significantly increased. This effect differed from results with other transgenic crops, because Bt maize and Bt cotton did not impact detritivore abundance (Wolfenbarger et al., 2008). A higher abundance of Collembola was collected in Bt rice crops using a vacuum suction method, with no difference in pitfall trap surveys (Lu et al., 2014). We infer the ecological services due to detritivores, decomposing and recycling plant residue, would not be affected by Bt protein in rice agroecosystems.
In total, our results indicated the Bt rice effects on the functional groups obtained from laboratory were not always consistent with that in field trials for the complicated factors existed in paddy agroecosystem. A tiered approach is indispensable to assess the ecological risks of transgenic Bt rice in future (Romeis et al., 2008). There is no doubt that China is playing a leading role in the development and risk assessment of Bt rice (Li et al., 2014), and biosafety certificates for commercial planting of two Bt rice lines (Huahui 1 and Bt Shanyou 63) in Hubei Province have been issued twice by the government in 2009 and 2014 (Li et al., 2016). Quantitative syntheses of the risk assessments of Bt rice would provide a strong evidence for the Chinese policy makers to avoid some disputes caused by German government in 2009 (Marvier, 2011; Ricroch et al., 2010). Despite that the effects of Bt rice in China might be not similar with them in other countries because of the ecology of insects/plants and climate zones varied around the world, it would offer some lessons to the country in which Bt rice is in urgent need to be developed.
Moreover, although we tried our best to collect data and conduct the analysis, there were still some limitations. Firstly, we failed to make some comparisons between the treatments of Bt insecticide protein and chemical insecticide for few cases with chemical insecticide. Also, the data of some functional guilds (especially parasitoids and detritivores) seemed to be not enough. With the knowledge accumulated of risk assessment, these aspects will be gradually improved in future.
Experimental procedures
Data search and database production
The database was created by searching the Web of Science (http://isiknowledge.com), PubMed (http://www.ncbi.nlm.nih.gov/pubmed) and China National Knowledge Infrastructure (CNKI, http://www.cnki.net) using the key words ‘(Bt OR Bacillus thuringinesis) AND rice’. The following criteria were applied to screen the studies: (i) transgenic rice expresses one or more Cry proteins and targets lepidopteran pests; (ii) non‐transgenic rice was used as control plants in laboratory and field research; (iii) one or more non‐target arthropods were assessed; (iv) the papers reported data on development, survival and reproduction as response variables for non‐target taxa in laboratory studies, and species abundances in field studies; (v) each study reported means accompanied by standard deviations (SD) or standard error (SE) and sample size (n); (vi) all studies were conducted in China and published in English or Chinese up to September 2016.
To build the database, we followed the formulation described by Marvier et al. (2007). For each study, we recorded authors and journal information, details about the Bt rice (Cry protein, transgenic event and its control), the non‐target group (taxonomy, functional guild and stage) and the experimental treatment with its control. We also recorded study location, cultivation, plot size, exposure method, sampling method and other methodological details. If a study reported figures without numerical data, we used ImageJ software version 1.45 to measure means and its variance (Abràmoff et al., 2004). We contacted authors to obtain details when needed.
We developed data eligibility criteria for laboratory and field studies. For laboratory studies, we used (i) total eggs per female for reproduction, immature stage survival rate, adult emergence and pupation rate, but not egg‐hatching data for survival; (ii) we selected the separately recorded male and female development time and the entire time span of larval or nymphal development; (iii) if studies reported multiple generation effects, we used the last generation for analyses. The criteria for field studies were (i) we chose the seasonal means and, when they were not available, the peak abundance; (ii) when multiple life‐stage data was reported in one study, we chose the larval or nymphal abundance; (iii) we used the ecological functional groups, not individual species. However, when analysing by taxonomic group, we used the individual species.
We identified the ecological functional guilds specified in the original papers. If a paper did not identify the guilds, we classified the non‐target taxa into five functional guilds: parasitoids, predators, herbivores, detritivores and others, following the description of Liu et al. (2003; Table S3).
Data analysis
Before the quantitative data synthesis, publication bias of the database was conducted by a funnel plot with the Begg–Mazumdar rank correlation test and Egger's regression test (Begg and Mazumdar, 1994; Egger et al., 1997; Haworth et al., 2016). A symmetrical funnel plot showed no publication bias of the data (Field and Gillett, 2010). Trim‐and‐fill method was used to balance the asymmetrical funnel plot (Duval and Tweedie, 2000).
A weighted mean effect size (E), Hedges’d, was used to calculate the difference between an experimental (Bt) and the control (non‐Bt) mean divided by the pooled standard deviation and weighted by the reciprocal of the sampling variance (Hedges and Olkin, 1985). A negative effect size value indicates the Bt group had lower abundance, fecundity, survival or shorter development time compared with the non‐Bt group, and a positive value indicates these parameters were higher or longer than controls. For hypothesis testing, we used the parametric 95% confidence interval (CI) to test the results. If the interval enclosed zero, we took the effect size as not significantly different from zero. We assessed heterogeneity with the Q test and I 2 statistic. When the I 2 value was larger than 50% and P heterogeneity < 0.001, we considered the data highly heterogeneous and conducted subgroup analysis to analyse the high heterogeneity. The random‐effect model was the more appropriate method to carry out all the analysis for the data included in the analysis came from different research groups (Borenstein et al., 2009; Schmidt et al., 2009). All the analyses were conducted using the STATA software version 12.0 (STATA Crop, College Station, TX).
Conflict of interest
The authors declare no conflicts of interest.
Supporting information
Figure S1 Publication bias test for the laboratory data.
Figure S2 Publication bias test for the field data.
Figure S3 Trim‐and‐fill method to explain the publication bias of the abundance data of herbivores and parasitoids.
Figure S4 Meta‐analysis of laboratory studies examining non‐target effects of transgenic Bt rice on herbivores reproduction.
Figure S5 Meta‐analysis of laboratory studies examining non‐target effects of transgenic Bt rice on predators development.
Figure S6 Meta‐analysis of laboratory studies and field studies examining non‐target effects of transgenic Bt rice on planthoppers.
Table S1 Summary of meta‐database used in analysis of laboratory studies.
Table S2 Summary of meta‐database used in analysis of field studies.
Table S3 Functional guilds classification in analysis.
Acknowledgements
We greatly thank Dr. Mao Chen (Monsanto Company, 700 Chesterfield Parkway W., GG3I Chesterfield, MO) and Dr. Junce Tian (Zhejiang Academy of Agricultural Sciences, Hangzhou, Zhejiang, 310021, China) for manuscript revision. This work was supported by the National Special Transgenic Project from Chinese Ministry of Agriculture (2016ZX08011‐001 and 2014ZX08011‐001) and China National Science Fund for Innovative Research Group of Biological Control (Grant No. 31321063). Mention of trade names or commercial products in this article is solely for the purpose of providing specific information and does not imply recommendation or endorsement by the US Department of Agriculture. All programs and services of the US Department of Agriculture are offered on a non‐discriminatory basis without regard to race, colour, national origin, religion, sex, age, marital status or handicap.
References
- Abràmoff, M.D. , Magalhães, P.J. and Ram, S.J. (2004) Image processing with ImageJ. Biophotonics Int. 11, 36–42. [Google Scholar]
- Bai, Y.Y. , Yan, R.H. , Ye, G.Y. , Huang, F.N. , Wangila, D.S. , Wang, J.J. and Cheng, J.A. (2012) Field response of aboveground non‐target arthropod community to transgenic Bt‐Cry1Ab rice plant residues in postharvest seasons. Transgenic Res. 21, 1023–1032. [DOI] [PubMed] [Google Scholar]
- Begg, C.B. and Mazumdar, M. (1994) Operating characteristics of a rank correlation test for publication bias. Biometrics, 50, 1088–1101. [PubMed] [Google Scholar]
- Borenstein, M. , Hedges, L.V. , Higgins, J. and Rothstein, H.R. (2009) Introduction to Meta‐analysis. Chichester, UK: John Wiley & Sons, Ltd. https://www.meta-analysis-workshops.com/download/bookChapterSample.pdf [Accessed 2 September 2016] [Google Scholar]
- Brookes, G. and Barfoot, P. (2015) Environmental impacts of genetically modified (GM) crop use 1996–2013: impacts on pesticide use and carbon emissions. GM Crops Food 6, 103–133. [DOI] [PMC free article] [PubMed] [Google Scholar]
- Chen, M. , Liu, Z.C. , Ye, G.Y. , Shen, Z.C. , Hu, C. , Peng, Y.F. , Altosaar, I. et al. (2007) Impacts of transgenic cry1Ab rice on non‐target planthoppers and their main predator Cyrtorhinus lividipennis (Hemiptera: Miridae) – a case study of the compatibility of Bt rice with biological control. Biol. Control 42, 242–250. [Google Scholar]
- Chen, M. , Ye, G.Y. , Liu, Z.C. , Fang, Q. , Hu, C. , Peng, Y.F. and Shelton, A.M. (2009) Analysis of Cry1Ab toxin bioaccumulation in a food chain of Bt rice, an herbivore and a predator. Ecotoxicology, 18, 230–238. [DOI] [PubMed] [Google Scholar]
- Chen, Y. , Tian, J.C. , Shen, Z.C. , Peng, Y.F. , Hu, C. , Guo, Y.Y. and Ye, G.Y. (2010) Transgenic rice plants expressing a fused protein of Cry1Ab/Vip3H has resistance to rice stem borers under laboratory and field conditions. J. Econ. Entomol. 103, 1444–1453. [DOI] [PubMed] [Google Scholar]
- Chen, M. , Shelton, A. and Ye, G.Y. (2011) Insect‐resistant genetically modified rice in China: from research to commercialization. Annu. Rev. Entomol. 56, 81–101. [DOI] [PubMed] [Google Scholar]
- Chen, Y. , Tian, J.C. , Wang, W. , Fang, Q. , Akhtar, Z.R. , Peng, Y.F. , Hu, C. et al. (2012) Bt rice expressing Cry1Ab does not stimulate an outbreak of its non‐target herbivore, Nilaparvata lugens . Transgenic Res. 21, 279–291. [DOI] [PubMed] [Google Scholar]
- Cohen, M.B. , Chen, M. , Bentur, J.S. , Heong, K.L. and Ye, G. (2008) Bt rice in Asia: potential benefits, impact, and sustainability. In: Integration of Insect‐resistant Genetically Modified Crops within IPM Programs ( Romeis, J. , Shelton, A.M. and Kennedy, G.G. , eds), pp. 223–248. Dordrecht: Springer Science + Business Media B. V. [Google Scholar]
- Comas, C. , Lumbierres, B. , Pons, X. and Albajes, R. (2014) No effects of Bacillus thuringiensis maize on nontarget organisms in the field in southern Europe: a meta‐analysis of 26 arthropod taxa. Transgenic Res. 23, 135–143. [DOI] [PubMed] [Google Scholar]
- Duan, J.J. , Lundgren, J.G. , Naranjo, S. and Marvier, M. (2010) Extrapolating non‐target risk of Bt crops from laboratory to field. Biol. Lett. 6, 74–77. [DOI] [PMC free article] [PubMed] [Google Scholar]
- Duval, S. and Tweedie, R. (2000) Trim and fill: a simple funnel‐plot‐based method of testing and adjusting for publication bias in meta‐analysis. Biometrics, 56, 455–463. [DOI] [PubMed] [Google Scholar]
- Egger, M. , Smith, G.D. , Schneider, M. and Minder, C. (1997) Bias in meta‐analysis detected by a simple, graphical test. Br. Med. J. 315, 629–634. [DOI] [PMC free article] [PubMed] [Google Scholar]
- Faria, C.A. , Wackers, F.L. , Pritchard, J. , Barrett, D.A. and Turlings, T.C. (2007) High susceptibility of Bt maize to aphids enhances the performance of parasitoids of lepidopteran pests. PLoS ONE, 2, e600. [DOI] [PMC free article] [PubMed] [Google Scholar]
- Field, A.P. and Gillett, R. (2010) How to do a meta‐analysis. Br. J. Math. Stat. Psychol. 63, 665–694. [DOI] [PubMed] [Google Scholar]
- Gao, M.Q. , Hou, S.P. , Pu, D.Q. , Shi, M. , Ye, G.Y. , Peng, Y.F. and Chen, X.X. (2011) Effects of Bt rice on the number and hatch rate of planthopper eggs and their attack by natural enemies in paddy fields. Acta Entomol. Sin. 54, 467–476. [Google Scholar]
- Han, Y. , Xu, X.L. , Ma, W.H. , Yuan, B.Q. , Wang, H. , Liu, F.Z. , Wang, M.Q. et al. (2011) The influence of transgenic cry1Ab/cry1Ac, cry1C and cry2A rice on non‐target planthoppers and their main predators under field conditions. Agric. Sci. China 10, 1739–1747. [Google Scholar]
- Hao, S.H. , Zhang, X.X. , Cheng, X.N. , Luo, Y.J. and Tian, X.Z. (1998) The dynamics of biodiversity and the composition of nutrition classes and dominant guilds of arthropod community in paddy field. Acta Entomol. Sin. 41, 343–353. [Google Scholar]
- Haworth, M. , Hoshika, Y. and Killi, D. (2016) Has the impact of rising CO2 on plants been exaggerated by meta‐analysis of free air CO2 enrichment studies? Front. Plant Sci. 7, 1153. [DOI] [PMC free article] [PubMed] [Google Scholar]
- Hedges, L.V. and Olkin, I. (1985) Statistical Method for Meta‐analysis. San Diego, CA: Academic Press. http://files.eric.ed.gov/fulltext/ED227133.pdf [Accessed 30 August 2015] [Google Scholar]
- James, C. (2015) Global Status of Commercialized Biotech/GM Crops: 2015. ISAAA Brief, No. 51, Ithaca, NY: ASAAA. http://www.isaaa.org/resources/publications/briefs/51/ [Accessed 20 May 2016] [Google Scholar]
- Klumper, W. and Qaim, M. (2014) A meta‐analysis of the impacts of genetically modified crops. PLoS ONE, 9, e111629. [DOI] [PMC free article] [PubMed] [Google Scholar]
- Kumar, R. , Tian, J.C. , Naranjo, S.E. and Shelton, A.M. (2014) Effects of Bt cotton on Thrips tabaci (Thysanoptera: Thripidae) and its predator, Orius insidiosus (Hemiptera: Anthocoridae). J. Econ. Entomol. 107, 927–932. [DOI] [PubMed] [Google Scholar]
- Li, H.B. , Wu, K.M. , Xu, Y. , Yang, X.R. , Yao, J. and Wang, F. (2007) Studies on population density dynamic of onion thrips in cotton field in the south of Xinjiang. Xinjiang Agric. Sci. 44, 583–586. [Google Scholar]
- Li, Y.H. , Peng, Y.F. , Hallerman, E.M. and Wu, K.M. (2014) Biosafety management and commercial use of genetically modified crops in China. Plant Cell Rep. 33, 565–573. [DOI] [PubMed] [Google Scholar]
- Li, Y.H. , Hallerman, E.M. , Liu, Q.S. , Wu, K.M. and Peng, Y.F. (2016) The development and status of Bt rice in China. Plant Biotechnol. J. 14, 839–848. [DOI] [PMC free article] [PubMed] [Google Scholar]
- Liu, Z.C. , Ye, G.Y. , Hu, C. and Datta, K.S. (2003) Impact of transgenic indica rice with a fused gene of cry1Ab/cry1Ac on the rice paddy arthropod community. Acta Entomol. Sin. 46, 454–465. [Google Scholar]
- Liu, X.D. , Zhai, B.P. , Zhang, X.X. and Zong, J.M. (2005) Impact of transgenic cotton plants on a non‐target pest, Aphis gossypii Glover. Ecol. Entomol. 30, 307–315. [Google Scholar]
- Lu, Z.B. , Tian, J.C. , Han, N.S. , Hu, C. , Peng, Y.F. , Stanley, D. and Ye, G.Y. (2014) No direct effects of two transgenic Bt rice lines, T1C‐19 and T2A‐1, on the arthropod communities. Environ. Entomol. 43, 1453–1463. [DOI] [PubMed] [Google Scholar]
- Lu, Z.B. , Dang, C. , Han, N.S. , Shen, Z.C. , Peng, Y.F. , Stanley, D. and Ye, G.Y. (2016) The new transgenic cry1Ab/vip3H rice poses no unexpected ecological risks to arthropod communities in rice agroecosystems. Environ. Entomol. 45, 518–525. [DOI] [PubMed] [Google Scholar]
- Marvier, M. (2011) Using meta‐analysis to inform risk assessment and risk management. J. Verbrauch. Lebensm. 6, 113–118. [Google Scholar]
- Marvier, M. , McCreedy, C. , Regetz, J. and Kareiva, P. (2007) A meta‐analysis of effects of Bt cotton and maize on nontarget invertebrates. Science, 316, 1475–1477. [DOI] [PubMed] [Google Scholar]
- Naranjo, S.E. (2005) Long‐term assessment of the effects of transgenic Bt cotton on the abundance of nontarget arthropod natural enemies. Environ. Entomol. 34, 1193–1210. [Google Scholar]
- Naranjo, S.E. (2009) Impacts of Bt crops on non‐target invertebrates and insecticide use patterns. Perspect. Agr. Vet. Sci. Nutr. Nat. Resour. 4, 1–23. [Google Scholar]
- Norris, R.F. and Kogan, M. (2005) Ecology of interactions between weeds and arthropods. Annu. Rev. Entomol. 50, 479–503. [DOI] [PubMed] [Google Scholar]
- Obrist, L.B. , Klein, H. , Dutton, A. and Bigler, F. (2005) Effects of Bt maize on Frankliniella tenuicornis and exposure of thrips predators to prey‐mediated Bt toxin. Entomol. Exp. Appl. 115, 409–416. [Google Scholar]
- Peterson, J.A. , Lundgren, J.G. and Harwood, J.D. (2011) Interactions of transgenic Bacillus thuringiensis insecticidal crops with spiders (Araneae). J. Arachnol. 39, 1–21. [Google Scholar]
- Raymond Park, J. , McFarlane, I. , Hartley Phipps, R. and Ceddia, G. (2011) The role of transgenic crops in sustainable development. Plant Biotechnol. J. 9, 2–21. [DOI] [PubMed] [Google Scholar]
- Ricroch, A. , Berge, J.B. and Kuntz, M. (2010) Is the German suspension of MON810 maize cultivation scientifically justified? Transgenic Res. 19, 1–12. [DOI] [PMC free article] [PubMed] [Google Scholar]
- Romeis, J. , Meissle, M. and Bigler, F. (2006) Transgenic crops expressing Bacillus thuringiensis toxins and biological control. Nat. Biotechnol. 24, 63–71. [DOI] [PubMed] [Google Scholar]
- Romeis, J. , Bartsch, D. , Bigler, F. , Candolfi, M.P. , Gielkens, M.M.C. , Hartley, S.E. , Hellmich, R.L. et al. (2008) Assessment of risk of insect‐resistant transgenic crops to nontarget arthropods. Nat. Biotechnol. 26, 203–208. [DOI] [PubMed] [Google Scholar]
- Rusek, J. (1998) Biodiversity of Collembola and their functional role in the ecosystem. Biodivers. Conserv. 7, 1207–1219. [Google Scholar]
- Schmidt, F.L. , Oh, I.S. and Hayes, T.L. (2009) Fixed‐versus random‐effects models in meta‐analysis: model properties and an empirical comparison of differences in results. Br. J. Math. Stat. Psychol. 62, 97–128. [DOI] [PubMed] [Google Scholar]
- Tian, J.C. , Liu, Z.C. , Yao, H.W. , Ye, G.Y. and Peng, Y.F. (2008) Impact of transgenic rice with a cry1Ab gene on parasitoid subcommunity structure and the dominant population dynamics of parasitoid wasps in rice paddy. J. Environ. Entomol. 30, 1–7. [Google Scholar]
- Tian, J.C. , Liu, Z.C. , Chen, M. , Chen, Y. , Chen, X.X. , Peng, Y.F. , Hu, C. et al. (2010) Laboratory and field assessments of prey‐mediated effects of transgenic Bt rice on Ummeliata insecticeps (Araneida: Linyphiidae). Environ. Entomol. 39, 1369–1377. [DOI] [PubMed] [Google Scholar]
- Wang, Y.N. , Ke, K.Q. , Li, Y.H. , Han, L.Z. , Liu, Y.M. , Hua, H.X. and Peng, Y.F. (2016) Comparison of three transgenic Bt rice lines for insecticidal protein expression and resistance against a target pest, Chilo suppressalis (Lepidoptera: Crambidae). Insect Sci. 23, 78–87. [DOI] [PubMed] [Google Scholar]
- Wolfenbarger, L.L. , Naranjo, S.E. , Lundgren, J.G. , Bitzer, R.J. and Watrud, L.S. (2008) Bt crop effects on functional guilds of non‐target arthropods: a meta‐analysis. PLoS ONE, 3, e2118. [DOI] [PMC free article] [PubMed] [Google Scholar]
- Yang, H. , Li, J. , Guo, S. , Chen, X. and Fan, Y. (1989) Transgenic rice plants produced by direct uptake of δ‐endotoxin protein gene from Bacillus thuringenesis into rice protoplasts. Sci. Agric. Sin. 22, 1–5. [Google Scholar]
- Ye, G.Y. , Shu, Q.Y. , Yao, H.W. , Cui, H.R. , Cheng, X.Y. , Hu, C. , Xia, Y.W. et al. (2001a) Field evaluation of resistance of transgenic rice containing a synthetic cry1Ab gene from Bacillus thuringiensis Berliner to two stem borers. J. Econ. Entomol. 94, 271–276. [DOI] [PubMed] [Google Scholar]
- Ye, G.Y. , Tu, J.M. , Hu, C. , Datta, K. and Datta, S.K. (2001b) Transgenic IR72 with fused Bt gene cry1Ab/cry1Ac from Bacillus thuringiensis is resistant against four lepidopteran species under field conditions. Plant Biotechnol. 18, 125–133. [Google Scholar]
- Zeigler, R.S. and Barclay, A. (2008) The relevance of rice. Rice, 1, 3–10. [Google Scholar]
Associated Data
This section collects any data citations, data availability statements, or supplementary materials included in this article.
Supplementary Materials
Figure S1 Publication bias test for the laboratory data.
Figure S2 Publication bias test for the field data.
Figure S3 Trim‐and‐fill method to explain the publication bias of the abundance data of herbivores and parasitoids.
Figure S4 Meta‐analysis of laboratory studies examining non‐target effects of transgenic Bt rice on herbivores reproduction.
Figure S5 Meta‐analysis of laboratory studies examining non‐target effects of transgenic Bt rice on predators development.
Figure S6 Meta‐analysis of laboratory studies and field studies examining non‐target effects of transgenic Bt rice on planthoppers.
Table S1 Summary of meta‐database used in analysis of laboratory studies.
Table S2 Summary of meta‐database used in analysis of field studies.
Table S3 Functional guilds classification in analysis.