Screening methods that use traditional genomic 1, 2, 3, transcriptional 4, proteomic 5, 6, and metabonomic7 signatures to characterise drug mechanisms exist. However, they are time-consuming and require specialised equipment. Here, we present a high-throughput multi-channel sensor platform that can profile the mechanisms of various chemotherapeutic drugs in minutes. The sensor consists of a gold nanoparticle (AuNP) complexed with three different fluorescent proteins (FPs) that can sense drug-induced physicochemical changes on cell surfaces8,9,10. In the presence of cells, FPs are rapidly displaced from the AuNP surface and fluorescence restored. Fluorescence "turn on" of the FPs depends on the drug-induced cell surface changes, generating patterns that identify specific mechanisms of cell death induced by drugs. The nanosensor is generalisable to different cell types and does not require processing steps prior to analysis, offering an effective way to expedite research in drug discovery, toxicology and cell-based sensing.
Rapid determination of the mechanism of drug candidates would greatly facilitate the discovery and optimisation of new therapeutics11, particularly in the emerging area of personalised medicine12. Recently, “signature”-based profiling of drug mechanisms has provided a powerful strategy in drug discovery1,2, 13, 14, 15, 16. These screening methods measure a series of molecular/phenotypic changes of cells/multicellular organisms induced by chemotherapeutic agents and create a fingerprint that is used as a reference for uncharacterized compounds. Several signature-based drug screening studies using traditional intracellular biomarkers1–7 require multi-step processing of cells such as extracting biomarker1,2,4,5 or labeling cells6,14 and specialised equipment, limiting adoption of these strategies in rapid drug screening.
Cell surface phenotypes have been utilised in sensing cell states using nanoparticle-based array sensors17,18. These sensors follow a hypothesis-free signature-based strategy14,16,19,20,21,22 that allows them to be “trained” to identify diverse bioanalytes. However, the single channel output of these nanosensors required separate measurements for each array element, and were unable to differentiate between subtle cell surface phenotypic differences arising from different cell death mechanisms. We introduce a new multiplexed three-channel sensor platform created through supramolecular assembly/disassembly of a functionalised AuNP with three FPs. The simultaneous triple-channel fluorescence transduction provides a ratiometric output that enhances the accuracy of measurements. Moreover, the information-rich output allows determination of chemotherapeutic mechanism from a single measurement that provides answers far faster (minutes) than current methods, and using standard laboratory instrumentation.
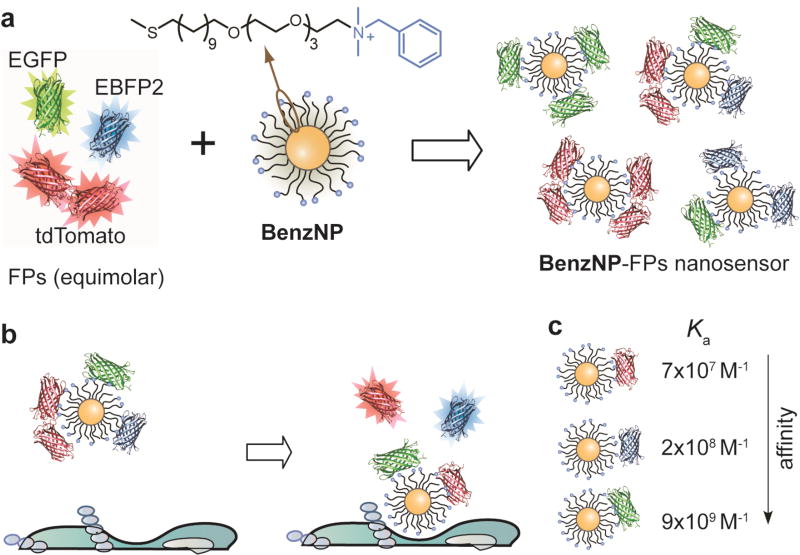
The sensor was generated by non-covalent conjugation of a benzyl headgroup-terminated AuNP (BenzNP, Fig. 1a) with three FPs (EBFP2, EGFP and tdTomato). The FPs serve dual roles of exhibiting differential supramolecular affinities with the particle, and transducing the binding events. BenzNPs were used in the sensor based on our previous studies that indicated its effectiveness in profiling cell surface phenotypes17. In these BenzNP-FP supramolecular complexes, the cationic AuNP binds strongly with the anionic FPs, resulting in quenching of the FP fluorescence by the particle core. The binding equilibria between BenzNP and the FPs are altered in presence of cells due to competitive binding to cell surfaces, resulting in rapid (seconds/minutes) displacement of FPs from the particle surface with consequent restoration of FP fluorescence (Fig. 1b). The fluorescence "turn-on" of the three emission channels differs considerably depending on the signatures of drug-treated cell surfaces.
Figure 1. Assembly and working principle of the nanosensor.
a, Fabrication of the three-channel nanosensor (BenzNP–FPs complex). The sensor was prepared by incubating BenzNP to an equimolar mixture of three FPs at a ratio that was determined through fluorescence titration (Supplementary Fig. 4). b, Schematic diagram illustrating the displacement and fluorescence turn-on of FPs by cell-surface functionalities. c, Differential affinity of BenzNP to tdTomato (red), EBFP2 (blue) and EGFP (green) protein. The association constant (Ka) was determined through titration of equimolar mixture of FPs with BenzNP (Supplementary Table 1).
A key issue in the sensor design is selecting appropriate FPs from the broad range of variants23 such that they provide reproducible sensor responses. Through tests with different FP variants we selected a three colour FP set for the present study: blue (EBFP2), green (EGFP), and red (tdTomato). This optimised set of proteins was selected to: (i) bear net negative charge and feature minimum spectral ‘crosstalk’ with well-separated excitation and emission spectra, obtaining independent responses from each channel, (ii) exist as monomers or tandem dimers, simplifying their use in displacement assays relative to other multimeric analogs, (iii) be photostable, providing reliable outputs.
A second requirement for the FP transducer is differential and reversible interaction with BenzNP recognition element. We determined the binding parameters by fluorescence quenching studies that provided the complex stability constant and association stoichiometry for each FP (Supplementary Fig. 4). It was observed that the binding affinities of BenzNP and FPs varied over three orders of magnitude (Fig. 1c), providing the differential affinity required for multi-channel output.
We demonstrated the ability of the BenzNP-FP sensor platform to categorise chemotherapeutic mechanisms using a set of apoptosis- and necrosis-inducing chemical agents with established mechanisms (Supplementary Table 3, 4). These clinical and experimental drugs cover common mechanisms of therapeutic action in cancer and include several groups with a common target (macromolecule/pathway). The necrotic agents induce cell death by rapid plasma membrane rupture24, which would be expected to generate a strong surface response. Apoptotic drugs cause programmed cell death that is associated with alterations of the plasma membrane including translocation of molecules from the cytosol, as well as suppression of signaling macromolecules8,9,10,24. We tested the hypothesis that these drug-induced cell surface alterations could be rapidly discerned using the nanosensor. We used BT549 human breast cancer cells (triple negative) as a testbed for profiling chemotherapeutic mechanisms, since chemotherapy serves as the only systemic therapy for patients with this type of cancer25.
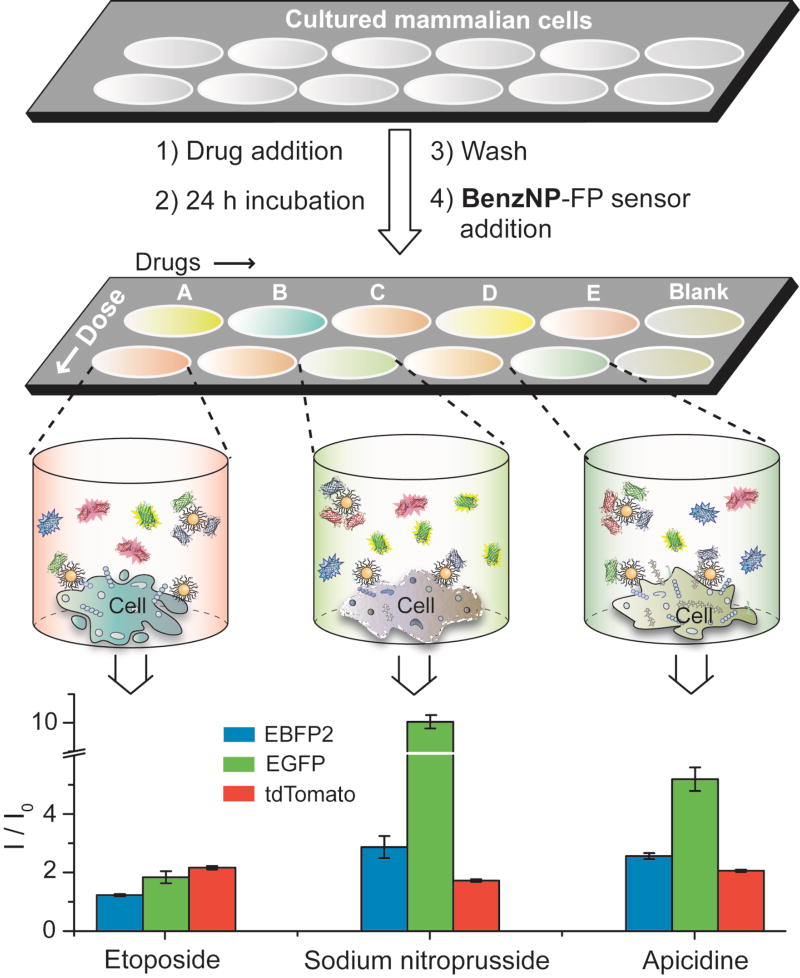
Drug screening studies followed the straightforward protocol shown in Fig. 2. Cell culture, drug treatment, and the sensing studies were carried out in a single well of a 96-well microplate. For consistency, the cells were treated with drugs at their half-maximal inhibitory concentrations (IC50) (Supplementary Fig. 5, Table 3). We confirmed that the number of cells attached to the plate for each drug was consistent, ensuring that sensor differentiation arose from difference in cell surfaces. Notably, the sensor itself did not exhibit any cytotoxicity (Supplementary Fig. 7) and cellular uptake of the particle is negligible within the short experimental time26, making our sensing strategy non-interfering in terms of cell behaviour.
Figure 2. Workflow for nanosensor-based drug screening.
The Schematic diagram illustrates the drug screening workflow. Cells cultured in a 96-well microplate are treated with chemotherapeutic drugs at their IC50 concentrations for 24 h followed by washing and incubation the nanosensor. Different drug-treated cells result in distinct cell surface phenotypes and hence different FP displacement patterns as schematically shown for the three wells. The bar plot shows differential fluorescence responses for three representative drugs that may corroborate with the schematic of FP displacement. The change in fluorescence along three channels was recorded simultaneously (Supplementary Table 11), where I0 and I are the fluorescence intensity before and after the addition of the sensor to the cells, respectively. The responses are averages of eight replicate data and the error bars represent ±standard deviation.
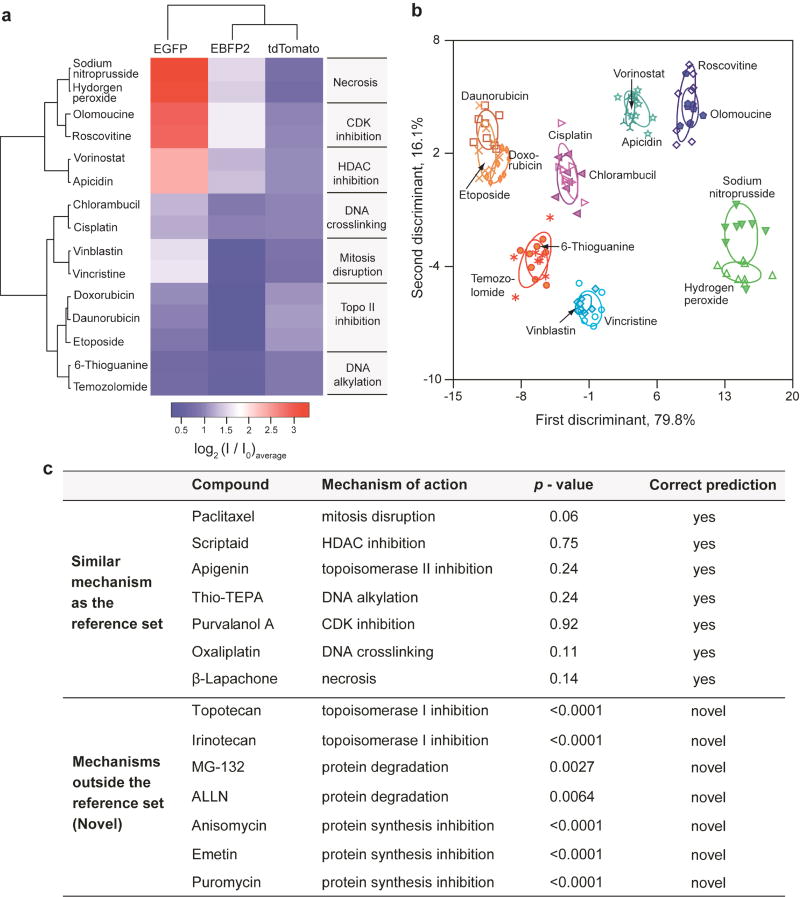
Initially, we used 15 chemotherapeutics that act through different molecular mechanisms (Fig. 3a) to generate a reference set based on fluorescence responses. Upon interaction with the drug-treated cells, the sensor generated characteristic fluorescence fingerprints for the three FPs (see Supplementary Information for discussion on the role of each fluorescence channel). The distinct responses along each FP channel arise from the differential non-covalent interactions such as electrostatic and π–π stacking with the different biomolecules expressed on the drug-treated cell surfaces. Hierarchical clustering analysis (HCA) of the fluorescence responses produced seven distinct clusters (Fig. 3a), each corresponding to an individual molecular mechanism. The differential response pattern in the heat plot demonstrates the sensitivity of the sensor to drug-induced cell surface changes.
Figure 3. Screening of chemotherapeutic drug mechanisms using fluorescence fingerprints.
a, Heat map of the fluorescence response patterns for the reference drug set. Hierarchical clustering was performed on the log-transformed average of the fluorescence responses (Supplementary Table 11) using a correlation metric and average linkage. The resulting dendrograms show the degree of association of the drugs, as well as each FP. Literature-reported mechanisms of each drug (Supplementary Table 3) are listed next to the heat map. b, Clustering the reference drugs via LDA of the fluorescence responses. The canonical scores were obtained from LDA on the fluorescence responses, and were plotted with 95% confidence ellipses around the centroid of each group. c, Probabilistic predictions of drug mechanisms utlising the fluorescence signatures. The p-values were calculated for the averages of eight replicates using the shortest Mahalanobis distance to the centroid of the nearest cluster in the reference set that was derived from LDA. A p-value of <0.01 was considered to be evidence of a “novel” drug mechanism.
The multidimensional sensor data was quantitatively interpreted using linear discriminant analysis (LDA). LDA classified the 15 drugs into seven distinct clusters according to the different pathways/targets of the drugs (Fig. 3b). Notably, drugs with similar molecular mechanisms showed overlapping clusters that were quantifiably distinguishable from other mechanistic categories. The distinctly separate region between the apoptotic and necrotic groups demonstrates the ability of the sensor to demarcate between broader classes of cell death mechanisms. It should be noted that the group size may determine the broadness of each drug category, with some categories amenable to further subdivisions27. We validated the robustness of the LDA method by leave-one-out cross-validation using a Jackknifed analysis. The between-group (mechanism) cross-validation accuracy was 99% (Supplementary Table 6), indicating the trained classifier to be a reliable and robust statistical tool. The generality of our strategy was assessed using another cell line with entirely different genotype/phenotype, viz. pTD cells (murine mammary cancer cells) that provide an important testbed for exploring therapeutics to regulate oncogenic epithelial-mesenchymal transition28. Characteristic fluorescence responses from the drug-treated pTD cells were generated and yielded distinct mechanism-based clusters. These clusters were somewhat different than that observed with BT549, as expected based on the geno/phenotypic difference between cell lines (Supplementary Fig. 10).
The ability to identify the mechanism of lead compounds as either known or novel is a key issue in drug screening. In blinded experiments we assessed seven anticancer agents that exhibit mechanisms similar to the training set. We predicted the mechanism of the test compounds by determining the probability of a compound belonging to the closest reference group using an appropriate F-distribution for the minimum Mahalanobis distance obtained from LDA. Using a cutoff p-value of 0.01, the analysis correctly predicted the molecular mechanisms of the seven test compounds (Fig. 3c), demonstrating the capability of the sensor to screen 'real' unknowns. We next sought to examine if the sensor can identify compounds involving targets/pathways different from the reference set. Seven compounds with “novel” (i.e. outside the reference set) cell death mechanisms were tested using the nanosensor. Implementing the same probabilistic analysis, p-value for each compound was found to be less than 0.01 (Fig. 3c), indicating that the compounds were far from all the training groups and could be readily classified as “novel”. Furthermore, a follow-up LDA solution space including the reference and novel compound set showed clearly distinct clusters, while the drugs with similar targets paired with each other correctly (Supplementary Fig. 11), indicating the ability to update the training set with ‘new’ mechanistic groups with sufficient resolution. We tested the robustness of prediction by studying eight parallel replicates of the blinded unknowns and the novel compounds that resulted in 87.5% (98 of 112 samples) correct prediction (Supplementary Fig. 12). The capability of the sensor to discriminate between learned and potentially new mechanisms demonstrates the ability of the system to avoid false positives in mechanism identification. The ability of the sensor to stratify molecularly targeted drugs such as the HDAC and CDK inhibitors suggests its applicability to broader class of modern targeted drugs (targeting EGFR, HER2, PDGFR, VEGF, proteasome, etc)29 that cause up/downregulation of the receptors on cell surfaces.
Combination therapy provides a complementary strategy to new drug discovery, greatly enhancing the efficacy of chemotherapeutics, e.g. by overcoming the drug resistance of cancer cells30. Drug combinations produce therapeutic activities (synergistic, additive, or antagonistic)31 at different ratios of the individual components. Thus, a cell surface-based quick screening of the therapeutic activities with respect to individual drug mechanisms should lead to predicting the contribution of each drug in their therapeutic combination32,33.
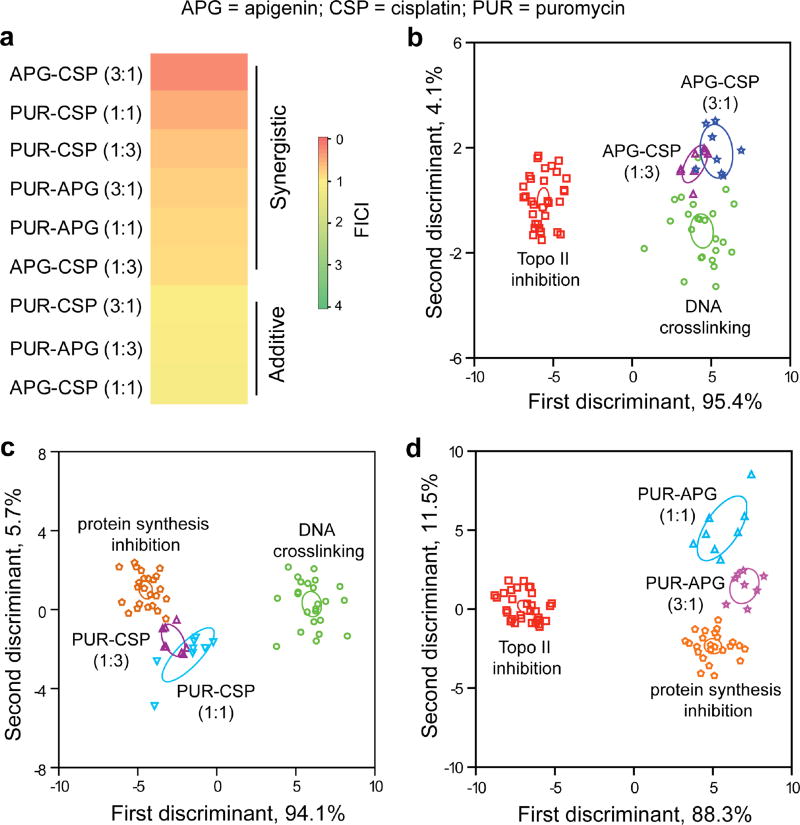
We demonstrated the ability of our sensor to determine mechanistic correlation between individual drugs and their combinations using three apoptotic drugs: apigenin (APG), puromycin (PUR), and cisplatin (CSP). We utilized fractional inhibitory concentration index34 (Supplementary Equation 1) to select the synergistic drug combinations. Interestingly, pairwise interactions of the drugs showed synergy or additivity depending on the ratios of the individual drugs (Fig. 4a). Comparison of the APG-CSP synergistic pairs with the single-drug components indicated that both the combinations exhibited a DNA crosslinking-like mechanism, consistent with previous observations35 of APG enhancing the cytotoxicity of CSP. The LDA scores quantified the similarity of the signatures of APG-CSP synergistic combinations to CSP with p>0.01 (Fig. 4b, Supplementary Table 9). Similarly, the signature of the PUR-CSP(1:3) combinations revealed its close proximity to protein synthesis inhibition-like mechanism (Fig. 4c), suggesting CSP potentiating the PUR-induced cytotoxicity. However, PUR-CSP(1:1) and the PUR-APG synergistic combinations were classified quite far (p<0.01) from their single-drug components (Fig. 4c,d), indicating a mechanistically distinct cell surface phenotypic change that provides a potentially new therapeutic strategy. These representative examples indicate that the sensor can provide an information-rich strategy for predicting the mechanisms of drug combinations.
Figure 4. Profiling the mechanisms of drug combinations.
a, Determination of therapeutic activities of pairwise drug combinations using fractional inhibitory concentration index (FICI)34. The FICI values of different combinations were determined using Supplementary Equation (1) that utilised the IC50 concentrations of the drug combinations obtained from the Alamar blue assays. b,c,d, Correlation of the synergistic combinations of apigenin-cisplatin (b), puromycin-cisplatin (c), and puromycin-apigenin (d) with the single-drug mechanistic categories. The canonical scores were calculated for the pairwise combinations with the mechanistic groups that contain the single-drug components forming the combinations. The LDA-derived scores from the fluorescence responses were plotted with 95% confidence ellipses around the centroid of each group. The mechanistic categories consist of several drugs with the same mechanism (cf. Supplementary Fig. 13), viz. Topo II inhibition: daunorubicin, etoposide, doxorubicin, and apigenin; DNA crosslinking: cisplatin, chlorambucil, and oxaliplatin; Protein synthesis inhibition: anisomycin, emetin, and puromycin. Each drug was used in eight replicates.
In summary, we demonstrated the creation of a novel multichannel sensor based on non-covalent supramolecular complexes. This sensor uses an engineered nanoparticle and three different FPs to provide a three-channel sensor that can be “trained” to detect subtle changes in cell surface properties. This biocompatible nanosensor can identify specific mechanisms induced by different chemotherapeutic agents, using a single well of a microplate, making this strategy applicable to massively high-throughput screening. The simplicity and effectiveness of the system underscores its potential to accelerate drug discovery, greatly facilitating the development of new therapeutics and drug “cocktails”. This sensor system also provides a potential way forward for toxicology, providing a viable method to classify the tens of thousands of commercial chemicals for which no data are available.
Methods
Fluorescent proteins were expressed in Escherichia coli BL21 (DE3) and purified by means of Co2+ affinity chromatography. BenzNP particles (diameter: ~2 nm) were synthesized following a previous report17 and characterized by standard methods. The working stoichiometry of NP-FP conjugate was determined through fluorescence titration. The binding parameters were obtained from nonlinear least-squares curve fitting analysis of the fluorescence responses as a function of concentration of the particles. The sensor was then prepared by incubating 150 nM BenzNP and an equimolar mixture of EBFP2, EGFP, and tdTomato (final concentration of each protein was 100 nM) for 30 min. Before drug screening studies, the IC50 concentration for each drug was determined by incubating different concentrations of drugs with BT549 and pTD cells for 24 h, followed by an Alamar blue assay. Fluorescence intensity of the dye was plotted as a function of percentage viable cells and IC50 was calculated through curve-fitting using a dose response model. Cells were counted using a hemocytometer to confirm the number of cells after drug treatment to be similar for each drug. For the drug screening studies, 10,000 (for BT549) or 15,000 (for pTD) cells/well were cultured in 96-well black-and-clear bottom microplates. Drugs were incubated with the cells at their IC50 concentrations for 24 h in the respective culture media. After washing the cells with phosphate buffered saline, the sensor was incubated with the cells for 15 min and the fluorescence intensities were simultaneously recorded along each fluorescence channel on a Molecular Device Spectramax M3 plate reader using appropriate filters. The fluorescence responses were statistically analyzed using LDA and HCA in Systat and R software. LDA was employed to predict the mechanism of the test compounds by computing their Mahalanobis distance to the center of each of the training groups, followed by determining the probability of the compound belonging to its closest cluster using as appropriate F-distribution for the minimum distance. Detailed description of the methods can be found in the Supplementary Information.
Supplementary Material
Acknowledgments
We are grateful to D. Joseph Jerry for providing us the pTD cell line. We thank Carol Stanier for reading the manuscript and providing useful suggestions. This work was supported by the NIH grant (GM077173) and the NSF Center for Hierarchical Manufacturing grant (CMMI-1025020).
Footnotes
Author contributions
S.R. and V.M.R. conceived the concepts; S.R. designed the experiments; O.R.M. and G.Y. synthesized and characterized the nanoparticle; R.M. and S.R. expressed the fluorescent proteins; S.R., N.L., R.M., K.S. performed the drug screening studies; S.R., R.M., and N.L. analyzed the data with statistical inputs from C.R. and R.B.; S.R. and V.M.R. wrote most of paper with contribution from other authors.
Supplementary information accompanies this paper at www.nature.com/naturenanotechnology.
Competing financial interests
The authors declare no competing financial interests.
References
- 1.Lamb J, et al. The connectivity map: using gene-expression signatures to connect small molecules, genes, and disease. Science. 2006;313:1929–1935. doi: 10.1126/science.1132939. [DOI] [PubMed] [Google Scholar]
- 2.Jiang H, Pritchard JR, Williams RT, Lauffenburger DA, Hemann MT. A mammalian functional-genetic approach to characterizing cancer therapeutics. Nature Chem. Biol. 2011;7:92–100. doi: 10.1038/nchembio.503. [DOI] [PMC free article] [PubMed] [Google Scholar]
- 3.Parsons AB, et al. Exploring the mode-of-action of bioactive compounds by chemical-genetic profiling in yeast. Cell. 2006;126:611–625. doi: 10.1016/j.cell.2006.06.040. [DOI] [PubMed] [Google Scholar]
- 4.Butcher RA, Schreiber SL. Using genome-wide transcriptional profiling to elucidate small-molecule mechanism. Curr. Opin. Chem. Biol. 2005;9:25–30. doi: 10.1016/j.cbpa.2004.10.009. [DOI] [PubMed] [Google Scholar]
- 5.Schirle M, Bantscheff M, Kuster B. Mass spectrometry-based proteomics in preclinical drug discovery. Chem. Biol. 2012;19:72–84. doi: 10.1016/j.chembiol.2012.01.002. [DOI] [PubMed] [Google Scholar]
- 6.Krutzik PO, Crane JM, Clutter MR, Nolan GP. High-content single-cell drug screening with phosphospecific flow cytometry. Nature Chem. Biol. 2008;4:132–142. doi: 10.1038/nchembio.2007.59. [DOI] [PubMed] [Google Scholar]
- 7.Nicholson JK, Connelly J, Lindon JC, Holmes E. Metabonomics: a platform for studying drug toxicity and gene function. Nature Rev. Drug Discov. 2002;1:153–161. doi: 10.1038/nrd728. [DOI] [PubMed] [Google Scholar]
- 8.Chan D, Lee S-C. Oncogene and Cancer - From Bench to Clinic. InTech; 2013. Serial changes in expression of proteins in response to neoadjuvant chemotherapy in breast cancer. [Google Scholar]
- 9.Obeid M, et al. Calreticulin exposure dictates the immunogenicity of cancer cell death. Nature Med. 2007;13:54–61. doi: 10.1038/nm1523. [DOI] [PubMed] [Google Scholar]
- 10.Azuma Y, Taniguchi A, Matsumoto K. Decrease in cell surface sialic acid in etoposide-treated jurkat cells and the role of cell surface sialidase. Glycoconj. J. 2000;17:301–306. doi: 10.1023/a:1007165403771. [DOI] [PubMed] [Google Scholar]
- 11.Editorial, Mechanism matters. Nature Med. 2010;16:347. doi: 10.1038/nm0410-347. [DOI] [PubMed] [Google Scholar]
- 12.De Castro DG, Clarke PA, Al-Lazikani B, Workman P. Personalized cancer medicine: molecular diagnostics, predictive biomarkers, and drug resistance. Clin. Pharm. Ther. 2013;93:252–259. doi: 10.1038/clpt.2012.237. [DOI] [PMC free article] [PubMed] [Google Scholar]
- 13.Feng Y, Mitchison TJ, Bender A, Young DW, Tallarico JA. Multi-parameter phenotypic profiling: using cellular effects to characterize small-molecule compounds. Nature Rev. Drug Discov. 2009;8:567–578. doi: 10.1038/nrd2876. [DOI] [PubMed] [Google Scholar]
- 14.Perlman ZE, et al. Multidimensional drug profiling by automated microscopy. Science. 2004;306:1194–1198. doi: 10.1126/science.1100709. [DOI] [PubMed] [Google Scholar]
- 15.Rihel J, et al. Zebrafish behavioral profiling links drugs to biological targets and rest/wake regulation. Science. 2010;327:348–351. doi: 10.1126/science.1183090. [DOI] [PMC free article] [PubMed] [Google Scholar]
- 16.Young DW, et al. Integrating high-content screening and ligand-target prediction to identify mechanism of action. Nature Chem. Biol. 2008;4:59–68. doi: 10.1038/nchembio.2007.53. [DOI] [PubMed] [Google Scholar]
- 17.Bajaj A, et al. Detection and differentiation of normal, cancerous, and metastatic cells using nanoparticle-polymer sensor arrays. Proc. Natl. Acad. Sci. U.S.A. 2009;106:10912–10916. doi: 10.1073/pnas.0900975106. [DOI] [PMC free article] [PubMed] [Google Scholar]
- 18.El-Boubbou K, et al. Magnetic glyco-nanoparticles: a tool to detect, differentiate, and unlock the glyco-codes of cancer via magnetic resonance imaging. J. Am. Chem. Soc. 2010;132:4490–4499. doi: 10.1021/ja100455c. [DOI] [PubMed] [Google Scholar]
- 19.Wright AT, Anslyn EV. Differential receptor arrays and assays for solution-based molecular recognition. Chem. Soc. Rev. 2006;35:14–28. doi: 10.1039/b505518k. [DOI] [PubMed] [Google Scholar]
- 20.Peng G, et al. Diagnosing lung cancer in exhaled breath using gold nanoparticles. Nature Nanotech. 2009;4:669–673. doi: 10.1038/nnano.2009.235. [DOI] [PubMed] [Google Scholar]
- 21.Tanaka M, et al. An unbiased cell morphology-based screen for new, biologically active small molecules. PLoS Biol. 2005;3:e128. doi: 10.1371/journal.pbio.0030128. [DOI] [PMC free article] [PubMed] [Google Scholar]
- 22.Rana S, et al. Array-based sensing of metastatic cells and tissues using nanoparticle-fluorescent protein conjugates. ACS Nano. 2012;9:8233–8240. doi: 10.1021/nn302917e. [DOI] [PMC free article] [PubMed] [Google Scholar]
- 23.Shaner NC, Steinbach PA, Tsien RY. A guide to choosing fluorescent proteins. Nature Methods. 2005;2:905–909. doi: 10.1038/nmeth819. [DOI] [PubMed] [Google Scholar]
- 24.Vermes I, Haanen C, Reutelingsperger C. Flow cytometry of apoptotic cell death. J. Immunol. Methods. 2000;243:167–190. doi: 10.1016/s0022-1759(00)00233-7. [DOI] [PubMed] [Google Scholar]
- 25.Reis-Filho JS, Tutt ANJ. Triple negative tumours: a critical review. Histopathology. 2008;52:108–118. doi: 10.1111/j.1365-2559.2007.02889.x. [DOI] [PubMed] [Google Scholar]
- 26.Saha K, et al. Surface functionality of nanoparticles determines cellular uptake mechanisms in mammalian cells. Small. 2013;9:300–305. doi: 10.1002/smll.201201129. [DOI] [PMC free article] [PubMed] [Google Scholar]
- 27.Pritchard JR, Bruno PM, Hemanna MT, Lauffenburger DA. Predicting cancer drug mechanisms of action using molecular network signatures. Mol. Biosyst. 2013;9:1604–1619. doi: 10.1039/c2mb25459j. [DOI] [PMC free article] [PubMed] [Google Scholar]
- 28.Dunphy KA, et al. Oncogenic transformation of mammary epithelial cells by transforming growth factor beta independent of mammary stem cell regulation. Cancer Cell Int. 2013;13:74. doi: 10.1186/1475-2867-13-74. [DOI] [PMC free article] [PubMed] [Google Scholar]
- 29.Dancey JE, Chen HX. Strategies for optimizing combinations of molecularly targeted anticancer agents. Nature Rev. Drug Discov. 2006;5:649–659. doi: 10.1038/nrd2089. [DOI] [PubMed] [Google Scholar]
- 30.Gottesman MM. Mechanisms of cancer drug resistance. Ann. Rev. Med. 2002;53:615–627. doi: 10.1146/annurev.med.53.082901.103929. [DOI] [PubMed] [Google Scholar]
- 31.Jia J, et al. Mechanisms of drug combinations: interaction and network perspectives. Nature Rev. Drug Discov. 2009;8:111–128. doi: 10.1038/nrd2683. [DOI] [PubMed] [Google Scholar]
- 32.Pritchard JR, et al. Defining principles of combination drug mechanisms of action. Proc. Natl. Acad. Sci. U.S.A. 2013;110:E170–E179. doi: 10.1073/pnas.1210419110. [DOI] [PMC free article] [PubMed] [Google Scholar]
- 33.Geva-Zatorsky N, et al. Protein dynamics in drug combinations: a linear superposition of individual-drug responses. Cell. 2010;140:643–651. doi: 10.1016/j.cell.2010.02.011. [DOI] [PubMed] [Google Scholar]
- 34.Nandakumar DN, Nagaraj VA, Vathsala PG, Rangarajan P, Padmanaban G. Curcumin-artemisinin combination therapy for malaria. Antimicrob. Agents Chemother. 2006;50:1859–1860. doi: 10.1128/AAC.50.5.1859-1860.2006. [DOI] [PMC free article] [PubMed] [Google Scholar]
- 35.Chan L-P, et al. Apigenin induces apoptosis via tumor necrosis factor receptor- and Bcl-2-mediated pathway and enhances susceptibility of head and neck squamous cell carcinoma to 5-fluorouracil and cisplatin. BBA-Gen. Subjects. 2012;1820:1081–1091. doi: 10.1016/j.bbagen.2012.04.013. [DOI] [PubMed] [Google Scholar]
Associated Data
This section collects any data citations, data availability statements, or supplementary materials included in this article.


