

Summary
The model fungus Aspergillus nidulans synthesizes numerous secondary metabolites, including sterigmatocystin (ST). The production of this toxin is positively controlled by the global regulator veA. In the absence of veA (ΔveA), ST biosynthesis is blocked. Previously we performed random mutagenesis in a ΔveA strain and identified revertant mutants able to synthesize ST, among them RM1. Complementation of RM1 with a genomic library revealed that the mutation occurred in a gene designated as cpsA. While in the ΔveA genetic background cpsA deletion restores ST production, in a veA wild-type background absence of cpsA reduces and delays ST biosynthesis decreasing the expression of ST genes. Furthermore, cpsA is also necessary for the production of other secondary metabolites, including penicillin, affecting the expression of PN genes. In addition, cpsA is necessary for normal asexual and sexual development. Chemical and microscopy analyses revealed that CpsA is found in cytoplasmic vesicles and it is required for normal cell wall composition and integrity, affecting adhesion capacity and oxidative stress sensitivity. The conservation of cpsA in Ascomycetes suggests that cpsA homologs might have similar roles in other fungal species.
Keywords: mutagenesis, veA, velvet, polysaccharide, cpsA, mycotoxin, cell wall, development, penicillin, secondary metabolism
Introduction
Aspergillus species synthesize numerous secondary metabolites (Adrio et al., 2003; Brakhage et al., 2011). These compounds include antibiotics and other medical drugs as well as mycotoxins (Bennett et al., 2003; Reverberi et al., 2010). The model fungus Aspergillus nidulans produces the mycotoxin sterigmatocystin (ST). This mycotoxin is similar to the well-known potent carcinogenic aflatoxins (AFs) (Payne and Yu, 2010; Sweeny and Dobson, 1999; Payne and Brown, 1998), produced by other Aspergillus species, including the agriculturally important fungi A. flavus and A. parasiticus. Both toxins are produced through a conserved biosynthetic pathway (Cole and Cox, 1981). As in the case of AF genes, the genes involved in the synthesis of ST are clustered and regulated by aflR, an endogenous transcription factor gene (Yu et al., 1996; Keller and Hohn, 1997; Fernandes et al., 1998). Transcription of aflR, and concomitant production of ST, is positively controlled by veA, a global regulatory gene that also governs sexual and asexual development in A. nidulans (Kato et al., 2003; Calvo, 2008, Calvo et al., 2016). A similar role was found in A. flavus and A. parasiticus, where veA controls AF production (Duran et al., 2007; 2009; Calvo et al., 2004).
In A. nidulans, the biosynthesis of other natural products, such as penicillin (PN), is also veA-regulated (Kato et al., 2003). Similar regulatory output is also observed in other fungal species, for instance, veA homologs also regulate PN synthesis in Penicillium chrysogenum (Hoff et al., 2010; Veiga et al., 2012; Kopke et al., 2013) and cephalosporin C production in Acremonium chrysogenum (Dreyer et al., 2007). Additionally, besides affecting ST and AF production, veA also controls the biosynthesis of other mycotoxins, for instance, cyclopiazonic acid and aflatrem in Aspergillus flavus (Duran et al., 2007), fumonisins and fusarins in Fusarium spp, including F. verticillioides and F. fujikuroi (Myung et al., 2009; Wiemann et al., 2010), trichothecenes in F. graminerum (Merhej et al., 2012), as well as dothistromin in Dothistroma septosporum (Chettri et al., 2012) among others.
The use of A. nidulans as a model system has greatly enhanced our knowledge on the veA regulatory mechanism of action (Calvo et al., 2016). The VeA protein, together with another velvet protein denominated VelB (Bayram et al., 2008), is transported to the nucleus by the KapA α-importin, particularly in the dark, a condition that promotes ST production and sexual development in this fungus (Stinnett et al., 2007; Araújo-Bazán et al., 2009). This migration of KapA-VeA-VelB is negatively affected under light by other proteins, such as FphA, LlmF, and Vip-VapB dimer (Palmer et al., 2013; Sarikaya-Bayram et al., 2014; Purschwitz et al., 2008) promoting conidiation. In the nucleus, VeA also interacts with other proteins, forming a complex with light-responsive proteins, FphA, LreA and LreB, which also affects asexual and sexual morphogenesis and secondary metabolism (Purschwitz et al., 2008; Röhrig et al., 2013). Furthermore, VeA also interacts with the putative methyl transferase LaeA (Bayram et al., 2008; Bayram and Braus, 2012) forming the VelB-VeA-LaeA velvet complex. LaeA, also required for normal mycotoxin biosynthesis (Bok and Keller, 2004), has been shown to be involved in chromatin remodeling (Reyes-Dominguez et al., 2010; Bayram et al., 2010). Interestingly, not only does VeA play a role as a scaffold for these complexes, but velvet proteins have been shown to bind DNA (Beyhan et al., 2013; Ahmed et al., 2013).
Our previous phylogenetic study revealed that VeA is conserved in many Ascomycetes (Myung et al., 2012), where in addition to governing morphogenesis and secondary metabolism, this regulator influences plant pathogenicity of different mycotoxigenic fungi, for example in Aspergillus flavus (Duran et al., 2007; 2009), Fusarium verticillioides (Myung et al., 2012; Li et al., 2006), F. fujikuroi (Bayram et al., 2008), and F. graminearum (Merhej et al., 2012; Jiang et al., 2001), as well as fungal infections in animals (Laskowski-Peak et al., 2012). Absence of veA homologs in these fungi resulted in a decrease in virulence, coinciding with a reduction in mycotoxin production. In addition, cellular processes such as oxidative stress response (Calvo et al., 2016; Baidya et al., 2014), cell wall structure synthesis (Li et al., 2006; Park et al., 2015), and presence of hydrolytic activity (Dhingra et al., 2012; Duran et al., 2014) have all been found to be modulated by veA.
In order to discover novel genetic elements connected to the veA global regulatory mechanism we previously performed random mutagenesis in a deletion veA strain, and identified several veA-dependent genes involved in the regulation of ST biosynthesis (Ramamoorthy et al., 2012). For instance, rtfA, a gene encoding a putative RNA polymerase transcription elongation factor-like that also regulates sexual and asexual development. In the same manner, we found mtfA, encoding a novel putative C2H2 zinc finger domain type transcription factor that regulates the biosynthesis of several secondary metabolites including ST, and it is also important for morphogenesis in A. nidulans (Ramamoorthy et al., 2013). In the present study we have investigated another selected revertant mutant, RM1. This strain presented a point mutation in a gene that we designate as cpsA. This gene was initially annotated as encoding a putative polysaccharide synthase. In this study we show that cpsA differentially influences ST biosynthesis in a veA-dependent manner. cpsA also regulates the biosynthesis of other natural products, including PN. Furthermore, cpsA is necessary for normal conidiation and sexual development in A. nidulans. Importantly, our chemical analysis and microscopy observations indicated that cpsA is required for normal composition and integrity of the fungal cell wall, affecting fungal adhesion and the capacity to survive under exposure to environmental stresses. Our study demonstrated a profound effect of cpsA on the expression of numerous genes, including those involved in secondary metabolism and developmental processes.
Results
AN9069 annotated as a putative polysaccharide synthase
Previously we reported seven revertant mutants (RMs) with restored wild-type levels of norsolorinic acid (NOR), an orange intermediate used as marker of ST biosynthesis, in a strain with a ΔveA background (Ramamoorthy et al., 2012). In the present study we identified the mutated gene in RM1 (Figure 1). First, to examine whether one or more mutations occurred in RM1, the strain was crossed with RJH030 (yA2, wA3, pabaA1, ΔstcE, trpC801, veA1). Analysis of the obtained progeny and dominant analysis revealed that RM1 presents a single recessive mutation. Transformation of RM1-R2 with a genomic library yielded colonies with wild-type phenotype. Sequencing of the inserts in rescued plasmids from these fungal colonies, and comparison of these sequences with the A. nidulans genomic database (http://www.aspgd.org) by BLAST analysis showed that the mutated gene in RM1 and RM1-R2 strains was AN9069, annotated as a putative polysaccharide synthase gene, and was denominated cpsA. The mutation was a G-A transition at nucleotide +568 of the cpsA coding region, changing the codon from GAT to AAT, resulting in a substitution of glutamic acid (D) for asparagine (N) (Figure S1). Complementation of RM1 with the library plasmid containing cpsA resulted in a strain with ΔveA phenotype with reduced ST intermediate production (Figure 1).
Figure 1. TLC analysis of NOR production in GMM cultures.

(A) The strains ΔveA ΔstcE (RDAEp206), veA1 ΔstcE (RAV1p), cpsA− ΔveA ΔstcE (RM1p), cpsA− cpsA+ ΔveA ΔstcE (RM1p-com), cpsA− veA1 ΔstcE (RM1p-R2), ΔcpsA ΔveA ΔstcE (TDAEΔcpsA), ΔcpsA cpsA+ ΔveA ΔstcE (TDAEΔcpsA-com) (Table S2), were top-agar inoculated and incubated at 37 °C in the dark for 5 days. NOR production was analyzed by TLC. (B) Intensity of NOR bands. Densitometry was carried out with GelQuant.NET software. NOR band intensity was normalized using the intensity corresponding to RDAEp206 as 1. The letters above the bars represent significantly different values (P ≤0.05, Tukey test).
cpsA putative homologs are present in other fungal species
The deduced amino acid sequence of A. nidulans CpsA revealed high identity with proteins from other Aspergillus species, including A. clavatus (75.4% identity), A. terreus (78.7%), A. flavus (76.5%), or A. fumigatus (65.3%) (Figure S1, Table S1). TMHMM predicted hydrophobic regions possibly acting as signal peptide (1–36, probability below 0.4) and transmembrane domains TM1 (309–332, probability below 0.4), TM2 (343–367, probability below 0.6) and TM3 (371–397, probability below 0.9) (Figure S1).
Analysis of other fungal genome databases revealed that CpsA is also conserved in many other Ascomycetes and also in Basidiomycetes (Table S1). An extensive alignment and phylogenetic tree is shown in Figures S2 and S3.
Additionally, A. nidulans CpsA was compared with putative bacterial homologs (Figure S4). CpsA presents a DXD motif, conserved in glycosyltransferases (Breton et al., 2006), that is relevant for their activity (Bothe et al. 2015; Busch et al., 1998; Li et al; 2001). This DXD motif was shown in crystal structures to interact primarily with the phosphate groups of a nucleotide donor through the coordination of a divalent cation, typically Mn2+ (Breton et al., 2006) or Mg+2 (Weigle, 2015). In addition, A. nidulans CpsA contains the related XDD motif (Weigel, 2015; Gulberti, et al., 2003).
cpsA affects mycotoxin biosynthesis in a veA-dependent manner
To further evaluate the effects of cpsA on A. nidulans mycotoxin biosynthesis, we deleted the cpsA coding region in the RDAE206 strain (ΔveA, ΔstcE), creating TDAEΔcpsA (ΔcpsA, ΔveA, ΔstcE) (Figure S5) (Table S2). In addition, we also deleted cpsA in a strain with a veA+ wild-type allele, RJMP1.49, resulting in TRVΔcpsA (ΔcpsA, veA+)(Table S2) (Figure S5). These deletions were confirmed by Southern blot analysis (Figure S5). The deletion of cpsA in a ΔveA ΔstcE background shows similar NOR production levels to those in cpsA-ΔveA ΔstcE and the control veA1 ΔstcE, and higher than in ΔveA ΔstcE (Figure 1). However, deletion of cpsA in a strain with a veA+ genetic background, showed a delay and a reduction in ST production compared with its isogenic controls strain, and the complementation strain (Figure 2). The reintroduction of the wild-type allele partially rescues the phenotype close to wild-type levels. It is possible that the complementation occurred at a different location, resulting in the observed slight phenotypical changes.
Figure 2. cpsA is necessary for normal expression of ST genes and mycotoxin production in A. nidulans strains with a veA+ wild-type background.

(A) Wild type (TRV50.2) (WT) veA+ control, ΔcpsA (TRVpΔcpsA), complementation (TRVpΔcpsA-com)(com), and overexpression (OEpcpsA)(OE) strains were inoculated in liquid GMM. Mycelia were collected after 48 h and 72 h of culture in a shaker incubator at 250 rpm at 37 °C. Expression of aflR and stcU was analyzed by Northern blot. rRNA serves as loading control. Asterisk indicates not detected. Densitometry of the Northern blot results is shown. (B) TLC analysis of ST production in 72 h cultures described in (A), densitometry of ST band intensity is shown.
ST production is affected by glucose concentration (i.e. Atoui et al., 2010). For this reason we also evaluated the effect of cpsA on mycotoxin production on medium with different glucose concentrations. ΔcpsA veA+ strain also showed a delay and a reduction in ST production when medium with higher concentrations of glucose was used (Figure S6). Overexpression of cpsA also showed a reduction in ST biosynthesis with respect to the controls. This difference in mycotoxin production was more notable as the concentration of glucose in the medium was increased. In addition, our analysis revealed that the synthesis of other unknown compounds was also cpsA-dependent (Figure S6).
The genes responsible for ST production are located in a cluster (Brown et al., 1996), among them, aflR encodes a C6 zinc transcription factor that activates other genes in this cluster (Yu et al., 1996; Fernandes et al., 1998; Brown et al., 1996). Additionally, another gene within the ST cluster, stcU, that encodes a ketoreductase, is commonly used as indicator of ST cluster activation (Yu et al., 1996; kato et al., 2003; Keller et al., 1995; Hicks et al., 1997). Northern analysis showed that expression of both aflR and stcU was reduced in the cpsA deletion strain (TRVpΔcpsA)(Table S2) in comparison to the isogenic wild type and complementation strains (Figure 2A). The same trend was also observed when cpsA was overexpressed. A concomitant reduction in ST accumulation was detected in the deletion and overexpression cpsA cultures (Figure 2B).
PN production is influenced by cpsA
Our chemical analysis results indicated that cpsA also affects the synthesis of other compounds in addition to ST (Figure S6). It is known that production of several secondary metabolites, including ST and PN, can be coregulated by certain proteins, such as VeA (Kato et al., 2003), and that, based on our current study, the cpsA genetic element is VeA-dependent. For these reasons, we also evaluated whether cpsA influences PN production in A. nidulans. We analyzed production of this antibiotic in the ΔcpsA strain (TRVpΔcpsA) and compared it with PN levels in the control strains, as well as in the cpsA overexpression strain. For this assay we used a well-established bioassay using B. calidolactis as the testing organism. Absence or overexpression of cpsA significantly decreased PN production with respect to the control strains (Figure 3), indicating that normal cpsA expression is necessary for wild-type levels of PN production. Furthermore, expression of the genes involved in PN biosynthesis, acvA, ipnA and attA (MacCabe et al., 1990), was significantly down-regulated when cpsA is deleted or overexpressed, causing reduction in PN biosynthesis.
Figure 3. cpsA affects penicillin production.

A) Extracts from wild-type (WT) veA+ control, ΔcpsA, complementation (com) and overexpression (OE) strains were analyzed for penicillin content as described in Materials and Methods section. (B) Quantification of penicillin content in the analyzed extracts. Values are means of three replicates. (C) qRT-PCR gene expression analysis by of acvA, ipnA and aatA from mycelial samples collected after 24 h and 48 h of incubation in PN inducing medium. The relative expression was calculated using the 2−ΔΔCT method, as described by Livak and Schmittgen (2001). Values were normalized to the expression levels in the wild type, considered 1. Error bars represent standard errors. The letters above the bars represent significantly different values (P ≤0.05).
cpsA positively affects development in A. nidulans
Deletion of cpsA resulted in a reduction in colony growth (Figure 4) and a drastic alteration of A. nidulans morphology (Figure 5), affecting both asexual and sexual development. Absence of cpsA resulted in severe reduction of conidial production, as well as in loss of Hülle cells (nursing cells contributing to the formation of fruiting bodies), and lack of cleistothecial formation under conditions that allow the production of these structures in the isogenic controls (Figure 5A–B). Interestingly, overexpression of cpsA also decreased conidiation, while causing an increase in the number of Hülle cells and a slight increase in cleistothecia with respect to the controls (Figure 5A–B). The reduction in conidiation in ΔcpsA and OEcpsA was accompanied by a decrease in the expression of brlA, a transcription factor gene that regulates early stages in conidiophore formation (Figure 5C) (Boylan et al., 1987; Adams et al., 1988). This reduction in brlA expression was particularly notable in ΔcpsA. In addition, the lack of sexual development in the absence of cpsA also coincided with a decrease in the expression levels of nsdD and steA, both encoding transcription factors involved in sexual development (Han et al., 2001; Vallim et al., 2000). Furthermore, deletion of cpsA negatively affected the expression of veA (Figure 6), global regulator previous described to be essential for sexual development and other biological functions (Kato et al., 2003; Calvo et al., 2016; Yager, 1992; Kim et al., 2002; Calvo and Cary, 2014), as well as laeA, encoding a VeA-interacting partner, LaeA, that also influences sexual development and controls secondary metabolism (Bok and Keller, 2004; Bayram et al., 2010).
Figure 4. cpsA positively affects A. nidulans colony growth.
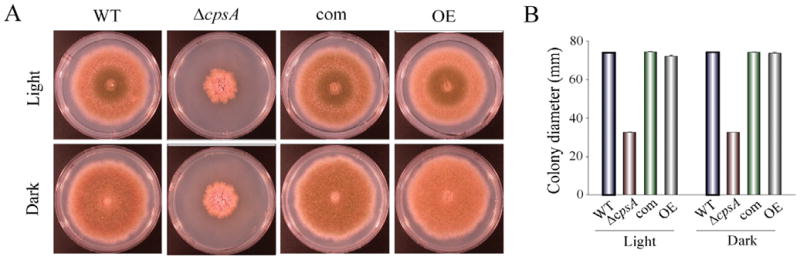
(A) Photographs of wild-type (WT) veA+ control, ΔcpsA, complementation (com) and overexpression (OE) strains point-inoculated on GMM plates and incubated at 37 °C in either light or dark for 6 days. (B) Colony growth measured as colony diameter. Standard error is shown. Means are average of three replicates.
Figure 5. cpsA is necessary for proper asexual and sexual development.
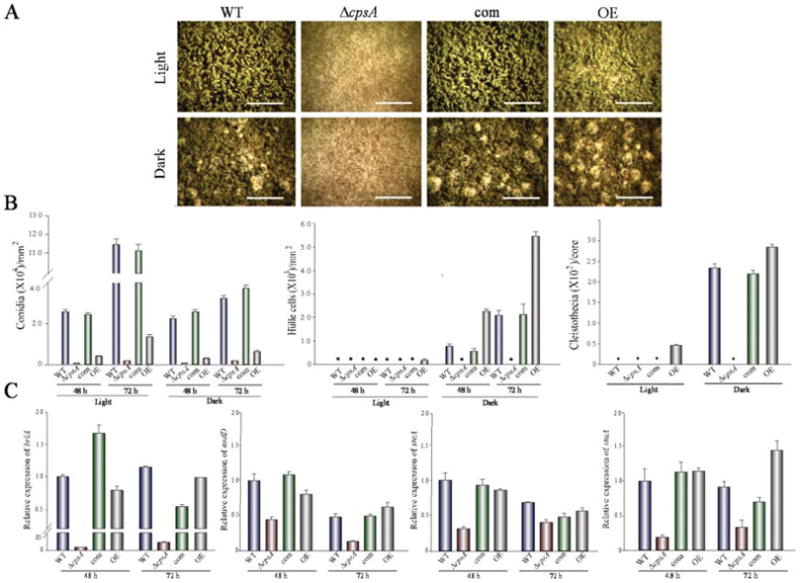
(A) Micrographs of wild-type (WT) veA+ control, ΔcpsA, complementation (com) and overexpression (OE) strains point-inoculated GMM cultures incubated at 37 °C in either light or dark for 6 days. Samples were observed two centimeters from the inoculation point. Images were captured with an upright Leica MZ75 stereomicroscope. Scale bar corresponds to 200 μm. (B) Quantitative analysis of production of conidia, Hülle cells and cleistothecia from top-agar inoculated GMM cultures incubated at 37 °C in either light or dark for 48 h and 72 h, in the case of conidia and Hülle cells, and 6 days in the case of cleistothecia. Asterisk indicates not detected. The experiment included three replicates. (C) qRT-PCR gene expression analysis of brlA, nsdD, steA and stuA from mycelial samples from 48 h and 72 h GMM liquid stationary cultures. The relative expression was calculated using the 2−ΔΔCT method, as described by Livak and Schmittgen (2001). Values were normalized to the expression levels in the wild type, considered 1. Error bars represent standard errors.
Figure 6. Expression of veA and laeA is positively affected by cpsA.

qRT-PCR gene expression analysis of veA and laeA from liquid stationary GMM cultures 48 h and 72 h after incubation in the dark at 37 °C. The relative expression was calculated using the 2−ΔΔCT method, as described by Livak and Schmittgen (2001). Levels in the wild type, considered 1. Error bars represent standard errors. The letters above the bars represent significantly different values (P ≤0.05).
CpsA localizes in cytoplasmic vesicles
In the current study we also investigated the subcellular localization of CpsA in A. nidulans. With this purpose, we generated two identical strains with cpsA fused to gfp. A single copy of the fusion cassette was detected at the cpsA locus (data not shown). The selected transformants containing the cpsA::gfp cassette presented wild-type phenotype. Microscopic observations were identical for both transformants (results for TXF1.1 are shown in Figure 7). Fluorescence microscopy results indicated A. nidulans CpsA-GFP localizes abundantly at cytoplasmic vesicles or organelles. CMAC staining indicates that some of these organelles are vacuoles. Non motile and other highly motile vesicles are likely endosomes (Movie 1). No other structures are labeled by GFP fluorescence. For example there is no evidence of accumulation at the plasma membrane. Over-expression of CpsA does not modify this distribution, only the intensity of fluorescence detected (Figure S7, Movies 2 and 3). Thus CpsA might be exerting its role in any of those vesicles, or the amount of protein at the plasma membrane is relatively low for detection. Full length CpsA-GFP fusion protein was detected by Western blot. This protein must be linked to structures that cannot be solubilized in a standard buffer lacking detergents or denaturing agents (A50 buffer, see extensive work with this buffer in Orejas et al., 1995) corroborating the microscopy result of localization in internal membranous structures. Nevertheless, the GFP moiety is detected suggesting a degradation process for CpsA-GFP probably at recycling compartments as the lysosome or multivesicular bodies.
Figure 7. Localization of CpsA protein.

(A) Cellular localization of CpsA-GFP fusion protein expressed by its endogenous promoter. Cells were grown for 16 h at 25 °C. CpsA accumulates at small vesicles resembling vacuoles and endosomes. The kymograph obtained from a stack of 90 images for 12 seconds (200 ms exposure each) along the line shown in GFP inset. Dashed line square indicates the limits of Movie 1. Kymograph shows the presence of static and motile vesicles migrating in an anterograde (to the tip) and retrograde (from tip to base of cells) modes. (B) CMAC staining confirm the presence of CpsA-GFP in small vacuoles. Details of the aggregates are shown at the bottom of the images. Asterisks indicate cell tips. Scale bar represents 5 micrometers. (C) Detection of CpsA-GFP fusion using GFP antibodies. TE indicates a total protein extract using an alkaline lysis protocol. Soluble protein from A50 extraction protocol is shown in line SN. Insoluble protein in A50 treatment was analyzed in line P. An overexposure of the filter on the CpsA-GFP fusion region is shown. In both protocols a band corresponding to GFP is visualized as indication of protein degradation in vacuoles or MVs (multivesicular bodies)/lysosomes.
cpsA is involved in regulating cell wall composition and integrity
Our sequence analysis suggested that cpsA could be involved in cell wall organization or synthesis. To test whether cpsA has a role in cell wall integrity, we examined the effect of cell wall disrupting compounds, sodium dodecyl sulphate (SDS) and calcofluor white (CFW) (Ram and Klis, 2006) in the culture medium inoculated with the wild type, ΔcpsA, ΔcpsA-com, and OEcpsA (Figure 8). In both cases the presence of the cell wall disrupting agent caused growth inhibition when cpsA was deleted or over-expressed. The observed effect was particularly drastic in the absence of cpsA. These results suggest that cpsA might affect cell wall components. We examined the cell wall composition in the wild type, cpsA deletion, complementation and overexpression strains as detailed in Materials and Methods. The results showed that absence of cpsA led to a significant reduction of glucan, chitin and mannoprotein compared to the levels of those components in the wild-type and complementation strain cell wall (Table 1). Overexpression of cpsA resulted in a similar reduction of these components compared to the controls. Importantly, transmission electron microscopy analysis revealed that absence of cpsA results in partial detachment of the cell wall from the plasma membrane (Figure 9). This observed separation was consistent only in the case of the cpsA mutant, while it was not observed in the control strains.
Figure 8. Absence of or overexpression of cpsA increases sensitivity to SDS and CFW.

(A) Wild-type (WT) veA+ control, ΔcpsA, complementation (com) and overexpression (OE) strains were point inoculated on GMM containing SDS (A) and CFW (B) at different concentrations. Cultures were incubated at 37 °C in the dark for 3 days.
Table 1.
Compostion of cell wall (μg/mg dry weight ± standard deviation).
| Alkali-Soluble | Alkali-Insoluble | |||
|---|---|---|---|---|
|
| ||||
| mannoprotein | glucan | glucan | chitin | |
| WT | 38.8 ± 4.2 A | 104.3 ± 4.3 A | 129.0 ± 15.2 A | 100.2 ± 7.2 A |
| ΔcpsA | 17.7 ± 4.3 C | 83.6 ± 6.8 B | 84.8 ± 7.9 B | 80.0 ± 5.3 B |
| com | 39.6 ± 7.5 A | 112.8 ± 9.1 A | 137.2 ± 15.0 A | 107.9 ± 5.2 A |
| OE | 24.8 ± 5.1 B | 95.1 ± 9.3 AB | 80.3 ± 5.6 B | 82.0 ± 7.0 B |
Figure 9. cpsA is required for proper attachment of the cell wall to the plasma membrane.
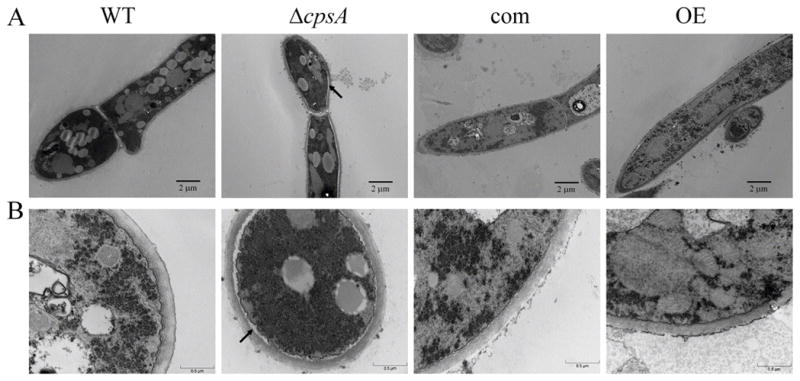
Transmission electron microscopy images of wild-type (WT) veA+ control, ΔcpsA, complementation (com) and overexpression (OE) strains. The strains were grown in liquid stationary GMM cultures at 37 °C for 48 h. Mycelia were fixed and stained with 2% uranyl acetate and 0.2% lead citrate. The arrows show the cell structure alteration with detachment of plasma membrane and cell wall. Micrographs were acquired with different magnifications represented by panels in (A) and (B).
cpsA is involved in adhesion to surfaces
Biofilms are complex structures that offer protection from environmental stresses. Biofilm formation has been shown to involve a sequential adherent process to a new surface (Finkel and Mitchell, 2011; Beauvais and Muller, 2009). We examined the possible role of cpsA in A. nidulans mycelial adhesion. Interestingly, our results indicated that deletion of cpsA caused a notable delay and reduction in adhesion capacity (Figure 10). Overexpression of cpsA also slightly decreased adhesion capacity at 24 h after inoculation. In addition, we analyzed the expression of three genes that could influence biofilm formation, dvrA, stuA and laeA (Figure 10B). In all cases these three genes were downregulated in the cpsA deletion strain compared to the controls.
Figure 10. cpsA is involved in adhesion to surfaces.

(A) Conidia of wild-type (WT) veA+ control, ΔcpsA, complementation (com) and overexpression (OE) strains were inoculated in liquid GMM (105 spores/ml), and incubated at 37 °C for 24 h and 48 h as stationary cultures. Mycelium was stained with Crystal violet as described in Materials and Methods section. The 48 h samples in panel A were dilluted 2-fold for measurement at 560 nm. (B) Expression analysis of laeA, dvrA, and stuA by Northern blot. The strains were inoculated (105 spores/ml) in Petri dishes containing 20 ml of liquid GMM, and incubated at 37 °C for 48 h and 72 h as stationary cultures. rRNA serves as loading control. Densitometry of the Northern blot results is shown.
Wild-type cpsA expression levels facilitate A. nidulans growth under oxidative stress conditions
In order to examine the possible role of cpsA in resistance to oxidative stress, menadione was added to the culture medium at different concentrations (Figure 11A). Absence of cpsA clearly resulted in growth inhibition at 0.08 mM, while the growth of the isogenic control strains was inhibited at 0.2 mM under the experimental conditions assayed. Overexpression of cpsA only mildly decreased fungal growth under oxidative stress conditions. Furthermore, alterations in the cpsA locus reduced the expression of the thioredoxin gene thiO and catalase gene catB with respect to the controls when the cultures were exposed to menadione (Figure 11B–D).
Figure 11. cpsA is necessary in resistance to oxidative stress in A. nidulans.

(A) Wild-type (WT) veA+ control, ΔcpsA, complementation (com) and overexpression (OE) strains were point-inoculated on GMM containing different concentrations of menadione and incubated at 37 °C in dark for 3 days. Expression analysis of thiO by qRT-PCR (B) and catB by Northern blot (C and D). The strains were incubated in liquid GMM at 250 rpm at 37°C in the dark for 48 h. After that, mycelia were transferred to GMM with or without menadione (0.08 mM). rRNA serves as loading control. Densitometry of the Northern blot results is shown.
Deletion of cpsA affects osmotic stress tolerance and increases sensitivity to temperature in A. nidulans
In this study, we also examined whether cpsA was involved in survival under osmotic stress. For this purpose the medium was supplemented with NaCl (0.7 M), or sorbitol (1.2 M). The addition of sorbitol did not further decrease fungal growth in the deletion mutant (Figure S8). However, addition of NaCl did reduce ΔcpsA colony growth in comparison to the colonies of this strain grown on non-supplemented GMM. Absence of cpsA also resulted in an increase in sensibility to higher temperatures (45 °C), while a lower temperature (30 °C) increased fungal growth in this mutant. Unexpectedly, NaCl and sorbitol supplemented ΔcpsA cultures grown at 45 °C showed an increase of vegetative growth.
Defects in cell wall are not sufficient to recover ST production in a ΔveA background
In order to test whether the defects in cell wall composition and integrity observed in the cpsA mutant were sufficient to recover ST biosynthesis in a strain with a ΔveA background, we analyzed production of this mycotoxin in the double mutant ΔveAΔrlmA. The rlmA gene encodes a MADS-box transcription factor necessary for cell wall integrity in A. nidulans (Kovács et al., 2013). Our results indicate that alterations in the rlmA locus are insufficient to restablish toxin production in the absence of veA (Figure S9).
Analysis of hyaluronic acid by SAX-HPLC and glycosyl composition of cell wall by GC-MS
In order to determine whether hyaluronic acid is present or absent in A. nidulans cell wall and whether its synthesis is cpsA-dependent, we examined hyaluronan content in these samples at the Complex Carbohydrate Research Center (Athens, GA). After digestion with hyaluronase, samples were analyzed by SAX-HPLC as described in the Materials and Methods section, and compared to a purified hyaluronan sample undergoing the same procedure. Our results showed that hyaluronan was not detected in these fractions. In addition, monosaccharide composition of the wild-type and ΔcpsA cell wall fractions was also analyzed by GC-MS. Hyaluronan is a polymer of D-glucuronic acid and D-N-acetylglucosamine, however no glucuronic acid was found in these fractions (Table S3), further indicating that hyaluronan is absent or at very low concentration in the cell wall of this fungus.
Analysis of exopolysaccharide (EPS) glycosyl composition by GC-MS
In order to examine whether hyaluronan is present in A. nidulans EPS, we analyzed its glycosyl composition by GC-MS (Table S4). As in the case of the cell wall analysis, no glucuronic acid was found in the EPS of either wild type or mutant. In addition, EPS was analyzed by infrared spectroscopy (Figure S10). IR spectra from both samples were identical and presented characteristics of polysaccharides with N-acetylated aminosugars. The bands at 820 and 850 cm−1 and the lack of signal at 890 cm−1 confirmed the alpha configuration of these polysaccharides. Furthermore, the signals at 1558 and 1646 cm−1 are typical of the amide linkage from N-acetyl aminosugars, which suggest N-acetylation of galactosamine units. The absence of signals in the region of 1700–1780 cm−1 from the carboxyl group confirms that these samples lack uronic acids, which agrees with the results from monosaccharide analysis. The type of linkages was also analyzed after methylation (Figure S11). The results from the methylation analysis as well as those from IR spectroscopy indicate the presence of α-(1–4)-galactosaminogalactans in the EPS samples.
Analysis of monosaccharides in A. nidulans membrane
As mentioned above, hyaluronan is a polymer of D-glucuronic acid and D-N-acetylglucosamine. We analyzed the monosaccharide composition of A. nidulans wild-type membrane searching for any of these monomers, particularly glucuronic acid, which could serve as possible anchor between membrane and cell wall by binding D-N-acetylglucosamine in that structure. Furthermore, glucuronic acid containing glycolipids have been reported in membranes of the phylogenetically related fungus A. fumigatus (Fontaine et al., 2009). Our GC/MS analysis results are listed in Table S5. Mannitol, mannose, glucose, galactose and glucosamine were detected, however glucuronic acid was not found in this sample.
Discussion
Secondary metabolites are crucial in the ecology and adaptation of fungi to their environment. The biosynthesis of these compounds, also denominated natural products, is often genetically linked with morphological development by shared regulatory mechanisms (Calvo, 2008; Calvo et al., 2016; Bayram and Braus, 2012; Calvo and Cary, 2014; Calvo et al., 2002; Yu and Keller, 2005). Among them, one member of the velvet protein family, VeA, plays a key role in connecting these two processes (Calvo, 2008; Calvo et al., 2016; Bayram and Braus, 2012; Calvo and Cary, 2014; Calvo et al., 2002). In A. nidulans, the absence of the veA gene results in strains unable to form sexual fruiting bodies (Kim et al., 2002), displaying hyperconidiation by affecting the expression of brlA, a gene encoding an indispensable transcription factor for the formation of conidiophores in this model fungus (Kato et al., 2003). In other Aspergillus species, such as the AF-producers A. flavus and A. parasiticus, deletion of veA prevents the formation of sclerotia (Calvo et al., 2004; Duran et al., 2007; Calvo and Cary, 2014), resistant structures important for survival under adverse environmental conditions (Coley-Smith and Cooke, 1971; Wicklow, 1987). It has been established that veA has a plurality of roles. Recent transcriptome analyses revealed a wide range of veA-dependent genes with a variety of functions, including numerous secondary metabolite gene clusters in A. nidulans, as well as in other Aspergillus species, such as the opportunistic human pathogen A. fumigatus (Dhingra et al., 2013; Lind et al., 2015) and the AF-producer A. flavus (Cary et al., 2015), as well as in other fungal genera, for example in Fusarium (Wiemann et al., 2010; Kim et al., 2013) or in Penicillum spp. (Hoff et al., 2010). While the compounds associated with some of these veA-dependent genes clusters are still unknown, in some cases these associations have been characterized in great depth, such as the case of the mycotoxin ST in A. nidulans.
In spite of its importance, the VeA mechanism of action is not fully understood. Our search for new veA-dependent genetic elements involved in the regulation of ST production in A. nidulans resulted in the identification of cpsA, encoding a protein initially annotated as a putative polysaccharide synthase. CpsA shares limited similarity with proteins of the bi-functional glycosyltransferases family 2, hyaluronan synthases, which catalyze polymerization of hyaluronan. The deduced amino acid sequence shows a putative signal peptide domain and three putative transmembrane domains. Although the probability in this prediction is low, these domains have also been described in other characterized hyaluronan synthases, including those in humans (Watanabe and Yamaguchi, 1996). Its putative characterized bacterial homolog, Cps1, is a type 3 polysaccharide synthase in Streptococcus pneumoniae, involved in the polymerization of Glc and GlcUA onto the growing polysaccharide chain (Chang et al., 2006). In the pathogenic yeast Cryptococcus neoformans, the Cps1 homolog is a hyaluronic acid synthase needed for the formation of the outer cell wall, playing an essential role in adhesion and virulence of this Basidiomycete (Chang et al., 2006; Jong et al., 2007). A Cps1 putative homolog was also found in Neurospora crassa by Fu et al (2014). As in the case of N. crassa, hyaluronic acid was not detected in our analysis of A. nidulans cell wall. Furthermore, our extensive chemical analysis indicates that this compound is also absent in the exopolysaccharide, mainly composed of α-(1–4)-galactosaminogalactans. In addition, no evidence of glucuronic acid was found in membrane. Nevertheless, our comparative analysis with putative bacterial homologs indicated the presence of DXD and XDD motifs, conserved in 78 families of glycosyltransferases (Breton et al., 2006; Bothe et al. 2015; Busch et al., 1998; Li et al; 2001). It is possible that cpsA could influence carbohydrate metabolism, which is known to affect ST production (i.e. Németh et al., 2016). Irrefutably, our results revealed a profound effect of cpsA in toxin production as well as in many other aspects of A. nidulans biology. For this reason we also performed a detailed microscopy study to provide additional clues of its mode of action. Our results revealed that CpsA-GFP accumulates in cytoplasmic vesicles or organelles and that, based on the CMAC staining, some of these organelles are vacuoles. Non motile vesicles would correspond to late-endosomes, and those moving in retrograde and anterograde directions are, most probably, early endosomes (Lopez-Berges et al., 2016). Additionally, our protein analysis also indicates that CpsA is located and bound to internal membranous structures. Functional full-length CpsA-GFP protein must locate in early and late endosomes, or other membranous compartment, such as vesicles originated at the Golgi which could fuse to early endosomes. The recycling of this putative transmembrane protein probably occurs in vacuoles or multivesicular bodies fused with lysosomes, as also suggested by the presence of the resistant GFP fragment in the Western Blot. The vesicle transport machinery has been shown to be involved in the synthesis, compartmentation and export of aflatoxin in A. parasiticus (Chanda et al., 2009). Furthermore, the formation of these vesicles (aflatoxisomes) is at least in part mediated by veA. It is possible that cpsA could be involved in processes affecting the synthesis of ST in similar vesicles in A. nidulans. Future research will be carried out in our laboratory to investigate the nature of these membranous compartment and their aggregates.
Our current study also revealed that CpsA influences ST biosynthesis in a veA-dependent manner in A. nidulans. Deletion of cpsA in a strain with a veA+ allele resulted in the opposite effect on mycotoxin production with respect to that observed in a strain where veA is absent, presenting a decrease in accumulation of ST in comparison with the wild type. Similarly to the case of strains with a deletion veA background, strains with a veA1 partially functional mutant allele (Stinnett et al., 2007; Kim et al., 2002; Käfer, 1965) (commonly used in A. nidulans research laboratories), with a loss-of-function cpsA allele also accumulated an abundant amount of ST. These results indicated that cpsA function is affected by the veA allele. This effect on ST production was also observed in previously characterized veA-dependent genes, such as rtfA (Ramamoorthy et al., 2012), and mtfA (Ramamoorthy et al., 2013). Furthermore, our study also showed that cpsA affects the expression of aflR, encoding a C6 zinc transcription activator necessary for the activation of other genes in the ST gene cluster (Yu et al., 1996; Fernandes et al., 1998). The biosynthesis of other secondary metabolites was also impacted by the presence or absence of cpsA, for instance, production of PN was reduced in the cpsA deletion mutant as well as in a strain with forced overexpression of this gene. This suggests a broad effect of cpsA on A. nidulans secondary metabolism, in which proper wild-type levels of cpsA expression are necessary for normal biosynthesis of these natural products.
Besides the observed effect of cpsA in secondary metabolism, the present study indicated that cpsA also affected A. nidulans development. Expression of brlA, key in the conidiation central regulatory pathway (Boylan et al., 1987; Adams et al., 1988; Park and Yu 2012; Adams and Yu, 1998) was downregulated in the absence of cpsA compared to the wild type, resulting in a reduction of conidial production. Furthermore, in the cpsA deletion mutant, expression was also decreased for the nsdD, steA, and stuA genes, which encode transcription factors required for sexual development (Han et al., 2001; Vallim et al., 2000; Wu and Miller, 1997; Miller et al., 1992). Furthermore, the cpsA deletion strain is unable to produce Hülle cells or cleistothecia under conditions that allow the production of these structures in the wild type. As in the case of A. nidulans, loss of the CpsA homolog, Csp-1, negatively affected conidiation and production of sexual structures in N. crassa (Fu et al., 2014). Overexpression of cpsA in A. nidulans resulted in greater production of Hülle cells and cleistothecia than the wild type. These results indicate that cpsA positively influences both asexual and sexual development in A. nidulans.
Interestingly, this study showed that not only is cpsA functionally veA-dependent, but that cpsA also positively affects the expression of the global regulators veA and laeA; the later encodes a putative methyl transferase involved in chromatin conformation remodeling (Bok and Keller, 2004; Reyes-Dominguez et al., 2010; Bayram et al., 2010; Patananan et al., 2013). Since both veA and laeA regulate hundreds of genes in A. nidulans (Lind et al., 2015; Kim et al., 2013a) as well as in other fungi (i.e. Hoff et al., 2010; Wiemann et al., 2010; Dhingra et al., 2012; Lind et al., 2015; Cary et al., 2015; Kim et al., 2013a; Karimi-Aghcheh et al., 2013; Fekete et al., 2014) it is possible that some of the phenotypes observed in the absence of cpsA, such as changes in morphological and chemical development, could be, at least in part, the result of alterations in the expression of these global regulators (Figure 12). Moreover, veA transcriptome analysis in A. nidulans indicated that cpsA expression is also dependent on veA (Lind et al., 2015), suggesting a regulatory loop essential for A. nidulans fitness.
Figure 12. Model of the role of cpsA in A. nidulans.

cpsA is necessary for proper attachment of the cell wall to the plasma membrane, and the normal cell wall composition and integrity that protect fungal cells from environmental stresses. All the genes in this model are downregulated in the absence of cpsA. The cpsA gene positively influences the expression of the master regulators veA, laeA and stuA, and is required for normal sexual and asexual development, secondary metabolism and adhesion capacity.
The absence of cpsA was also associated with defects in cell wall composition, including a decrease in glucan, chitin and mannoprotein content. Moreover, transmission electron microscopy analysis revealed alterations in cell wall integrity with structural changes in the cpsA deletion mutant, presenting partial detachment of the cell wall with respect to the plasma membrane. It is possible that this partial detachment could be a consequence of a disorganized assembly of the cell wall. Additionally, it is likely that some of the cell wall components could be more easily lost in the cpsA mutant strain, as in the case of cell wall proteins in the N. crassa Cps1 mutant (Fu et al., 2014). It has been shown that deletion of a gene involved in cell wall biosynthesis may induce a compensatory effect further modifying the structure (Beauvais et al., 2014; Latgé, 2010). However, our results suggest that the lack of cpsA does not lead to a compensatory effect in this case. The reduction of other cell wall components and structural alterations in the cpsA mutant cell wall could contribute to the observed increase in sensitivity to external stresses. For example, the fungal cell wall is the first line of defense for protection against exogenous oxidative stress (Fuchs and Mylonakis, 2009). Our results indicated that alterations in the expression of cpsA increases sensitivity to reactive oxygen species (ROS). In addition, wild-type expression levels of cpsA are also necessary for proper expression of thiO, catB (Hong et al., 2013; Kawasaki and Aguirre, 2001) and veA, also known to be involved in oxidative stress response (Baidya et al., 2014), that further contributes to this increased sensitivity to ROS in strains without a wild-type cpsA locus. Oxidative stress influences activation of fungal development and secondary metabolism (i.e Baidya et al., 2014; Etxebeste et al., 2010; Amare and Keller, 2014; Roze et al., 2013). However above certain thresholds, excessive exposure to ROS and other stresses in the cpsA mutant could lead to deleterious effects, negatively affecting the expression of numerous genes, including those involved in sexual and asexual development, as well as those involved in secondary metabolism in A. nidulans. Interestingly, in the case of ST, deletion of the rlmA gene, involved in cell wall integrity (Kovács et al., 2013) in a ΔveA strain did not recover toxin production, suggesting that although cpsA notably affects A. nidulans cell wall, this effect does not appear to be solely responsible for some of the biological changes observed in the absence of cpsA.
It is known though that the fungal cell wall not only plays an essential role in maintaining cell shape and protecting the cell against mechanical damage and other environmental stresses, but it is also involved in adhesion to environmental surfaces and in biofilm formation (de Groot et al., 2009; Yin et al., 2008; Brown et al., 2014). In pathogenic fungi, biofilms cause clinical problems, including resistance to antifungal drugs (Ramage et al., 2009). Importantly, our results revealed that cpsA is necessary for normal adhesion to surfaces. Biofilm formation, for which adhesion is necessary, is associated with complex regulation of cell surface protein synthesis, hyphal formation and secondary metabolism (Finkel and Mitchell, 2011; Beauvais et al., 2014). Physical contact, for example contact of fungal mycelium with bacteria, has been shown to be required to elicit a response that triggers the expression of specific secondary metabolite gene clusters (Schroeckh et al., 2009). This evidence supports that adhesion, which allows proper physical contact with surfaces, is intimately related with secondary metabolism regulation in response to this environment perception. In addition, in A. fumigatus, the secondary metabolite regulator laeA, was found highly upregulated during biofilm formation (Gibbons et al., 2011). In our studies, lack of proper adhesion in the cpsA mutant formation coincided with a reduction of laeA transcription, which could also negatively affect secondary metabolism. The reduction in adhesion in the absence of cpsA was also associated with a decrease in the expression of the developmental gene stuA, homolog of Candida albicans efg1, which is necessary for biofilm formation in this pathogenic fungus (Finkel and Mitchell, 2011; Gibbons et al., 2014). stuA plays multiples roles in fungi; in A. nidulans, besides its described role in the regulation of sexual development and possibly in adhesion, as suggested in our study, it is also involved in the regulation of asexual development (Wu and Miller, 1997; Miller et al., 1992), this holds true in A. fumigatus (Sheppard et al., 2005), as well as its role governing some secondary metabolite gene clusters (Sheppard et al., 2005; Twumasi-Boateng et al., 2009). In addition, the multiple functions described for stuA include the regulation of catalase-peroxidase gene cpeA in A. nidulans (Scherer et al., 2002), as well as cat1 in A. fumigatus (Sheppard et al., 2005). It is possible that besides the effects observed in development and possibly in biofilm formation, the reduction of stuA in the cpsA mutant could further contribute to accentuate the increased sensitivity to ROS. Lastly, in our study, loss of adhesion capacity in ΔcpsA was also associated with a reduction in the expression of the A. nidulans homolog of the A. fumigatus C2H2 zinc finger transcription factor gene dvrA (Ejzykowicz et al., 2010), and C. albicans and C. parasilosis bcr1 (Fanning and Mitchell, 2012; Nobile and Mitchell, 2005; Ding and Butler, 2007), known to play a critical role in biofilm formation.
In conclusion, our studies revealed that the veA-dependent genetic element cpsA in A. nidulans has a profound effect on secondary metabolism and morphological development. cpsA also proved to be critical for proper cell wall composition and integrity, as well as for normal adhesion capacity. The critical role of cpsA in fungal cell wall formation could in part determine resistance to environmental stressors, such as presence of ROS, osmostress or temperature variation. These multiple direct or indirect effects suggest a cross-talk and complex balance between different cpsA-dependent cell processes in A. nidulans that could be in part mediated by the effect of cpsA on the global regulators veA and laeA. The fact that the absence of cpsA results in a range of dramatic defects in this filamentous model fungus, together with the conservation of cpsA in many other fungal species, makes cpsA a potential desirable target in a control strategy to reduce the detrimental effects of fungi, including mycotoxin contamination. Additionally, since cpsA homologs are present in multiple fungal pathogens, this gene and its gene product could also be used as target for antifungal drugs. The study of A. nidulans cpsA exemplifies the strong interdependence of different cellular processes necessary for fitness and survival of fungal species.
Experimental Procedures
Fungal strains and growth conditions
The A. nidulans strains used in this study are listed in Table S2. Strains were grown on glucose minimum medium (GMM) (Käfer, 1977) and oat meal medium (OMM) (Butchko et al., 1999) containing the appropriate supplements for the corresponding auxotrophic markers (Käfer, 1977). Ten grams per liter was added in the case of solid medium. Strains were stored as 30% glycerol stocks at −80 °C.
Genetic techniques
Meiotic recombination was established between A. nidulans RM1 mutant obtained by chemical mutagenesis (Ramamoorthy et al., 2012) and the RJH030 strain (pabaA1; yA2; wA3; argB2; ΔstcE::argB; trpC801; veA1) as previously described (Pontecorvo et al., 1953). The progeny was analyzed for the presence or absence of the veA1 allele, first by phenotypic observation and finally confirmed by PCR. Colony morphology, as well as norsolorinic acid (NOR) production, were also examined. The progeny of this cross showed four phenotypic groups: 1. ΔveA, ΔstcE, X- (RM1 parental type); 2. ΔstcE (RJH030 parental type); 3. recombinant type ΔveA, ΔstcE (deletion veA phenotype); 4. recombinant type ΔstcE, X- (RM1-R2). Dominance test was carried out by generating diploids using RM1-R2 and RAV1 strains. Diploids were analyzed for NOR accumulation as well as morphological development.
Identification of the revertant mutation in RM1
To identify the mutated gene originally present in RM1, the RM1-R2 (ΔstcE, X-) strain was transformed with the A. nidulans genomic library pRG3-AMA1-NOT1. Plasmid DNA was extracted from fungal transformants showing wild-type phenotype. The end regions of the DNA inserts in the obtained plasmids were sequenced. The complete DNA insert sequence was found in the A. nidulans genome database (http://www.aspgd.org). To elucidate the location of the mutation in RM1, a PCR product was amplified from the same locus in RM1 and sequenced.
Sequence analysis
The deduced amino acid sequence of cpsA (AN9069) was compared against databases from other Aspergillus species and from different fungal genera, using the BLAST (blastp) tool provided by National Center for Biotechnology Information (NCBI), (http://www.ncbi.nlm.nih.gov/). TMHMM website (http://www.cbs.dtu.dk/services/TMHMM/) was also used for prediction of hydrophobic regions possibly acting as signal peptide or transmembrane domains in the comparison between several CpsA homologs from different Aspergillus species. The gene entry with the highest percentage of identity and the lowest e-value for each of the species was selected. Pairwise sequence alignment of the proteins was performed using the EMBOSS Needle tool (http://www.ebi.ac.uk/Tools/psa/emboss_needle/) from EMBL-EBI (European Molecular Biology Laboratory’s European Bioinformatics Institute). Percentage of similarities and percentage of identities were tabulated for each of the alignments. Multiple sequence alignment was performed with CpsA (A. nidulans) and homologs found across various fungal species using MAFFT version 6.0 (http://mafft.cbrc.jp/alignment/server/index.html), followed by shading with the Jalview 2.9.0b2 software (http://www.jaview.org/) (Waterhouse et al., 2009). Generation of the phylogenetic tree was performed by the MEGAv6 software (Tamura et al., 2013). Sequences were aligned using MUSCLE software. A maximum-likelihood tree was generated with a bootstrap value of 1000. Accession numbers for all sequences used are shown in Table S1.
Generation of the cpsA deletion and complementation strains
The DNA cassette used to delete cpsA was obtained by fusion PCR as previously described (Szewczyk et al., 2006). The 1.4 kb 5′ UTR and 1.5 kb 3′ UTR flanking regions of cpsA were PCR amplified with RM1-F1 and cps-P2, and cps-P3 and RM1-R2A primers sets, respectively (Table S6). The A. fumigatus pyrG selectable marker was amplified with cps-P5 and cps-P6 primers from plasmid p1439 (Stinnett et al., 2007). The 5′ and 3′ UTR fragments were then PCR fused to pyrGAfum to generate the cpsA replacement construct using primers RM1-F2 and RM1-R4. RDAE206 and RJMP1.49 were used as host strains. The resulting transformation strains were designated as TDAEDcpsA and TRVDcpsA, respectively. Genomic DNA from the selected transformants was analyzed by Southern blot.
A complementation strain was also obtained by transforming TRVΔcpsA with the cpsA wild-type allele. The complementation vector was generated as follows: a DNA fragment containing the entire cpsA wild-type locus, including 2.0 kb of upstream and 1.0 kb downstream regions, was amplified with the primers cps-com1 and cps-com2, digested with EcoRI and HindIII and ligated into pSM3 (containing pyroA), previously digested with the same enzymes, resulting in pSM3-cpsA-com. The complementation vector was then transformed into TRVΔcpsA using pyroA as selectable marker. Complementation was confirmed by PCR. The complemented strain was designated as TRVΔcpsA-com.
Generation of cpsA overexpression strain
To generate the cpsA overexpression strain, the entire cpsA coding region was first PCR amplified using the cps-OE1 and cps-OE2 primers, with engineered AscI and NotI sites (Table S6). The PCR product was then digested with AscI and NotI, and ligated into pTDS1 vector previously digested with the same enzymes. pTDS1 contains the A. nidulans gpdA promoter, trpC terminator and the pyrG marker. The resulting plasmid was denominated pTDS-cpsOE. The pTDS-cpsOE vector was transformed into RJMP1.49, and transformants were selected on appropriate selection medium without uridine and uracil, and confirmed by diagnostic PCR using gpdApromoF and cps-OE2 primers (Table S6).
Toxin analysis
Culture plates containing 25 ml of solid GMM were top-agar inoculated with 106 spores/plate, and incubated at 37 °C in the dark. Three cores (16 mm diameter) were collected from each replicate plate and extracted with 5 ml of chloroform. Alternatively, strains were incubated in GMM liquid shaken cultures (106 spores/ml) at 37 °C and 250 rpm. Culture supernatants were collected and extracted with chloroform. Extracts were dried overnight and then re-suspended in 500 μl of chloroform. Samples were fractionated by thin-layer chromatography (TLC) using benzene and glacial acetic acid [95:5 (v/v)] as solvent system for ST analysis, and chloroform: acetone: n-hexane (85:15:20) for NOR analysis. Aluminum chloride (15% in ethanol) were then sprayed on the plates, and baked at 80 °C for 10 min. Metabolites present on TLC plates were visualized under 375 nm UV light. Commercial ST (Sigma) was used as standard.
PN analysis
The PN bioassay was performed as previously described (Brakhage et al., 1992) with some modifications, using Bacillus calidolactis C953 as the test organism. Briefly, twenty-five milliliters of seed culture medium were inoculated using 106 spores/ml of wild type, deletion cpsA, complementation and overexpression strains, and incubated at 26 °C for 48 h at 250 rpm. Mycelia were washed and transferred to 20 ml of fermentation medium. Mycelial samples were harvested at 24 h and 48 h for gene expression analysis. After 96 h, the culture supernatants were collected for PN analysis. Four-hundred milliliters of Tryptone-Soy Agar was supplemented with 30 ml of B. calidolactis C953 culture and plated on five 150-mm-diameter Petri dishes. Twenty microlitres of each culture supernatant were added to 7-mm-diameter wells. The plates were incubated at 55°C for 24 h, when inhibition halos were visualized and measured. To verify that the observed antibacterial activity was due to the presence of PN, and not to the presence of different fungal compounds in the supernatant, controls containing commercial penicillinase from Bacillus cereus (Sigma, MO, USA) were also included. A standard curve using various concentrations of PN G (Sigma, MO, USA) was utilized to determine PN concentration in the supernatants.
Morphological studies
Plates containing 25 ml of solid GMM medium were inoculated with 5 ml of top agar containing 106 spores of wild type, ΔcpsA, complementation and overexpression strains. The cultures were incubated in dark or light at 37°C. Cores (7 mm diameter top agar layer) were removed from each culture after 48 h and 72 h and homogenized in water. Conidia and Hülle cells were counted using a hemacytometer. Identical cores were also taken to visualize cleistothecia under a dissecting microscope. To improve visualization of fruiting bodies, the cores were sprayed with 70% ethanol to remove conidiophores. To examine colony growth, each strain was point-inoculated on GMM plates and incubated under light or dark conditions at 37 °C for 6 days. Colony diameter was measured. Experiments were performed with three replicates.
Gene expression analysis
Total RNA was extracted from lyophilized mycelia as previously described (Weber et al., 1998). Gene expression levels were evaluated by Northern blot or quantitative reverse transcription-PCR (qRT-PCR) analysis. For Northern analysis, about 25 μg of total RNA of each sample was separated by agarose gel electrophoresis and blotted as described by Sambrook and Russell (2001). For qRT-PCR, total RNA was extracted from lyophilized mycelia using TRIsure (Bioline) reagent and RNeasy Mini Kit (Qiagen) according to the manufacturer instructions. Five μg of total RNA were treated with RQ1 RNase-Free DNase (Promega). cDNA was synthesized with Moloney murine leukaemia virus (MMLV) reverse transcriptase (Promega). qRT-PCR was performed with the Applied Biosystems 7000 Real-Time PCR System using SYBR green dye for fluorescence detection. A. nidulans actin gene expression was used as reference, and the relative expression levels were calculated using the 2−ΔΔCT method (Livak and Schmittgen, 2001). Primer pairs used are shown in Table S6.
Study of cpsA subcellular localization
Aspergillus nidulans RJMP1.49 strain was transformed with a cpsA::gfp::pyrGA.fum DNA cassette generated by fusion PCR as previously described (Szewczyk et al., 2006). Specifically, the cpsA coding region and the 3′ UTR were PCR amplified with RM1-F4 and cpsgfp-P2, and cpsgfp-P3 and RM1-R2A primers sets, respectively. The gfp::pyrGA.fum fragment was amplified with cpsgfp-P5 and cpsgfp-P6 primers from plasmid p1439. The fragments were then PCR fused to generate the cpsA::gfp::pyrGA.fum cassette using primers RM1-F5 and RM1-R3. Two transformants (TXF1.1 and TXF1.2) were selected for further study. An overexpression strain, gpdA(p)::cpsA::gfp::pyrGA.fum was also constructed as follows: cpsA::gfp was PCR amplified from TXF1.1 genomic DNA using cps-OE1 and GFPR + notI primers (Table S6), digested with AscI and NotI and ligated to pTDS1 vector previously digested with the same enzymes. The resulting plasmid was designated as pSSP4.1. The vector was then transformed into TSSP7.1 resulting in strain TSS19.1. Conidia from the selected transformants, TXF1.1 TXF1.2 and TSS19.1 were inoculated as previously described (Stinnett et al., 2007). Conidia were allowed to germinate on coverslip submerged in Watch minimal medium (WMM) (Peñalva, 2005) and incubated for 16 h. Time lapse microscopy was done using Stream acquisition with 200 ms exposure per frame using Metamorph software and a DMI6000b inverted microscope equipped with GFP and CMAC (UV) detection filters. Images were acquired with a Hamamatsu ORCA-ERII high-sensitivity monochrome digital CCD camera. Staining with CMAC (Molecular Probes) was carried out adding CMAC 10 μM to the culture and incubating during 5 min at 25 °C followed by three washes with WMM. CMAC (7-amino-4-chloromethylcoumarin) is commonly used for vacuole staining (acidic pH in vacuoles activates this dye). Stack of images was converted to mov (Quicktime) using ImageJ software and QTmoviemaker plugging. Movie 3 (showing only motile particles) is a stack of images from Movie 2 subjected to “Walking average” subroutine of ImageJ (4 images for media calculation) and then to “stack difference” (image interval set to 1). Both ImageJ pluggins were obtained from EMBL, https://www.embl.de/eamnet/html/body_kymograph.html.
Protein extraction and Western blot
Conidia of wild type and CpsA-GFP strain were inoculated in GMM and cultivated at 37 °C for 18 h in an orbital shaker at 250 rpm. Mycelia were collected and lyophilized. Part of each mycelial mat was subjected to protein extraction with an alkaline lysis protocol and another part to standardized protein extraction using A50 buffer as indicated in Hernández-Ortiz and Espeso (2013). Only the soluble fraction of A50 buffer extraction is normally collected and used for further analyses. In this manuscript we kept the insoluble fraction, which was treated with the alkaline lysis protocol to analyze insoluble proteins or those linked to endomembranes or plasma membrane. SDS-PAGE and Western blotting was performed using standard procedures. Proteins were transferred to nitrocellulose using the Transblot System from BioRad. Mouse antibodies clones 7.1 and 13.1 against GFP were obtained from Sigma (1/5000 dilution). Secondary anti-mouse antibody was obtained from Jackson (1/4000 dilution). Western blot was developed using the ECL chemiluminescent kit. Images were taken using a BioRad Chemidoc Imaging system and processed using Image Lab software (BioRad).
Cell wall stress assay
To test for possible alterations in the cell wall caused by either deletion or overexpression of cpsA, we exposed the wild type, ΔcpsA, complementation and overexpression strains to SDS or calcofluor white (CFW) as previously described by Riche et al (2009). GMM was amended with various concentrations of SDS (0, 0.001%, 0.002%, 0.003%, 0.004%, 0.005%), or calcofluor white (CFW) (0, 2, 4, 6, 8, 10 μg/ml). The strains were then point-inoculated on these media, and incubated at 37 °C for 3 days.
Cell wall chemical analysis
Conidia (106 spores/ml) from wild type, ΔcpsA, complementation and overexpression strains were inoculated in 50 ml of liquid GMM and incubated for 48 h at 37 °C and 250 rpm. Mycelium was harvested by filtration using miracloth, and washed twice with sterile distilled water. Five milligrams of dry mycelium was finely ground. Each sample was boiled in 1 ml of buffer A (2% SDS, 50 mM Tris-HCl, 100 mM Na-EDTA, 40 mM β-mercaptoethanol, 1 mM PMSF) for 15 min (Riche et al., 2009). Mannoprotein was extracted with 1M NaOH at 75 °C for 1 h and quantified as previous described (de Groot et al., 2008; Kapteyn et al., 2001). Glucan and chitin were digested in 96% formic acid at 100 °C for 4 h (Li et al., 2006). Formic acid was evaporated and residues were dissolved in 1 ml of distilled water. The contents of glucan and chitin were evaluated by the quantification of released glucose and N-acetylglucosamine after digestion. Glucose concentration was measured by the phenol-sulphuric acid method at 490 nm (Dubois et al., 1956). N-acetylglucosamine concentration was measured at 520 nm by the method described by Lee et al (2005). The experiment included five replicates.
Transmission Electron Microscopy
Samples were fixed in 2.5% glutaraldehyde in Millonig’s phosphate buffer for 3 h at 4 °C, rinsed (3 × 10 min) in Millonig’s phosphate buffer followed by a treatment with 1% osmium tetroxide (OsO4) for 2 h at room temperature. Then the samples were rinsed again (3 × 10 min) in Millonig’s phosphate buffer, dehydrated in graduated ethanol series and cleared in acetone. The specimens were embedded using an EMBed-812 kit (Electron Microscopy Sciences) and sectioned with a Reichert Om-U2 ultramicrotome using a Diatome diamond knife. Samples were stained with 2% uranyl acetate (Watson) followed by lead citrate (Sato). The fixation/dehydration/embedding was repeated twice (two separate experiments) with similar results. For each samples, twenty images were visualized with a Hitachi H-600 transmission electron microscope. Micrographs were taken with a SIA L12C digital camera operated using MaxIm DL version 5.08 software.
Adhesion assay
The possible effect of cpsA on A. nidulans adhesion capacity was tested using 96 well plates as previously described (Mowat et al., 2007; Pierce et al., 2008; Coffey and Anderson, 2014). Briefly, one hundred and thirty microliters of inoculated GMM (105 spores/ml) were placed in each of the 96 wells on polystyrene culture plates, and incubated at 37 °C for 24 h, 48 h and 72 h respectively. Then, the supernatant was removed and the mycelium attached to the surface was washed 3 times with distilled water before adding 130 μl of Crystal violet 0.01% in water. After 20 min at room temperature, the wells were washed 3 times with distilled water and were dried at room temperature. One hundred and thirty microliters of acetic acid 30% were used for distaining. OD was measured at 560 nm.
Oxidative and osmotic stress assays
In order to test whether cpsA affects A. nidulans response to oxidative stress, a method described by Tribus et al (2005) was used with some modifications. Solid GMM containing various concentrations of menadione (0, 0.04, 0.08, 0.12, 0.16, 0.20 mM) in 24 well plates were point-inoculated with the wild type, ΔcpsA, complementation and overexpression strains and incubated at 37 °C for 3 days. GMM without menadione was used as control.
Expression analysis of thiO and catB genes was examined by qRT-PCR and Northern blot, respectively, using the primers listed in Table S6. The strains (106 spores/ml) were inoculated in liquid GMM and incubated at 37°C in the dark for 48 h at 250 rpm. After that, approximately the same amount of mycelium from each strain was transferred to GMM with or without menadione (0.08 mM).
To test sensitivity to osmotic stress, the wild type, ΔcpsA, complementation and overexpression strains were point-inoculated on GMM and GMM supplemented with 0.7 M NaCl, or 1.2 M sorbitol. The cultures were also grown at different temperatures, 30 °C, 37 °C and 45 °C, to examine whether cpsA function is affected by this parameter.
Generation of ΔrlmA and ΔveA,ΔrlmA double mutant
The DNA cassette used to delete rlmA by gene replacement was obtained by the fusion PCR method as previously described (Szewczyk et al., 2006). The 1.3 kb 5′ UTR and 1.5 kb 3′ UTR of rlmA were amplified from genomic DNA with primers ANrmlA_P1, ANrmlA_P2 and ANrmlA_P3, ANrmlA_P4, respectively. The A. fumigatus pyrG selectable marker was amplified with ANrmlA_P5_pyrGafum and ANrmlA_P6_pyrGafum primers from plasmid p1439. The 5′ UTR and 3′ UTR fragments were fused to pyrGA.fum using ANrlm_p7 and ANrlm_p8 primers. TSSP7.1 strain was utilized as host for the transformation, generating TSSP15.1. The DNA cassette was also used to delete rlmA in TXF3.1 (ΔveA), generating TSSP16.1. Deletion of rlmA and veA was confirmed by PCR.
Analysis of hyaluronic acid and glycosyl composition of cell wall fractions
Plates containing 25 ml of liquid GMM were inoculated with 106 spores/ml of wild type, ΔcpsA, complementation and overexpression strains. The cultures were then incubated in dark at 37 °C for 48 h, when mycelium was collected by filtration using Miracloth. The cell wall samples were obtained as follows: mycelium was first washed with 1xPBS and lyophilized. Then samples were ground, washed with 1xPBS four times, and boiled in water for 10 min, followed by four additional washes with 1xPBS and water. The cell wall samples were sent to the Complex Carbohydrate Research Center (Athens, GA) for analysis. Approximately 0.5 g of each cell wall fraction was suspended in 5 mL of HA buffer (50 mM sodium acetate, pH 6) and hyaluronase (from Streptomyces hyalurolyticus), final concentration 0.05 U/mL. The digestion was carried out at 55 °C for 24 h. A second aliquot of enzyme was added at that time and the reaction was allowed to continue for another 24 h. The reaction was then stopped by boiling for 10 min and filtered through a C18 SPE cartridge to separate out any remaining solids and to remove any remaining protein from solution. The filtrate was then lyophilized and reconstituted in 500 μl of water and analyzed by HPLC. Compounds were separated using an Agilent system with a 4.6×250 mm Waters Spherisorb analytical column with 5μm particle size at 25°C, and a solvent gradient (solvent A: 2.5 mM sodium phosphate, pH 3.5 and solvent B:) 2.5 mM sodium phosphate, 1.2 M NaCl, pH 3.5), and a flow rate of 1 mL/min. Detection was performed by post-column derivatization. Briefly, the eluent from the column was combined with a 1:1 mixture of 0.25 M NaOH and 1% 2-cyanoacetamide pumped at a flow rate of 0.5 mL/min from a post column reactor. The eluent was heated to 130 °C in a 10-m reaction coil, then cooled in a 50-cm cooling coil and measured with a fluorescence detection (λex = 346 nm, λem = 410). Identification and quantification was determined by comparison with a digestion of Hyaluronan as positive control.
Cell wall monosaccharide components were analyzed by GC-MS. Approximately 2 mg of wild type and ΔcpsA cell wall samples were placed in screw-cap tubes, 1 μL of 1 mg/mL inositol was added as internal standard, and the samples were lyophilized. Methyl glycosides then were prepared from the dried samples by methanolysis with 3 M HCl in methanol at 100 °C for 2 h, and re-N-acetylation with pyridine and acetic anhydride in methanol. The samples then were per-O-trimethylsilylated (TMS) with a Tri-Sil reagent (Thermo Scientific) at 80 °C for 30 min. Analysis of the TMS methyl glycosides was performed on a Agilent 7890A gas chromatograph equipped with a Supelco EC-1 fused silica capillary column (30 m × 0.25 mm ID) and interfaced to a Agilent 5975C inert MSD.
Analysis of EPS
To assess whether hyaluronan is present in EPS of A. nidulans, its glycosyl composition of the EPS was analyzed by GC-MS in our laboratory. EPS was first precipitated from culture supernatants of wild type and cpsA mutant strain with 1 volume of ethanol 96% and dialyzed with water using a membrane with a 3 kDa cutoff. Samples were first hydrolyzed with 3 M trifluoroacetic acid (TFA) at 121 °C for 1 h, and derivatized and analyzed as previously reported (Bernabé et al., 2011).
In addition, EPS was also analyzed by infrared spectroscopy. Infrared spectra were obtained by the KBr technique. In brief, approximately 2 mg of dry sample were thoroughly mixed in a mortar with 300 mg of KBr and maintained in a desiccator. The pellet was prepared by using a hydraulic press, applying a pressure of 2 tons for 2 minutes and then 10 tons for 6 min. The spectra were recorded in a FTIR 4200 type A instrument (Jasco Corporation, Tokyo, Japan). Light source of transmittance was in the middle range infrared 700–4000 cm−1. The detector used was triglycine-sulfate (TGS) with resolution 4 cm−1.
The type of linkages in the EPS was also analyzed after methylation of dry samples (1–3 mg). Then samples were dissolved in dimethyl sulfoxide and processed according to the method of Ciucanu and Kerek (1984). The per-O-methylated polysaccharides were hydrolyzed with 3 M TFA, reduced with NaBD4, derivatized to their corresponding partially methylated alditol acetates, and analyzed GC-MS as previously described (Notararigo et al., 2013).
Analysis of monosaccharides in membrane
Protoplasts from the wild-type strain TRV50.2 were prepared from mycelium grown on GMM for 16 h. Four grams of mycelium was treated with Glucanex (Novozymes) for 1.5 h in 1.2 M MgSO4, 10 mM phosphate buffer at pH 6.5. Protoplasts were purified as described in the transformation protocol from Tilburn et al (1983) and lyophilized. The sample was hydrolyzed with TFA under the same conditions described for EPS analysis, and the compounds released were derivatized both as alditol acetates and as TMS-oxymes before GC/MS analysis.
Supplementary Material
Figure S1. RM1 presents a single mutation in cpsA gene. (A) Complementation insert from the genomic library plasmid in the RM1 mutant and corresponding genomic fragment in the RM1 mutant. (B) Alignment of the deduced amino acid sequences of A. nidulans cpsA and putative homologs in other Aspergillus species. The species compared are: Aspergillus terreus (NIH2624), Aspergillus clavatus (NRRL 1), Aspergillus fumigatus (Af293), Aspergillus niger (CBS 513.88, asterisk after residue A304 indicates the exclusive presence of 76 non-conserved amino acids, coordinates 305–380, in A.niger CpsA putative homolog), Aspergillus oryzae (RIB40), and Aspergillus flavus (NRRL 3357). Accession numbers of protein sequence are located in Table S1. The alignment was performed with MAFFT (http://www.ebi.ac.uk/Tools/msa/mafft/) multiple sequence alignment software program. The red arrow shows the point mutation at nucleotide +568 of the cpsA coding region, from GAT to AAT, resulting in a change from glutamic acid (D) to Asparagine (N). Conserved residues are highlighted in blue with Jalview 2.9.0b2 (http://www.jaview.org/)) software program. The conserved domain, GT2_HA, is indicated with an orange bar (amino acid residues, 45–290), predicted Signal peptide and TM domains are indicated with cian and brown boxes, respectively.
Table S1. Sequence analysis of CpsA homologs in different fungi using NCBI BLAST and NEEDLE Pairwise sequence alignment.
Table S2. Fungal strains used in this study.
Table S3. Glycosyl composition analysis of cell wall fractions by GC-MS
Table S4. Monosaccharides (%) released from the exopolysaccharide (EPS) after acid hydrolysis with 3 M TFA for 1 h at 120 ºC, detected as alditol acetates.
Table S5. Monosaccharides (%) identified in membranes of A. nidulans wild type using GC/MS after acid hydrolysis with 3 M TFA for 1 h at 120 ºC.
Table S6. Primers used in this study.
Infrared spectra were obtained from wild type and cpsA mutant by the KBr method described in Materials and Methods. IR spectra from both samples were identical.
The type and abundance (%) of the linkages were deduced by methylation analysis of the EPS from A. nidulans wild type (wt) and cpsA mutant (mut). After derivatization to their corresponding partially methylated alditol acetates, samples were analyzed by GC-MS as described in Materials and Methods.
Multiple sequence alignment of CpsA putative homologs. Alignment was generated using MAFFT. The alignment was visualized by Jalview with conserved residues in dark blue. Species represented in alignment are: Aspergillus nidulans (Anid), Histoplasma capsulatum (Hcap), Trichoderma reesei (Tree), Botrytis cinerea (Bcin), Fusarium oxysporum (Foxy), Neurospora crassa (Ncra), Coccidioides immitis (Cimm), Stachybotrys chartarum (Scha), Acremonium chrysogeum (Achr), Cryptococcus neoformans (Cneo), Coprinopsis cinera (Ccin), and Sphaerobolus stellastus (Sste). Accession numbers of each protein sequence are located in Table S1.
Phylogenetic tree of CpsA putative homologs from different fungal species. Phylogenetic trees constructed using MEGA v6.0. Trees were constructed with Maximum-Likelihood model with a bootstrap value of 1000. Green branches indicate Aspergillus spp., blue branches indicate other Ascomycota outside of Aspergillus, and red represents species from Basidomycota.
The species compared are: Streptomyces pneumoniae, Streptacidiphilus albus, Actinomadura macra, Piscicoccus intestinalis, Frankia elaeagni, and Pseudonocardia acacia. The alignment was performed with MAFFT (http://www.ebi.ac.uk/Tools/msa/mafft/) multiple sequence alignment software program. Conserved residues are highlighted in black with BOXshade (http://www.ch.embnet.org/) software program. The conserved domain, GT2_HA, is underlined (amino acid residues, 45–290). DDD and XDD motifs are indicated with red boxes.
(A) Schematic diagram showing the replacement of cpsA with the A. fumigatus pyrG gene (pyrGA. fum) by a double-crossover event. XhoI restriction sites and probe template used in the Southern blot analysis to confirm the proper integration of the cassette are shown. (B) Southern blot analysis results of TDAEΔcpsA and TRVΔcpsA transformants. The expected band sizes were 5.6 kb for wild type (WT) and 3.1 kb for ΔcpsA. (C) Linear diagram of cpsA complementation plasmid pSM3-cpsA-com. The complementation strain was confirmed by diagnostic PCR, using primers RM1-F5 (F) and cps-OE2 (R) the expected 0.9 kb PCR product is shown. (C) Linear diagram of cpsA overexpression plasmid pTDS-cpsOE. The overexpression transformants were confirmed by PCR with primers gpdApromoF (F) and cps-OE2 primers (R) yielded the predicted 1.8 kb product. (D) Expression analysis of cpsA by Northern blot. Wild type veA+ control (WT), ΔcpsA, complementation (com) and overexpression (OE) strains were inoculated in liquid GMM and incubated at 37 °C for 72 h. Densitometry of the Northen blot results is shown. Asterisk indicates not detected.
Wild-type veA+ control (WT), ΔcpsA, complementation (com) and overexpression (OE) strains were top-agar inoculated and incubated at 37 °C in the dark for 2, 3 and 6 days. ST production was analyzed as described in the Materials and Methods section. White arrows indicate additional unknown compounds whose synthesis is cpsA-dependent.
Fusion CpsA-GFP was overexpressed using the gpdA promoter. A micrograph of strain TSSP19.1 (Table S1) Localization of OE-CpsA-GFP is nearly identical to that observed using the cpsA endogenous propmoter. A kymograph shows the presence of static (grey triangles) and motile fluorescence accumulations, probably early endosomes. These organelles move in anterograde (c) or retrograde (b) direction and some reached the tip of the cell but rapidly migrate in opposite direction (a). Accumulation of CpsA-GFP at the plasma membrane was not detected.
Wild type veA+ control (WT), ΔcpsA, complementation (com) and overexpression (OE) strains were point inoculated on GMM or GMM containing 0.7 M NaCl or 1.2 M of sorbitol, and incubated at 30 °C, 37°C or 45 °C in dark for 3 days.
(A) Diagrams and verification of rlmA deletion in TSSP15.1 (ΔrlmA) and in TSSP16.1 (ΔveA ΔrlmA), and (B) veA deletion in TXF2.1p (ΔveA) and also in TSSP16.1 (ΔveA ΔrlmA). The strains were confirmed by diagnostic PCR, obtaining the expected 2.7 kb (using primers ANrmlA_P1 (F) and pyrG_Afum_R (R)) and 2.8 kb products (using primers veAF5′UTR (F) and pyroA (R)), respectively. (C) TLC analysis of ST from wild type (WT), ΔveA, ΔrlmA and ΔveAΔrlmA double mutant from top-agar inoculated GMM cultures incubated for 72 h at 37 °C. ST standard (ST) was included on both sides of the TLC plate. (D) Densitometry of ST performed using GelQuantNET software. ST band intensity was normalized with respect to that of the wild type considered as 1.
Time-lapse series of 90 frames using stream acquisition protocol in Metamorph software. 200 ms exposure per frame. Movie is set up to 7 frames per second, and correspond to the dashed line square indicated in Figure 7.
Time-lapse series of 90 frames using stream acquisition protocol in Metamorph software. 200 ms exposure per frame. Movie is set up to 7 frames per second.
Movie 2 was subjected to “Walking average” subroutine of ImageJ (4 images for media calculation) and then to “stack difference” (image interval set to 1).
Acknowledgments
This work was supported by NIH Grant 2R15AI081232-02 awarded to Ana M. Calvo. This research was also supported in part by the National Institutes of Health (NIH)-funded Research Resource for Integrated Glycotechnology” (NIH grant no. 5P41GM10339024) to Parastoo Azadi at the Complex Carbohydrate Research Center. AMC also thanks Jessica Lohmar, Tim Satterlee, Parastoo Azadi, Yanbin Yi, Scott Grayburn, Lori Bross, James Horn, and Barbara Ball for their technical support.
References
- Adams TH, Boylan MT, Timberlake WE. brlA is necessary and sufficient to direct conidiophore development in Aspergillus nidulans. Cell. 1988;54:353–362. doi: 10.1016/0092-8674(88)90198-5. [DOI] [PubMed] [Google Scholar]
- Adams TH, Yu JH. Coordinate control of secondary metabolite production and asexual sporulation in Aspergillus nidulans. Curr Opin Microbiol. 1998;1:674–677. doi: 10.1016/s1369-5274(98)80114-8. [DOI] [PubMed] [Google Scholar]
- Adrio JL, Demain AL. Fungal biotechnology. Int Microbiol. 2003;6:191–199. doi: 10.1007/s10123-003-0133-0. [DOI] [PubMed] [Google Scholar]
- Ahmed YL, Gerke J, Park HS, Bayram Ö, Neumann P, Ni M, et al. The velvet family of fungal regulators contains a DNA-binding domain structurally similar to NF-κB. PLoS Biol. 2013;11(12):e1001750. doi: 10.1371/journal.pbio.1001750. [DOI] [PMC free article] [PubMed] [Google Scholar]
- Amare MG, Keller NP. Molecular mechanisms of Aspergillus flavus secondary metabolism and development. Fungal Genet Biol. 2014;66:11–18. doi: 10.1016/j.fgb.2014.02.008. [DOI] [PubMed] [Google Scholar]
- Araújo-Bazán L, Dhingra S, Chu J, Fernández-Martínez J, Calvo AM, Espeso EA. Importin alpha is an essential nuclear import carrier adaptor required for proper sexual and asexual development and secondary metabolism in Aspergillus nidulans. Fungal Genet Biol. 2009;46(6–7):506–515. doi: 10.1016/j.fgb.2009.03.006. [DOI] [PubMed] [Google Scholar]
- Atoui A, Kastner C, Larey CM, Thokala R, Etxebeste O, Espeso EA, et al. Cross-talk between light and glucose regulation controls toxin production and morphogenesis in Aspergillus nidulans. Fungal Genet Biol. 2010;47:962–972. doi: 10.1016/j.fgb.2010.08.007. [DOI] [PMC free article] [PubMed] [Google Scholar]
- Baidya S, Duran RM, Lohmar JM, Harris-Coward PY, Cary JW, Hong SY, et al. VeA is associated with the response to oxidative stress in the aflatoxin producer Aspergillus flavus. Eukaryot Cell. 2014;13:1095–1103. doi: 10.1128/EC.00099-14. [DOI] [PMC free article] [PubMed] [Google Scholar]
- Bayram ÖS, Bayram Ö, Valerius O, Park HS, Irniger S, Gerke J, et al. LaeA control of Velvet family regulatory proteins for light-dependent development and fungal cell-type specificity. PLoS Genet. 2010;6(12):e1001226. doi: 10.1371/journal.pgen.1001226. [DOI] [PMC free article] [PubMed] [Google Scholar]
- Bayram O, Braus GH. Coordination of secondary metabolism and development in fungi: the velvet family of regulatory proteins. FEMS Microbiol Rev. 2012;36:1–24. doi: 10.1111/j.1574-6976.2011.00285.x. [DOI] [PubMed] [Google Scholar]
- Bayram O, Krappmann S, Ni M, Bok JW, Helmstaedt K, Valerius O, et al. VelB/VeA/LaeAcomplex coordinates light signal with fungal development and secondary metabolism. Science. 2008;320:1504–1506. doi: 10.1126/science.1155888. [DOI] [PubMed] [Google Scholar]
- Beauvais A, Fontaine T, Aimanianda V, Latgé JP. Aspergillus cell wall and biofilm. Mycopathologia. 2014;178:371–377. doi: 10.1007/s11046-014-9766-0. [DOI] [PubMed] [Google Scholar]
- Beauvais A, Muller FM. Biofilm formation in Aspergillus fumigatus. In: Latge JP, Steinbach WJ, editors. Aspergillus fumigatus and aspergillosis. Washington (D.C.): ASM Press; 2009. pp. 149–157. [Google Scholar]
- Bennett JW, Klich M. Mycotoxins. Clin Microbiol Rev. 2003;16:497–516. doi: 10.1128/CMR.16.3.497-516.2003. [DOI] [PMC free article] [PubMed] [Google Scholar]
- Bernabé M, Salvachúa D, Jiménez-Barbero J, Leal JA, Prieto A. Structures of wall heterogalactomannans isolated from three genera of entomopathogenic fungi. Fungal Biology. 2011;115:862–870. doi: 10.1016/j.funbio.2011.06.015. [DOI] [PubMed] [Google Scholar]
- Beyhan S, Gutierrez M, Voorhies M, Sil A. A temperature-responsive network links cell shape and virulence traits in a primary fungal pathogen. PLoS Biol. 2013;11(7):e1001614. doi: 10.1371/journal.pbio.1001614. [DOI] [PMC free article] [PubMed] [Google Scholar]
- Bok JW, Keller NP. LaeA, a regulator of secondary metabolism in Aspergillus spp. Eukaryot Cell. 2004;3:527–35. doi: 10.1128/EC.3.2.527-535.2004. [DOI] [PMC free article] [PubMed] [Google Scholar]
- Bothe M, Dutow P, Pich A, Genth H, Klos A. DXD motif-dependent and -independent effects of the Chlamydia trachomatis cytotoxin CT166. Toxins (Basel) 2015;7:621–637. doi: 10.3390/toxins7020621. [DOI] [PMC free article] [PubMed] [Google Scholar]
- Boylan MT, Mirabito PM, Willett CE, Zimmerman CR, Timberlake WE. Isolation and physical characterization of three essential conidiation genes from Aspergillus nidulans. Mol Cell Biol. 1987;7:3113–3118. doi: 10.1128/mcb.7.9.3113. [DOI] [PMC free article] [PubMed] [Google Scholar]
- Brakhage AA, Browne P, Turner G. Regulation of Aspergillus nidulans penicillin biosynthesis and penicillin biosynthesis genes acvA and ipnA by glucose. J Bacteriol. 1992;174:3789–3799. doi: 10.1128/jb.174.11.3789-3799.1992. [DOI] [PMC free article] [PubMed] [Google Scholar]
- Brakhage AA, Schroeckh V. Fungal secondary metabolites – strategies to activate silent gene clusters. Fungal Genet Bio. 2011;48:15–22. doi: 10.1016/j.fgb.2010.04.004. [DOI] [PubMed] [Google Scholar]
- Breton C, Snajdrová L, Jeanneau C, Koca J, Imberty A. Structures and mechanisms of glycosyltransferases. Glycobiology. 2006;16:29R–37R. doi: 10.1093/glycob/cwj016. [DOI] [PubMed] [Google Scholar]
- Brown NA, Dos Reis TF, Goinski AB, Savoldi M, Menino J, Almeida MT, et al. The Aspergillus nidulans signalling mucin MsbA regulates starvation responses, adhesion and affects cellulase secretion in response to environmental cues. Mol Microbiol. 2014;94:1103–1120. doi: 10.1111/mmi.12820. [DOI] [PubMed] [Google Scholar]
- Brown DW, Yu JH, Kelkar HS, Fernandes M, Nesbitt TC, Keller NP, et al. Twenty-five coregulated transcripts define a sterigmatocystin gene cluster in Aspergillus nidulans. Proc Natl Acad Sci USA. 1996;93:1418–1422. doi: 10.1073/pnas.93.4.1418. [DOI] [PMC free article] [PubMed] [Google Scholar]
- Busch C, Hofmann F, Selzer J, Munro S, Jeckel D, Aktories K. A common motif of eukaryotic glycosyltransferases is essential for the enzyme activity of large clostridial cytotoxins. J Biol Chem. 1998;273:19566–19572. doi: 10.1074/jbc.273.31.19566. [DOI] [PubMed] [Google Scholar]
- Butchko RA, Adams TH, Keller NP. Aspergillus nidulans mutants defective in stc gene cluster regulation. Genetics. 1999;153:715–720. doi: 10.1093/genetics/153.2.715. [DOI] [PMC free article] [PubMed] [Google Scholar]
- Calvo AM. The VeA regulatory system and its role in morphological and chemical development in fungi. Fungal Genet Biol. 2008;45:1053–1061. doi: 10.1016/j.fgb.2008.03.014. [DOI] [PubMed] [Google Scholar]
- Calvo AM, Bok J, Brooks W, Keller NP. veA is required for toxin and sclerotial production in Aspergillus parasiticus. Appl Environ Microbiol. 2004;70:4733–4739. doi: 10.1128/AEM.70.8.4733-4739.2004. [DOI] [PMC free article] [PubMed] [Google Scholar]
- Calvo AM, Cary JW. Association of fungal secondary metabolism and sclerotial biology. Frontiers Review. 2014;5(768):1–42. doi: 10.3389/fmicb.2015.00062. [DOI] [PMC free article] [PubMed] [Google Scholar]
- Calvo AM, Lohmar JM, Ibarra B, Satterlee T. Mycota Series. In: Wedland J, editor. Velvet Regulation of Fungal Development. 3. I. Springer International Publishing; 2016. pp. 475–497. [Google Scholar]
- Calvo AM, Wilson RA, Bok JW, Keller NP. Relationship between secondary metabolism and fungal development. Microbiol Mol Biol Rev. 2002;66:447–459. doi: 10.1128/MMBR.66.3.447-459.2002. [DOI] [PMC free article] [PubMed] [Google Scholar]
- Cary JW, Han Z, Yin Y, Lohmar JM, Shantappa S, Harris-Coward PY, et al. Transcriptome analysis of Aspergillus flavus reveals veA-dependent regulation of secondary metabolite gene clusters, including the novel aflavarin cluster. Eukaryot Cell. 2015;14:983–997. doi: 10.1128/EC.00092-15. [DOI] [PMC free article] [PubMed] [Google Scholar]
- Chanda A, et al. A key role for vesicles in fungal secondary metabolism. Proc Natl Acad Sci U S A. 2009;106:19533–19538. doi: 10.1073/pnas.0907416106. [DOI] [PMC free article] [PubMed] [Google Scholar]
- Chang YC, Jong A, Huang S, Zerfas P, Kwon-Chung KJ. CPS1, a homolog of the Streptococcus pneumoniae type 3 polysaccharide synthase gene, is important for the pathobiology of Cryptococcus neoformans. Infect Immun. 2006;74:3930–3938. doi: 10.1128/IAI.00089-06. [DOI] [PMC free article] [PubMed] [Google Scholar]
- Chettri P, Calvo AM, Cary JW, Dhingra S, Guo Y, McDougal RL, et al. The veA gene of the pine needle pathogen Dothistroma septosporum regulates sporulation and secondary metabolism. Fungal Genet Biol. 2012;49:141–151. doi: 10.1016/j.fgb.2011.11.009. [DOI] [PubMed] [Google Scholar]
- Ciucanu I, Kerek F. A simple and rapid method for the permethylation of carbohydrates. Carbohydrate Research. 1984;131:209–217. [Google Scholar]
- Coffey BM, Anderson GG. Biofilm Formation in the 96-Well Microtiter Plate. Methods Mol Biol. 2014;1149:631–641. doi: 10.1007/978-1-4939-0473-0_48. [DOI] [PubMed] [Google Scholar]
- Cole RJ, Cox RH. Handbook of Toxic Fungal Metabolites. New York: Academic Press; 1981. [Google Scholar]
- Coley-Smith JR, Cooke RC. Survival and germination of fungal sclerotia. Annu Rev Phytopathol. 1971;9:65–92. [Google Scholar]
- de Groot PW, Brandt BW, Horiuchi H, Ram AF, de Koster CG, Klis FM. Comprehensive genomic analysis of cell wall genes in Aspergillus nidulans. Fungal Genet Biol. 2009;1:S72–81. doi: 10.1016/j.fgb.2008.07.022. [DOI] [PubMed] [Google Scholar]
- de Groot PW, Kraneveld EA, Yin QY, Dekker HL, Gross U, de Koster CG, et al. The cell wall of the human pathogen Candida glabrata: differential incorporation of novel adhesin-like wall proteins. Eukaryot Cell. 2008;7:1951–1964. doi: 10.1128/EC.00284-08. [DOI] [PMC free article] [PubMed] [Google Scholar]
- Dhingra S, Andes D, Calvo AM. VeA regulates conidiation, gliotoxin production and protease activity in the opportunistic human pathogen Aspergillus fumigatus. Eukaryotic Cell. 2012;11:1531–1543. doi: 10.1128/EC.00222-12. [DOI] [PMC free article] [PubMed] [Google Scholar]
- Dhingra S, Lind AL, Lin HC, Tang Y, Rokas A, Calvo AM. The fumagillin gene cluster, an example of hundreds of genes under veA control in Aspergillus fumigatus. PLoS One. 2013;8(10):e77147. doi: 10.1371/journal.pone.0077147. [DOI] [PMC free article] [PubMed] [Google Scholar]
- Ding C, Butler G. Development of a gene knockout system in Candida parapsilosis reveals a conserved role for BCR1 in biofilm formation. Eukaryot Cell. 2007;6:1310–1319. doi: 10.1128/EC.00136-07. [DOI] [PMC free article] [PubMed] [Google Scholar]
- Dreyer J, Eichhorn H, Friedlin E, Kurnsteiner H, Kuck U. A homologue of the Aspergillus velvet gene regulates both cephalosporin C biosynthesis and hyphal fragmentation in Acremonium chrysogenum. Appl Environ Microbiol. 2007;73(10):3412–3422. doi: 10.1128/AEM.00129-07. [DOI] [PMC free article] [PubMed] [Google Scholar]
- Dubois M, Gilles KA, Hamilton JK, Rebers PA, Smith F. Colorimetric method for determination of sugars and related substances. Anal Chem. 1956;28:350–356. [Google Scholar]
- Duran RM, Cary JW, Calvo AM. Production of cyclopiazonic acid, aflatrem, and aflatoxin by Aspergillus flavus is regulated by veA, a gene necessary for sclerotial formation. Appl Microbiol Biotechnol. 2007;73:1158–1168. doi: 10.1007/s00253-006-0581-5. [DOI] [PubMed] [Google Scholar]
- Duran RM, Cary JW, Calvo AM. The role of veA on Aspergillus flavus infection of peanuts, corn and cotton. Open Mycol J. 2009;3:27–36. [Google Scholar]
- Duran RM, Gregersen S, Smith TD, Bhetariya PJ, Cary JW, Harris-Coward PY, et al. Aspergillus flavus veA in the production of extracellular proteins during growth on starch substrates. Appl Microbiol Biotechnol. 2014;98:5081–5094. doi: 10.1007/s00253-014-5598-6. [DOI] [PubMed] [Google Scholar]
- Ejzykowicz DE, Solis NV, Gravelat FN, Chabot J, Li X, Sheppard DC, et al. Role of Aspergillus fumigatus DvrA in host cell interactions and virulence. Eukaryot Cell. 2010;9:1432–1440. doi: 10.1128/EC.00055-10. [DOI] [PMC free article] [PubMed] [Google Scholar]
- Etxebeste O, Ugalde U, Espeso EA. Adaptative and developmental responses to stress in Aspergillus nidulans. Curr Protein Pept Sci. 2010;11:704–718. doi: 10.2174/138920310794557682. [DOI] [PubMed] [Google Scholar]
- Fanning S, Mitchell AP. Fungal biofilms. PLoS Pathog. 2012;8(4):e1002585. doi: 10.1371/journal.ppat.1002585. [DOI] [PMC free article] [PubMed] [Google Scholar]
- Fekete E, Karaffa L, Karimi Aghcheh R, Németh Z, Fekete E, Orosz A, et al. The transcriptome of lae1 mutants of Trichoderma reesei cultivated at constant growth rates reveals new targets of LAE1 function. BMC Genomics. 2014;15:447. doi: 10.1186/1471-2164-15-447. [DOI] [PMC free article] [PubMed] [Google Scholar]
- Fernandes M, Keller NP, Adams TH. Sequence-specific binding by Aspergillus nidulans AflR, a C-6 zinc cluster protein regulating mycotoxin biosynthesis. Mol Microbiol. 1998;28:1355–1365. doi: 10.1046/j.1365-2958.1998.00907.x. [DOI] [PubMed] [Google Scholar]
- Finkel JS, Mitchell AP. Genetic control of Candida albicans biofilm development. Nat Rev Microbiol. 2011;9:109–118. doi: 10.1038/nrmicro2475. [DOI] [PMC free article] [PubMed] [Google Scholar]
- Fontaine T, Lamarre C, Simenel C, Lambou K, Coddeville B, Delepierre M, et al. Characterization of glucuronic acid containing glycolipid in Aspergillus fumigatus mycelium. Carbohydr Res. 2009;344:960–1967. doi: 10.1016/j.carres.2009.07.012. [DOI] [PubMed] [Google Scholar]
- Fu C, Sokolow E, Rupert CB, Free SJ. The Neurospora crassa CPS-1 polysaccharide synthase functions in cell wall biosynthesis. Fungal Genet Biol. 2014;69:23–30. doi: 10.1016/j.fgb.2014.05.009. [DOI] [PMC free article] [PubMed] [Google Scholar]
- Fuchs BB, Mylonakis E. Our paths might cross: the role of the fungal cell wall integrity pathway in stress response and cross talk with other stress response pathways. Eukaryot Cell. 2009;8:1616–1625. doi: 10.1128/EC.00193-09. [DOI] [PMC free article] [PubMed] [Google Scholar]
- Gibbons JG, Beauvais A, Beau R, McGary KL, Latgé JP, Rokas A. Global transcriptome changes underlying colony growth in the opportunistic human pathogen Aspergillus fumigatus. Eukaryot Cell. 2011;11:68–78. doi: 10.1128/EC.05102-11. [DOI] [PMC free article] [PubMed] [Google Scholar]
- Gulberti S, Fournel-Gigleux S, Mulliert G, Aubry A, Netter P, Magdalou J, et al. The functional glycosyltransferase signature sequence of the human beta 1,3-glucuronosyltransferase is a XDD motif. J Biol Chem. 2003;278:32219–32226. doi: 10.1074/jbc.M207899200. [DOI] [PubMed] [Google Scholar]
- Han KH, Han KY, Yu JH, Chae KS, Jahng KY, Han DM. The nsdD gene encodes a putative GATA type transcription factor necessary for sexual development of Aspergillus nidulans. Mol Microbiol. 2001;41:299–309. doi: 10.1046/j.1365-2958.2001.02472.x. [DOI] [PubMed] [Google Scholar]
- Hernández-Ortiz P, Espeso EA. Phospho-regulation and nucleocytoplasmic trafficking of CrzA in response to calcium and alkaline-pH stress in Aspergillus nidulans. Mol Microbiol. 2013;89:532–551. doi: 10.1111/mmi.12294. [DOI] [PubMed] [Google Scholar]
- Hicks JK, Yu JH, Keller NP, Adams TH. Aspergillus sporulation and mycotoxin production both require inactivation of the FadA G alpha protein dependent signaling pathway. FMBO J. 1997;16:4916–4923. doi: 10.1093/emboj/16.16.4916. [DOI] [PMC free article] [PubMed] [Google Scholar]
- Hoff B, Kamerewerd J, Sigl C, Mitterbauer R, Zadra I, Kürnsteiner H, et al. Two components of a velvet-like complex control hyphal morphogenesis, conidiophore development, and penicillin biosynthesis in Penicillium chrysogenum. Eukaryot Cell. 2010;9:1236–1250. doi: 10.1128/EC.00077-10. [DOI] [PMC free article] [PubMed] [Google Scholar]
- Hong SY, Roze LV, Linz JE. Oxidative stress-related transcription factors in the regulation of secondary metabolism. Toxins. 2013;5:683–702. doi: 10.3390/toxins5040683. [DOI] [PMC free article] [PubMed] [Google Scholar]
- Jiang J, Liu X, Yin Y, Ma Z. Involvement of a velvet protein FgVeA in the regulation of asexual development, lipid and secondary metabolisms and virulence in Fusarium graminearum. Plos One. 2011;6(11):e28291. doi: 10.1371/journal.pone.0028291. [DOI] [PMC free article] [PubMed] [Google Scholar]
- Jong A, Wu CH, Chen HM, Luo F, Kwon-Chung KJ, Chang YC, et al. Identification and characterization of CPS1 as a hyaluronic acid synthase contributing to the pathogenesis of Cryptococcus neoformans infection. Eukaryot Cell. 2007;6:1486–1496. doi: 10.1128/EC.00120-07. [DOI] [PMC free article] [PubMed] [Google Scholar]
- Käfer E. Origins of translocations in Aspergillus nidulans. Genetics. 1965;52:217–232. doi: 10.1093/genetics/52.1.217. [DOI] [PMC free article] [PubMed] [Google Scholar]
- Käfer E. Meiotic and mitotic recombination in Aspergillus and its chromosomal aberrations. Adv Genet. 1977;19:33–131. doi: 10.1016/s0065-2660(08)60245-x. [DOI] [PubMed] [Google Scholar]
- Kapteyn JC, ter Riet B, Vink E, Blad S, De Nobel H, Van Den Ende H, et al. Low external pH induces HOG1-dependent changes in the organization of the Saccharomyces cerevisiae cell wall. Mol Microbiol. 2001;39:469–479. doi: 10.1046/j.1365-2958.2001.02242.x. [DOI] [PubMed] [Google Scholar]
- Karimi-Aghcheh R, Bok JW, Phatale PA, Smith KM, Baker SE, Lichius A, et al. Functional analyses of Trichoderma reesei LAE1 reveal conserved and contrasting roles of this regulator. G3 (Bethesda) 2013;3:369–378. doi: 10.1534/g3.112.005140. [DOI] [PMC free article] [PubMed] [Google Scholar]
- Kato N, Brooks W, Calvo AM. The expression of sterigmatocystin and penicillin genes in Aspergillus nidulans is controlled by veA, a gene required for sexual development. Eukaryot Cell. 2003;2:1178–1186. doi: 10.1128/EC.2.6.1178-1186.2003. [DOI] [PMC free article] [PubMed] [Google Scholar]
- Kawasaki L, Aguirre J. Multiple catalase genes are differentially regulated in Aspergillus nidulans. J Bacteriol. 2001;183:1434–1440. doi: 10.1128/JB.183.4.1434-1440.2001. [DOI] [PMC free article] [PubMed] [Google Scholar]
- Keller NP, Hohn TM. Metabolic pathway gene clusters in filamentous fungi. Fungal Genet Biol. 1997;21:17–29. [PubMed] [Google Scholar]
- Keller NP, Segner S, Bhatnagar D, Adams TH. stcS, a putative P-450 monooxygenase, is required for the conversion of versicolorin A to sterigmatocystin in Aspergillus nidulans. Appl Environ Microbiol. 1995;61:3628–3632. doi: 10.1128/aem.61.10.3628-3632.1995. [DOI] [PMC free article] [PubMed] [Google Scholar]
- Kim HS, Han KY, Kim KJ, Han DM, Jahng KY, Chae K. The veA gene activates sexual development in Aspergillus nidulans. Fungal Genet Biol. 2002;37:72–80. doi: 10.1016/s1087-1845(02)00029-4. [DOI] [PubMed] [Google Scholar]
- Kim HK, Lee S, Jo SM, McCormick SP, Butchko RAE, Proctor RH, et al. Functional roles of FgLaeA in controlling secondary metabolism, sexual development, and virulence in Fusarium graminearum. PLoS One. 2013a;8(7):e68441. doi: 10.1371/journal.pone.0068441. [DOI] [PMC free article] [PubMed] [Google Scholar]
- Kopke K, Hoff B, Bloemendal S, Katschorowski A, Kamerewerd J, Kück U. Members of the Penicillium chrysogenum velvet complex play functionally opposing roles in the regulation of penicillin biosynthesis and conidiation. Eukaryot Cell. 2013;12:299–310. doi: 10.1128/EC.00272-12. [DOI] [PMC free article] [PubMed] [Google Scholar]
- Kovács Z, Szarka M, Kovács S, Boczonádi I, Emri T, Abe K, et al. Effect of cell wall integrity stress and RlmA transcription factor on asexual development and autolysis in Aspergillus nidulans. Fungal Genet Biol. 2013;54:1–14. doi: 10.1016/j.fgb.2013.02.004. [DOI] [PubMed] [Google Scholar]
- Laskowski-Peak MC, Calvo AM, Rohrssen J, Smulian AG. VEA1 is required for cleistothecial formation and virulence in Histoplasma capsulatum. Fungal Genet Biol. 2012;49:838–846. doi: 10.1016/j.fgb.2012.07.001. [DOI] [PubMed] [Google Scholar]
- Latgé JP. Tasting the fungal cell wall. Cell Microbiol. 2010;12:863–872. doi: 10.1111/j.1462-5822.2010.01474.x. [DOI] [PubMed] [Google Scholar]
- Lee JI, Yu YM, Rho YM, Park BC, Choi JH, Park HM, et al. Differential expression of the chsE gene encoding a chitin synthase of Aspergillus nidulans in response to developmental status and growth conditions. FEMS Microbiol Lett. 2005;249:121–129. doi: 10.1016/j.femsle.2005.06.006. [DOI] [PubMed] [Google Scholar]
- Li J, Rancour DM, Allende ML, Worth CA, Darling DS, Gilbert JB, et al. The DXD motif is required for GM2 synthase activity but is not critical for nucleotide binding. Glycobiology. 2001;11:217–229. doi: 10.1093/glycob/11.3.217. [DOI] [PubMed] [Google Scholar]
- Li S, Myung K, Guse D, Donkin B, Proctor RH, Grayburn WS, et al. FvVE1 regulates filamentous growth, the ratio of microconidia to macroconidia and cell wall formation in Fusarium verticillioides. Mol Microbiol. 2006;62:1418–1432. doi: 10.1111/j.1365-2958.2006.05447.x. [DOI] [PubMed] [Google Scholar]
- Lind AL, Wisecaver JH, Smith TD, Feng X, Calvo AM, Rokas A. Examining the evolution of the regulatory circuit controlling secondary metabolism and development in the fungal genus Aspergillus. PLoS Genet. 2015;11(3):e1005096. doi: 10.1371/journal.pgen.1005096. [DOI] [PMC free article] [PubMed] [Google Scholar]
- Livak KJ, Schmittgen TD. Analysis of relative gene expression data using real-time quantitative PCR and the 2(-Delta Delta C(T)) Method. Methods. 2001;25:402–408. doi: 10.1006/meth.2001.1262. [DOI] [PubMed] [Google Scholar]
- López-Berges MS, Pinar M, Abenza JF, Arst HN, Jr, Peñalva MA. The Aspergillus nidulans syntaxin PepA(Pep12) is regulated by two Sec1/Munc-18 proteins to mediate fusion events at early endosomes, late endosomes and vacuoles. Mol Microbiol. 2016;99:199–216. doi: 10.1111/mmi.13226. [DOI] [PubMed] [Google Scholar]
- MacCabe AP, Riach MB, Unkles SE, Kinghorn JR. The Aspergillus nidulans npeA locus consists of three contiguous genes required for penicillin biosynthesis. EMBO J. 1990;9:279–287. doi: 10.1002/j.1460-2075.1990.tb08106.x. [DOI] [PMC free article] [PubMed] [Google Scholar]
- Merhej J, Urban M, Dufresne M, Hammond-Kosack KE, Richard-Forget F, Barreau C. The velvet gene, FgVe1, affects fungal development and positively regulates trichothecene biosynthesis and pathogenicity in Fusarium graminearum. Mol Plant Pathol. 2012;13:363–374. doi: 10.1111/j.1364-3703.2011.00755.x. [DOI] [PMC free article] [PubMed] [Google Scholar]
- Miller KY, Wu J, Miller BL. StuA is required for cell pattern formation in Aspergillus. Genes Dev. 1992;6:1770–1782. doi: 10.1101/gad.6.9.1770. [DOI] [PubMed] [Google Scholar]
- Mowat E, Butcher J, Lang S, Williams C, Ramage G. Development of a simple model for studying the effects of antifungal agents on multicellular communities of Aspergillus fumigatus. J Med Microbiol. 2007;56:1205–1212. doi: 10.1099/jmm.0.47247-0. [DOI] [PubMed] [Google Scholar]
- Myung K, Li S, Butchko RA, Busman M, Proctor RH, Abbas HK, et al. FvVE1 regulates biosynthesis of the mycotoxins fumonisins and fusarins in Fusarium verticillioides. J Agric Food Chem. 2009;57:5089–5094. doi: 10.1021/jf900783u. [DOI] [PMC free article] [PubMed] [Google Scholar]
- Myung K, Zitomer NC, Duvall M, Glenn AE, Riley RT, Calvo AM. The conserved global regulator VeA is necessary for symptom production and mycotoxin synthesis in maize seedlings by Fusarium verticillioides. Plant Pathol. 2012;61:152–160. doi: 10.1111/j.1365-3059.2011.02504.x. [DOI] [PMC free article] [PubMed] [Google Scholar]
- Németh Z, et al. Growth-phase sterigmatocystin formation on lactose is mediated via low- specific growth rates in Aspergillus nidulans. Toxins (Basel) 2016 Nov 28;8(12) doi: 10.3390/toxins8120354. pii: E354. [DOI] [PMC free article] [PubMed] [Google Scholar]
- Nobile CJ, Mitchell AP. Regulation of cell-surface genes and biofilm formation by the C. albicans transcription factor Bcr1p. Curr Biol. 2005;15:1150–1155. doi: 10.1016/j.cub.2005.05.047. [DOI] [PubMed] [Google Scholar]
- Notararigo S, Nacher-Vazquez M, Ibarburu I, Werning ML, Fernandez de Palencia P, Dueñas MT, Aznar R, Lopez P, Prieto A. Carbohydr Pol. 2013;93:57–64. doi: 10.1016/j.carbpol.2012.05.016. [DOI] [PubMed] [Google Scholar]
- Orejas M, Espeso EA, Tilburn J, Sarkar S, Arst HN, Jr, Peñalva MA. Activation of the Aspergillus PacC transcription factor in response to alkaline ambient pH requires proteolysis of the carboxy-terminal moiety. Genes Dev. 1995;9:1622–1632. doi: 10.1101/gad.9.13.1622. [DOI] [PubMed] [Google Scholar]
- Palmer JM, Theisen JM, Duran RM, Grayburn WS, Calvo AM, Keller NP. Secondary metabolism and development is mediated by LlmF control of VeA subcellular localization in Aspergillus nidulans. PLoS Genet. 2013;9(1):e1003193. doi: 10.1371/journal.pgen.1003193. [DOI] [PMC free article] [PubMed] [Google Scholar]
- Park HS, Yu JH. Genetic control of asexual sporulation in filamentous fungi. Curr Opin Microbiol. 2012;15:669–677. doi: 10.1016/j.mib.2012.09.006. [DOI] [PubMed] [Google Scholar]
- Park HS, Yu YM, Lee MK, Maeng PJ, Kim SC, Yu JH. Velvet-mediated repression of β-glucan synthesis in Aspergillus nidulans spores. Sci Rep. 2015;5:10199. doi: 10.1038/srep10199. [DOI] [PMC free article] [PubMed] [Google Scholar]
- Patananan AN, Palmer JM, Garvey GS, Keller NP, Clarke SG. A novel automethylation reaction in the Aspergillus nidulans LaeA protein generates S-methylmethionine. J Biol Chem. 2013;288:14032–14045. doi: 10.1074/jbc.M113.465765. [DOI] [PMC free article] [PubMed] [Google Scholar]
- Payne GA, Brown MP. Genetics and physiology of aflatoxin biosynthesis. Annul Rev Phytopathol. 1998;36:329–362. doi: 10.1146/annurev.phyto.36.1.329. [DOI] [PubMed] [Google Scholar]
- Payne GA, Yu J. Ecology, development and gene regulation in Aspergillus flavus. In: Machida M, Gomi K, editors. Aspergillus: Molecular Biology and Genomics. Caister Academic Press; Norfolk, UK: 2010. pp. 157–171. [Google Scholar]
- Peñalva MA. Tracing the endocytic pathway of Aspergillus nidulans with FM4–64. Fungal Genet Biol. 2005;42:963–975. doi: 10.1016/j.fgb.2005.09.004. [DOI] [PubMed] [Google Scholar]
- Pierce CG, Uppuluri P, Tristan AR, Wormley FL, Mowat E, Jr, Ramage G, et al. A simple and reproducible 96-well plate-based method for the formation of fungal biofilms and its application to antifungal susceptibility testing. Nat Protoc. 2008;3:1494–1500. doi: 10.1038/nport.2008.141. [DOI] [PMC free article] [PubMed] [Google Scholar]
- Pontecorvo G, Roper JA, Hemmons LM, Mackdonald KD, Bufton AWJ. The genetics of Aspergillus nidulans. Adv Genet. 1953;5:141–238. doi: 10.1016/s0065-2660(08)60408-3. [DOI] [PubMed] [Google Scholar]
- Purschwitz J, Müller S, Kastner C, Schöser M, Haas H, Espeso EA, et al. Functional and physical interaction of blue- and red-light sensors in Aspergillus nidulans. Curr Biol. 2008;18:255–259. doi: 10.1016/j.cub.2008.01.061. [DOI] [PubMed] [Google Scholar]
- Ram AF, Klis FM. Identification of fungal cell wall mutants using susceptibility assays based on Calcofluor white and Congo red. Nat Protoc. 2006;1:2253–2256. doi: 10.1038/nprot.2006.397. [DOI] [PubMed] [Google Scholar]
- Ramage G, Mowat E, Jones B, Williams C, Lopez-Ribot J. Our current understanding of fungal biofilms. Crit Rev Microbiol. 2009;35:340–355. doi: 10.3109/10408410903241436. [DOI] [PubMed] [Google Scholar]
- Ramamoorthy V, Dhingra S, Kincaid A, Shantappa S, Feng X, Calvo AM. The putative C2H2 transcription factor MtfA is a novel regulator of secondary metabolism and morphogenesis in Aspergillus nidulans. PLoS One. 2013;8(9):e74122. doi: 10.1371/journal.pone.0074122. [DOI] [PMC free article] [PubMed] [Google Scholar]
- Ramamoorthy V, Shantappa S, Dhingra S, Calvo AM. veA-dependent RNA-pol II transcription elongation factor-like protein, RtfA, is associated with secondary metabolism and morphological development in Aspergillus nidulans. Mol Microbiol. 2012;85:795–814. doi: 10.1111/j.1365-2958.2012.08142.x. [DOI] [PMC free article] [PubMed] [Google Scholar]
- Reverberi M, Ricelli A, Zjalic S, Fabbri AA, Fanelli C. Natural functions of mycotoxin and control of their biosynthesis in fungi. Appl Microbiol Biotechnol. 2010;87:899–911. doi: 10.1007/s00253-010-2657-5. [DOI] [PubMed] [Google Scholar]
- Reyes-Dominguez Y, Bok JW, Berger H, Shwab EK, Basheer A, Gallmetzer A, et al. Heterochromatic marks are associated with the repression of secondary metabolism clusters in Aspergillus nidulans. Mol Microbiol. 2010;76:1376–1386. doi: 10.1111/j.1365-2958.2010.07051.x. [DOI] [PMC free article] [PubMed] [Google Scholar]
- Richie DL, Hartl L, Aimanianda V, Winters MS, Fuller KK, Miley MD, et al. A role for the unfolded protein response (UPR) in virulence and antifungal susceptibility in Aspergillus fumigatus. PLoS Pathog. 2009;5(1):e1000258. doi: 10.1371/journal.ppat.1000258. [DOI] [PMC free article] [PubMed] [Google Scholar]
- Röhrig J, Kastner C, Fischer R. Light inhibits spore germination through phytochrome in Aspergillus nidulans. Curr Genet. 2013;59:55–62. doi: 10.1007/s00294-013-0387-9. [DOI] [PubMed] [Google Scholar]
- Roze LV, Hong SY, Linz JE. Aflatoxin biosynthesis: current frontiers. Annu Rev Food Sci Technol. 2013;4:293–311. doi: 10.1146/annurev-food-083012-123702. [DOI] [PubMed] [Google Scholar]
- Sambrook J, Russell DW. Molecular cloning: a laboratory manual. 3. Cold Spring Laoratory; Cold Spring Harbor, New York: 2001. [Google Scholar]
- Sarikaya-Bayram O, Bayram O, Feussner K, Kim JH, Kim HS, Kaever A, et al. Membrane-bound methyltransferase complex VapA-VipC-VapB guides epigenetic control of fungal development. Dev Cell. 2014;29:406–420. doi: 10.1016/j.devcel.2014.03.020. [DOI] [PubMed] [Google Scholar]
- Scherer M, Wei H, Liese R, Fischer R. Aspergillus nidulans catalase-peroxidase gene (cpeA) is transcriptionally induced during sexual development through the transcription factor StuA. Eukaryot Cell. 2002;1:725–735. doi: 10.1128/EC.1.5.725-735.2002. [DOI] [PMC free article] [PubMed] [Google Scholar]
- Schroeckh V, Scherlach K, Nützmann HW, Shelest E, Schmidt-Heck W, Schuemann J, et al. Intimate bacterial-fungal interaction triggers biosynthesis of archetypal polyketides in Aspergillus nidulans. Proc Natl Acad Sci USA. 2009;106:14558–14563. doi: 10.1073/pnas.0901870106. [DOI] [PMC free article] [PubMed] [Google Scholar]
- Shaaban M, Palmer J, EL-Naggar WA, EL-Sokkary MA, Habib EE, Keller NP. Involvement of transposon-like elements in penicillin gene cluster regulation. Fungal Genet Biol. 2010;47:423–432. doi: 10.1016/j.fgb.2010.02.006. [DOI] [PMC free article] [PubMed] [Google Scholar]
- Sheppard DC, Doedt T, Chiang LY, Kim HS, Chen D, Nierman WC, et al. The Aspergillus fumigatus StuA protein governs the up-regulation of a discrete transcriptional program during the acquisition of developmental competence. Mol Biol Cell. 2005;16:5866–5879. doi: 10.1091/mbc.E05-07-0617. [DOI] [PMC free article] [PubMed] [Google Scholar]
- Stinnett SM, Espeso EA, Cobeno L, Araujo-Bazan L, Calvo AM. Aspergillus nidulans VeA subcellular localization is dependent on the importin alpha carrier and on light. Mol Microbiol. 2007;63:242–255. doi: 10.1111/j.1365-2958.2006.05506.x. [DOI] [PubMed] [Google Scholar]
- Sweeny MJ, Dobson AD. Molecular Biology of Mycotoxin Biosynthesis. FEMS Microbiol Lett. 1999;175(2):149–163. doi: 10.1111/j.1574-6968.1999.tb13614.x. [DOI] [PubMed] [Google Scholar]
- Szewczyk E, Nayak T, Oakley CE, Edgerton H, Xiong Y, Taheri-Talesh N, et al. Fusion PCR and gene targeting in Aspergillus nidulans. Nat Protoc. 2006;1:3111–3120. doi: 10.1038/nprot.2006.405. [DOI] [PubMed] [Google Scholar]
- Tamura K, Stecher G, Peterson D, Filipski A, Kumar S. MEGA6: Molecular Evolutionary Genetics Analysis Version 6.0. Mol Biol Evol. 2013;30:2725–2729. doi: 10.1093/molbev/mst197. [DOI] [PMC free article] [PubMed] [Google Scholar]
- Tilburn J, Scazzocchio C, Taylor GG, Zabicky-Zissman JH, Lockington RA, Davies RW. Transformation by integration in Aspergillus nidulans. Gene. 1983;26:205–221. doi: 10.1016/0378-1119(83)90191-9. [DOI] [PubMed] [Google Scholar]
- Tribus M, Galehr J, Trojer P, Brosch G, Loidl P, Marx F, et al. HdaA, a major class 2 histone deacetylase of Aspergillus nidulans, affects growth under conditions of oxidative stress. Eukaryot Cell. 2005;4:1736–1745. doi: 10.1128/EC.4.10.1736-1745.2005. [DOI] [PMC free article] [PubMed] [Google Scholar]
- Twumasi-Boateng K, Yu Y, Chen D, Gravelat FN, Nierman WC, Sheppard DC. Transcriptional profiling identifies a role for BrlA in the response to nitrogen depletion and for StuA in the regulation of secondary metabolite clusters in Aspergillus fumigatus. Eukaryot Cell. 2009;8:104–115. doi: 10.1128/EC.00265-08. [DOI] [PMC free article] [PubMed] [Google Scholar]
- Vallim MA, Miller KY, Miller BL. Aspergillus SteA (sterile12-like) is a homeodomain-C2/H2-Zn+2 finger transcription factor required for sexual reproduction. Mol Microbiol. 2000;36:290–301. doi: 10.1046/j.1365-2958.2000.01874.x. [DOI] [PubMed] [Google Scholar]
- Veiga T, Nijland JG, Driessen AJ, Bovenberg RA, Touw H, van den Berg MA, et al. Impact of velvet complex on transcriptome and penicillin G production in glucose-limited chemostat cultures of a β-lactam high-producing Penicillium chrysogenum strain. Omics. 2012;16:320–33. doi: 10.1089/omi.2011.0153. [DOI] [PMC free article] [PubMed] [Google Scholar]
- Watanabe K, Yamaguchi Y. Molecular identification of a putative human hyaluronan synthase. J Biol Chem. 1996;271:22945–22948. doi: 10.1074/jbc.271.38.22945. [DOI] [PubMed] [Google Scholar]
- Waterhouse AM, Procter JB, Martin DMA, Clamp M, Barton GJ. Jalview Version 2 - a multiple sequence alignment editor and analysis workbench. Bioinformatics. 2009;25:1189–1191. doi: 10.1093/bioinformatics/btp033. [DOI] [PMC free article] [PubMed] [Google Scholar]
- Weber K, Bolander ME, Sarkar G. PIG-B: a homemade monophasic cocktail for the extraction of RNA. Mol Biotechnol. 1998;9:73–77. doi: 10.1007/BF02752699. [DOI] [PubMed] [Google Scholar]
- Weigel PH. Hyaluronan synthase: the mechanism of initiation at the reducing end and a pendulum model for polysaccharide translocation to the cell exterior. Int J Cell Biol. 2015;2015:367579. doi: 10.1155/2015/367579. [DOI] [PMC free article] [PubMed] [Google Scholar]
- Wicklow DT. Survival of Aspergillus flavus sclerotia in soil. Trans Br Mycol Soc. 1987;89:131–134. [Google Scholar]
- Wiemann P, Brown DW, Kleigrewe K, Bok JW, Keller NP, Humpf HU, et al. FfVel1 and FfLae1, components of a velvet-like complex in Fusarium fujikuroi, affect differentiation, secondary metabolism and virulence. Mol Microbiol. 2010;77:972–994. doi: 10.1111/j.1365-2958.2010.07263.x. [DOI] [PMC free article] [PubMed] [Google Scholar]
- Wu J, Miller BL. Aspergillus asexual reproduction and sexual reproduction are differentially affected by transcriptional and translational mechanisms regulating stunted gene expression. Mol Cell Biol. 1997;17:6191–6201. doi: 10.1128/mcb.17.10.6191. [DOI] [PMC free article] [PubMed] [Google Scholar]
- Yager LN. Early developmental events during asexual and sexual sporulation in Aspergillus nidulans. Biotechnology. 1992;23:19–41. [PubMed] [Google Scholar]
- Yin QY, de Groot PW, de Koster CG, Klis FM. Mass spectrometry-based proteomics of fungal wall glycoproteins. Trends Microbiol. 2008;16:20–26. doi: 10.1016/j.tim.2007.10.011. [DOI] [PubMed] [Google Scholar]
- Yu JH, Butchko RAE, Fernandes M, Keller NP, Leonard TJ, Adams TH. Conservation of structure and function of the aflatoxin regulatory gene aflR from Aspergillus nidulans and A. flavus. Curr Genet. 1996;29:549–555. doi: 10.1007/BF02426959. [DOI] [PubMed] [Google Scholar]
- Yu JH, Keller NP. Regulation of secondary metabolism in filamentous fungi. Annu Rev Phytopathol. 2005;43:437–458. doi: 10.1146/annurev.phyto.43.040204.140214. [DOI] [PubMed] [Google Scholar]
Associated Data
This section collects any data citations, data availability statements, or supplementary materials included in this article.
Supplementary Materials
Figure S1. RM1 presents a single mutation in cpsA gene. (A) Complementation insert from the genomic library plasmid in the RM1 mutant and corresponding genomic fragment in the RM1 mutant. (B) Alignment of the deduced amino acid sequences of A. nidulans cpsA and putative homologs in other Aspergillus species. The species compared are: Aspergillus terreus (NIH2624), Aspergillus clavatus (NRRL 1), Aspergillus fumigatus (Af293), Aspergillus niger (CBS 513.88, asterisk after residue A304 indicates the exclusive presence of 76 non-conserved amino acids, coordinates 305–380, in A.niger CpsA putative homolog), Aspergillus oryzae (RIB40), and Aspergillus flavus (NRRL 3357). Accession numbers of protein sequence are located in Table S1. The alignment was performed with MAFFT (http://www.ebi.ac.uk/Tools/msa/mafft/) multiple sequence alignment software program. The red arrow shows the point mutation at nucleotide +568 of the cpsA coding region, from GAT to AAT, resulting in a change from glutamic acid (D) to Asparagine (N). Conserved residues are highlighted in blue with Jalview 2.9.0b2 (http://www.jaview.org/)) software program. The conserved domain, GT2_HA, is indicated with an orange bar (amino acid residues, 45–290), predicted Signal peptide and TM domains are indicated with cian and brown boxes, respectively.
Table S1. Sequence analysis of CpsA homologs in different fungi using NCBI BLAST and NEEDLE Pairwise sequence alignment.
Table S2. Fungal strains used in this study.
Table S3. Glycosyl composition analysis of cell wall fractions by GC-MS
Table S4. Monosaccharides (%) released from the exopolysaccharide (EPS) after acid hydrolysis with 3 M TFA for 1 h at 120 ºC, detected as alditol acetates.
Table S5. Monosaccharides (%) identified in membranes of A. nidulans wild type using GC/MS after acid hydrolysis with 3 M TFA for 1 h at 120 ºC.
Table S6. Primers used in this study.
Infrared spectra were obtained from wild type and cpsA mutant by the KBr method described in Materials and Methods. IR spectra from both samples were identical.
The type and abundance (%) of the linkages were deduced by methylation analysis of the EPS from A. nidulans wild type (wt) and cpsA mutant (mut). After derivatization to their corresponding partially methylated alditol acetates, samples were analyzed by GC-MS as described in Materials and Methods.
Multiple sequence alignment of CpsA putative homologs. Alignment was generated using MAFFT. The alignment was visualized by Jalview with conserved residues in dark blue. Species represented in alignment are: Aspergillus nidulans (Anid), Histoplasma capsulatum (Hcap), Trichoderma reesei (Tree), Botrytis cinerea (Bcin), Fusarium oxysporum (Foxy), Neurospora crassa (Ncra), Coccidioides immitis (Cimm), Stachybotrys chartarum (Scha), Acremonium chrysogeum (Achr), Cryptococcus neoformans (Cneo), Coprinopsis cinera (Ccin), and Sphaerobolus stellastus (Sste). Accession numbers of each protein sequence are located in Table S1.
Phylogenetic tree of CpsA putative homologs from different fungal species. Phylogenetic trees constructed using MEGA v6.0. Trees were constructed with Maximum-Likelihood model with a bootstrap value of 1000. Green branches indicate Aspergillus spp., blue branches indicate other Ascomycota outside of Aspergillus, and red represents species from Basidomycota.
The species compared are: Streptomyces pneumoniae, Streptacidiphilus albus, Actinomadura macra, Piscicoccus intestinalis, Frankia elaeagni, and Pseudonocardia acacia. The alignment was performed with MAFFT (http://www.ebi.ac.uk/Tools/msa/mafft/) multiple sequence alignment software program. Conserved residues are highlighted in black with BOXshade (http://www.ch.embnet.org/) software program. The conserved domain, GT2_HA, is underlined (amino acid residues, 45–290). DDD and XDD motifs are indicated with red boxes.
(A) Schematic diagram showing the replacement of cpsA with the A. fumigatus pyrG gene (pyrGA. fum) by a double-crossover event. XhoI restriction sites and probe template used in the Southern blot analysis to confirm the proper integration of the cassette are shown. (B) Southern blot analysis results of TDAEΔcpsA and TRVΔcpsA transformants. The expected band sizes were 5.6 kb for wild type (WT) and 3.1 kb for ΔcpsA. (C) Linear diagram of cpsA complementation plasmid pSM3-cpsA-com. The complementation strain was confirmed by diagnostic PCR, using primers RM1-F5 (F) and cps-OE2 (R) the expected 0.9 kb PCR product is shown. (C) Linear diagram of cpsA overexpression plasmid pTDS-cpsOE. The overexpression transformants were confirmed by PCR with primers gpdApromoF (F) and cps-OE2 primers (R) yielded the predicted 1.8 kb product. (D) Expression analysis of cpsA by Northern blot. Wild type veA+ control (WT), ΔcpsA, complementation (com) and overexpression (OE) strains were inoculated in liquid GMM and incubated at 37 °C for 72 h. Densitometry of the Northen blot results is shown. Asterisk indicates not detected.
Wild-type veA+ control (WT), ΔcpsA, complementation (com) and overexpression (OE) strains were top-agar inoculated and incubated at 37 °C in the dark for 2, 3 and 6 days. ST production was analyzed as described in the Materials and Methods section. White arrows indicate additional unknown compounds whose synthesis is cpsA-dependent.
Fusion CpsA-GFP was overexpressed using the gpdA promoter. A micrograph of strain TSSP19.1 (Table S1) Localization of OE-CpsA-GFP is nearly identical to that observed using the cpsA endogenous propmoter. A kymograph shows the presence of static (grey triangles) and motile fluorescence accumulations, probably early endosomes. These organelles move in anterograde (c) or retrograde (b) direction and some reached the tip of the cell but rapidly migrate in opposite direction (a). Accumulation of CpsA-GFP at the plasma membrane was not detected.
Wild type veA+ control (WT), ΔcpsA, complementation (com) and overexpression (OE) strains were point inoculated on GMM or GMM containing 0.7 M NaCl or 1.2 M of sorbitol, and incubated at 30 °C, 37°C or 45 °C in dark for 3 days.
(A) Diagrams and verification of rlmA deletion in TSSP15.1 (ΔrlmA) and in TSSP16.1 (ΔveA ΔrlmA), and (B) veA deletion in TXF2.1p (ΔveA) and also in TSSP16.1 (ΔveA ΔrlmA). The strains were confirmed by diagnostic PCR, obtaining the expected 2.7 kb (using primers ANrmlA_P1 (F) and pyrG_Afum_R (R)) and 2.8 kb products (using primers veAF5′UTR (F) and pyroA (R)), respectively. (C) TLC analysis of ST from wild type (WT), ΔveA, ΔrlmA and ΔveAΔrlmA double mutant from top-agar inoculated GMM cultures incubated for 72 h at 37 °C. ST standard (ST) was included on both sides of the TLC plate. (D) Densitometry of ST performed using GelQuantNET software. ST band intensity was normalized with respect to that of the wild type considered as 1.
Time-lapse series of 90 frames using stream acquisition protocol in Metamorph software. 200 ms exposure per frame. Movie is set up to 7 frames per second, and correspond to the dashed line square indicated in Figure 7.
Time-lapse series of 90 frames using stream acquisition protocol in Metamorph software. 200 ms exposure per frame. Movie is set up to 7 frames per second.
Movie 2 was subjected to “Walking average” subroutine of ImageJ (4 images for media calculation) and then to “stack difference” (image interval set to 1).