Abstract
Aberrations in epigenetic modifications contribute to leukemogenesis in childhood acute myeloid leukemia (AML). We combined DNA hypomethylating agent azacitidine with histone deacetylase inhibitor panobinostat in preclinical models of childhood AML. Synergistic cytotoxic effect upon treatment with azacitidine and panobinostat with combination indices < 1.0 was observed. Azacitidine and panobinostat increased median survival by 26 and 6 days respectively in MV4;11 xenografted mice. Mice treated with both drugs showed a drastic reduction in leukemic burden leading to complete remission sustained for the duration of the experimental period lasting more than 519 days. Reduced leukemic burden and prolonged survival was also observed in AML-193 xenografted mice treated with azacitidine-panobinostat combination. Differential gene expression profiling was performed on AML cells treated with azacitidine, panobinostat or azacitidine-panobinostat combination. Functional mapping of transcripts uniquely regulated by the azacitidine-panobinostat combination in MV4;11 cells identified p53 as an upstream regulator. A comparison of the uniquely modulated transcripts by azacitidine-panobinostat combination in MV4;11 cells versus AML-193 and THP-1 cells, bearing mutated p53, also revealed p53 as the topmost upstream regulator. Finally, expression of mutant p53 in MV4;11 cells reduced sensitivity to azacitidine-panobinostat combination, suggesting that p53 may be a predictor of response to epigenetic therapy in pediatric AML.
Keywords: acute myeloid leukemia, azacitidine, panobinostat, epigenetics, xenograft, pediatric
INTRODUCTION
Acute myeloid leukemia (AML) is a heterogeneous disease characterized by the presence of diverse molecular abnormalities resulting in differentiation arrest and uncontrolled proliferation in immature myeloid precursors. In addition to cytogenetic and genomic aberrations, dysregulation of the epigenome in the form of DNA promoter hypermethylation and aberrant histone H3 hypoacetylation is also observed in AML patients [1, 2]. Recent genomic analyses identified mutations in genes encoding epigenetic modifiers- IDH1/2, DNMT3A, TET2 (involved in the regulation of DNA methylation) and ASXL1, EZH2, KDM6A (involved in the modulation of chromatin modifications) [3, 4]. Distinct epigenetic profiles can differentiate the hematopoietic stem cells from the leukemia stem cells and can be used to classify AML patients into individual prognostic groups related to cytogenetics [5]. The epigenome is amenable to change, and strategies to target epigenetic modifications in AML have been utilized. Epigenetic drugs such as DNA hypomethylating agents and histone deacetylase (HDAC) inhibitors maintain normal hematopoietic stem cell self-renewal, while inducing terminal differentiation and selective anti-leukemic effect [6]. These agents are currently in clinical trials for adult AML either as single agents or in combination.
Differences between adult and pediatric AML epigenomes are vast likely due to the age-induced epigenetic drift observed in many neoplasms [2]. For example, mutations in IDH1/2, DNMT3a, TET2 genes found in adult AML patients are rare in pediatric AML [7, 8]. Children do have high incidence of mutations/translocations in the MLL gene, a histone methyltransferase, suggesting a distinct role for dysregulated epigenetic modifications in leukemogenesis in children [9, 10]. Therefore, there is a need to determine if pediatric AML patients would respond in a similar way to adults. Our data showing sustained remission and reduced leukemic burden following combination therapy of azacitidine and panobinostat represents the first preclinical evidence of efficacy of this combination in pediatric AML. Differential gene expression analysis and functional mapping of genes uniquely modulated by the combination, identified p53 as an upstream regulator. Expression of R248W mutant p53 in MV4;11 cells reduced the sensitivity of these cells to azacitidine-panobinostat combination. Moreover, the combination induced complete remission in MV4;11 xenografts with wild-type p53 suggesting that presence of p53 may predict efficacy of this combination.
MATERIALS AND METHODS
Cell culture and transfection
AML-193 (CRL-9589), MV4;11 (CRL-9591) and THP-1 (TIB-202) cells were obtained from American Type Culture Collection (ATCC), (Manassas, VA). THP-1 cells were cultured in RPMI culture medium supplemented with 10% fetal bovine serum (FBS), 2 mM/L L-glutamine, 25 U/mL penicillin, and 25 μg/mL streptomycin. MV4;11 cells were cultured in IMDM culture medium with supplements listed above. AML-193 cells were cultured in IMDM with 5% FBS, 0.5 ng/ml insulin, 5 ng/ml transferrin receptor and 5 ng/ml GM-CSF.
For generation of MV4;11 cells expressing mutant p53, pCMV-Neo-Bam p53 R248W (Addgene plasmid # 16437), a gift from Bert Vogelstein [11] was used. MV4;11 cells (2.5 × 10⁶) were transfected by nucleofection using Amaxa Nucleofector (Lonza, Basel, Switzerland), Kit V, program A-030. Transfected clones were isolated by single cell dilution cloning and antibiotic selection (500 μg/ml G418), followed by screening by immunoblotting.
Cell viability assay and IC50 determination
Viability of AML cell lines was determined using the Cell Titer Blue cell viability assay, Promega (Madison, WI) following manufacturer’s protocol. Briefly, 50,000 cells plated in 96-well plates were incubated with DMSO (vehicle), azacitidine (S1782, Selleck Chemicals, Houston, TX), panobinostat (P-3703, LC Laboratories, Boston, MA) or a combination of the two at the indicated concentrations for 72h. Cell Titer Blue reagent was added to the cells following treatment and the fluorescence corresponding to the percentage of live cells was captured four hours later by using a VICTOR Multilabel Plate Reader, PerkinElmer (Waltham, MA). The viability of vehicle-treated cells was considered to be 100% for calculation of percent cell viability of treated cells. IC50 for each cell line and drug was calculated using Prism 6, GraphPad Software (San Diego, CA) from 3–5 trials of cell viability determinations performed in triplicates.
Immunoblotting
Cells were lysed in a buffer containing 20 mM Tris-HCl (pH 7.4), 100 mM NaCl, 1% v/v Triton X-100, 1 mM EDTA, 1 mM EGTA, 1 mM sodium glycerol phosphate, 1 mM sodium orthovanadate, 1 mM PMSF, and 5 μg/ml each of antipain, pepstatin and leupeptin. The lysates were sonicated and clarified by centrifugation at 16,000 g for 10 min at 4°C. Total protein in cell lysates was estimated by Bio-Rad DC Reagent, Bio-Rad (Hercules, CA) following manufacturer’s instructions. One hundred μg of total protein was resolved by SDS-PAGE, transferred to nitrocellulose membrane, and immunoblotted using anti-p53 antibody (7F5), followed by HRP-conjugated anti-rabbit secondary antibody diluted in Tris-buffered saline containing 5% w/v non-fat dried milk and 0.1% v/v Tween-20. Enhanced chemiluminescent lighting system, PerkinElmer Life Sciences (Boston, MA) was used for detection. Antibodies were purchased from Cell Signaling Technology (Lexington, KY).
Xenograft studies
NSG-B2m mice (Stock#010636) purchased from Jackson Laboratories (Bar Harbor, ME) were transplanted with leukemia cells (3.5×10⁶) via tail-vein injections as described previously [12]. Mice were maintained in the Nemours Life Science Center following the guidelines established by the Nemours Institutional Animal Care and Use Committee (IACUC). Disease progression was monitored by flow cytometry (see below) of mouse peripheral blood drawn periodically by submandibular bleeds. When the average percentage of engraftment was 0.4%, the mice were randomized into four treatment groups– vehicle (5% dextrose), azacitidine (2.5 mg/Kg), panobinostat (2.5 mg/Kg), and azacitidine + panobinostat (2.5 mg/Kg each). The mice were dosed with four cycles lasting five days a week with two days rest. An additional rest period of one-week was included between cycles 2 and 3. Mice were euthanized by carbon-di-oxide asphyxiation using a method consistent with the euthanasia guidelines of the American Veterinary Medical Association, when they exhibited disease symptoms: increased leukemic burden, persistent weight loss or hind-limb paralysis. All studies involving mice were approved by the Nemours IACUC.
Flow cytometry
Mouse blood was stained with FITC-conjugated anti-human CD45 and APC-conjugated anti-mouse CD45 antibodies from Affymetrix eBioscience (San Diego, CA). The red blood cells (RBC) were lysed by using a multi-species RBC lysis buffer (Affymetrix eBioscience) containing ammonium chloride. The number of cells stained specifically for either antibody (CD45+ cells) within a cell population gated for blasts (based on their forward and side scatter parameters) was determined by flow cytometry using a BD Accuri C6 flow cytometer, BD Biosciences (San Jose, CA. The percentage of human cells in mouse peripheral blood was calculated using this formula – (No. of human CD45+ cells)/(No. of human CD45+ cells + No. of mouse CD45+ cells) × 100).
Gene expression analysis
The concentrations of azacitidine and panobinostat that allow at least 75% cell viability at 48 h post treatment even in the combination were pre-determined for each cell line. MV4;11 cells were treated with vehicle (0.1% DMSO), 0.5 μM azacitidine, 1.5 nM panobinostat or 0.5 μM azacitidine plus 1.5 nM panobinostat for 48 h. AML-193 cells were treated with vehicle (0.1% DMSO), 5 μM azacitidine, 5 nM panobinostat or 5 μM azacitidine plus 5 nM panobinostat for 48 h. THP-1 cells were treated with vehicle (0.1% DMSO), 3 μM azacitidine, 5 nM panobinostat or 3 μM azacitidine plus 5 nM panobinostat for 48 h. Five replicates of each were used. Total RNA was isolated using Trizol Reagent, Invitrogen, ThermoFisher Scientific (Waltham, MA) following manufacturer’s protocol. RNA quality was verified with a 2100 Bioanalyzer, Agilent Technologies (Santa Clara, CA). Targets were prepared from 100 ng RNA using GeneChip® WT Plus Reagent Kit, Affymetrix (Santa Clara, CA). Labeled RNA samples were hybridized to GeneChip Human Gene 2.0 ST Array after the addition of the GeneChip Expression 3′Amplification Reagents Hybridization Controls. Labeled sense targets were hybridized overnight in the GeneChip Hybridization Oven 645 at 60 rpm and 45°C for 16–20 h. The arrays were washed and stained with the GeneChip Hybridization Wash and Stain Kit (Affymetrix) utilizing the GeneChip Fluidic Station 450 (Affymetrix). The stained arrays were scanned with the GeneChip scanner 3000 7G (Affymetrix). The array images were processed and quality assessed using Affymetrix GeneChip Command Console Software (AGCC) and Affymetrix Expression Console Software. The microarray data was deposited in the Gene Expression Omnibus of the National Center for Biotechnology Information (NCBI) and assigned accession number GSE83983. Here is a link for reviewer access http://www.ncbi.nlm.nih.gov/geo/query/acc.cgi?token=ehcregqipnabted&acc=GSE83983
Log2 expression values for transcript clusters were calculated with the RMA (Robust Multichip Average) algorithm using the oligo Bioconductor package [13]. Transcript clusters with a statistically significant (1% FDR) change in expression after treatment were identified using limma (a linear model approach) with Benjamini and Hochberg’s method to control the false-discovery rate [14–16]. Hierarchical clustering was performed using Euclidean distance and average linkage with MeV (MultiExperimentViewer) [17]. Transcript clusters uniquely modulated by the combination treatment were imported into the Ingenuity Pathway Analysis (IPA) software (Qiagen, Valencia, CA) for canonical pathway analysis and identification of upstream regulators.
Statistical analysis
Prism 6 GraphPad software was used for plotting the percentage of human leukemic cells in mouse peripheral blood over time and fitting to a non-linear regression curve. The time at which this percentage reached 0.5% (disease detection) was interpolated from this curve. The length of remission was calculated as the number of days from treatment initiation to disease detection. Kaplan-Meir survival curves were compared by Log-rank (Mantel-Cox) test. Median survival was calculated as the number of days since treatment start when the percentage of surviving mice was 50%. A p-value <0.05 was considered statistically significant.
Average cell viability following drug treatment from three independent experiments calculated as a percentage of control was plotted in Microsoft Excel. p-value was calculated using the students paired t-test.
RESULTS
Epigenetic modifiers synergistically induce cytotoxicity in AML cell lines
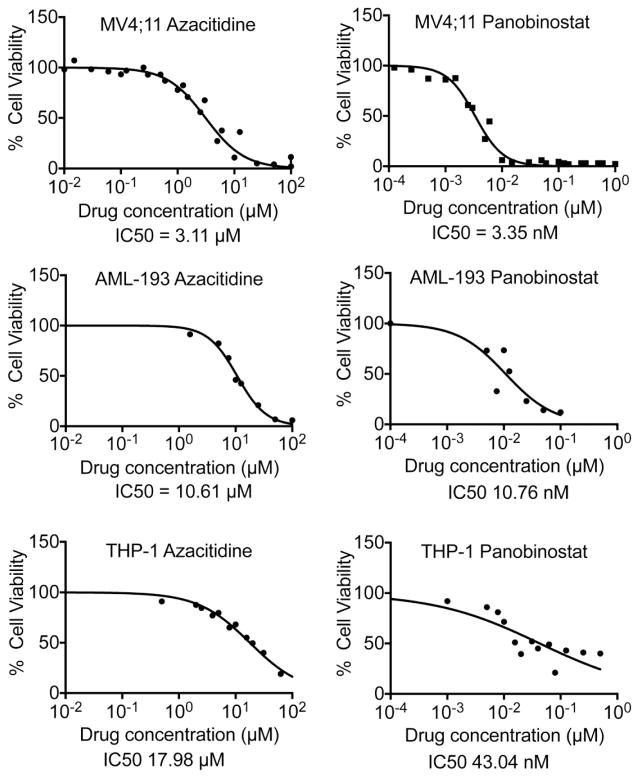
The viability of three pediatric AML cell lines following exposure to azacitidine and panobinostat was determined. Panobinostat was more efficient in inducing cytotoxicity than azacitidine for all cell lines tested with IC50s ranging from 3.35 to 43.04 nM, while azacitidine IC50s ranged from 3.11 to 17.98 μM (Fig. 1 and Table I). The combination index was calculated as the sum of the ratios of the dose required for each drug to reduce cell viability by 50% when used in combination to the dose required when used alone. A combination index value equal to 1.0 indicates additive effects, while a value less than 1.0 signifies synergism. For all cell lines tested, the combination index was < 1.0, indicating that the two drugs synergistically induced cytotoxicity in AML cells.
Fig. 1.
Dose response curves for azacitidine and panobinostat from 3–5 independent experiments performed in triplicates were generated using GraphPad Prism software. The calculated IC50s are shown.
Table 1.
Azacitidine and panobinostat synergistically induce cytotoxicity in pediatric AML cells. Chart showing IC50s and combination indices of these two drugs
| Cell line | Fusion protein | p53 status | Azacitidine IC50 (μM) | Panobinostat IC50 (nM) | Combination index |
|---|---|---|---|---|---|
| MV4;11 | MLL-AF4 | Wild-type | 3.11 | 3.35 | 0.633 |
| THP-1 | MLL-AF9 | Mutated | 17.98 | 43.04 | 0.890 |
| AML-193 | None | Mutated | 10.61 | 10.76 | 0.937 |
Azacitidine and panobinostat combination induces complete remission in mice bearing MV4;11 xenografts
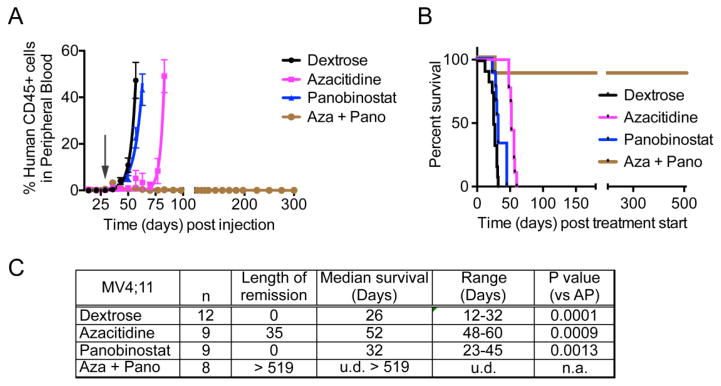
The effect of the azacitidine-panobinostat combination on leukemic burden and survival was tested in MV4;11 transplanted mice. The maximum-tolerated dose (2.5 mg/Kg) was calculated by dose escalation in mice. Similar to reports from clinical trials, drug-induced toxicity in mice caused fatigue and diarrhea in mice resulting mainly from panobinostat treatment [18]. However, the mice recovered when treatment ended. Disease progression and engraftment of human cells in NSG-B2m mice transplanted with MV4;11 cells was monitored by periodic determination of the percentage of human leukemic cells versus mouse cells in peripheral blood by flow cytometry. The mice were randomly recruited to four treatment groups when the average percentage of engraftment was 0.4% – vehicle, azacitidine, panobinostat, and azacitidine + panobinostat. The length of remission was calculated as the number of days from treatment initiation until the engraftment percentage reached 0.5%. Panobinostat treatment alone was not successful in maintaining low disease burden, where as azacitidine sustained remission for 52 days from the time treatment started (Fig. 2A, C). Panobinostat alone increased the median survival by 6 days compared to vehicle treated mice, while azacitidine treatment improved survival by 26 days (Fig. 2B, C). Treatment with azacitidine-panobinostat combination induced complete remission and the mice were disease-free until sacrifice > 519 days post treatment start.
Fig. 2.
(A) The graph shows percentage of human CD45+ leukemic cells in mouse blood. At time 0, mice were injected with MV4;11 cells. The arrow indicates when drug treatment began. (B) Kaplan-Meier plot shows the percentage of mice surviving following treatment. The p-value for median survival between different treatment groups (by ANOVA) is <0.0001. The mice treated with the combination of azacitidine and panobinostat were disease-free until they were sacrificed 18 months post cell injection. (C) Table showing the length of remission and median survival in days for the mice treated with indicated drugs. n = number of mice per group. u.d. = undefined, n.a. = not applicable.
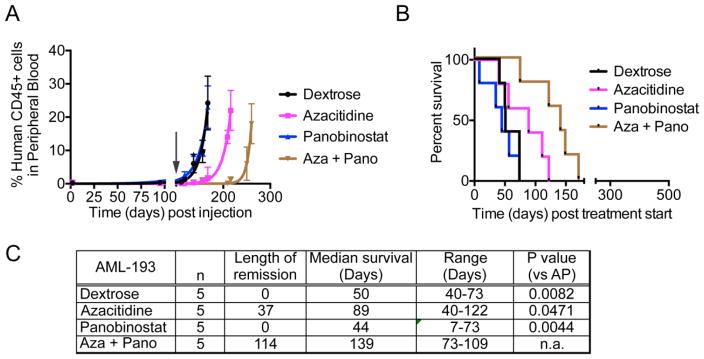
Similar to MV4;11 xenografts, panobinostat failed to control leukemic burden in AML-193 xenografts, while azacitidine treatment maintained remission for 37 days post treatment start (Fig. 3A, C). The azacitidine-panobinostat combination sustained remission much longer, until 114 days post start of treatment. Panobinostat did not show an increase in median survival, while azacitidine had a 39-day survival advantage compared to vehicle-treated mice (Fig. 3B,C). Unlike MV4;11 xenografts, mice transplanted with AML-193 cells and treated with azacitidine-panobinostat combination did not attain complete remission and the percentage of human CD45+ cells in mouse blood increased over time. These mice survived 79 days longer than the vehicle-treated mice, demonstrating that the combination was more beneficial than either drug alone (Fig. 3C). Thus, taken together, consistent with the in vitro data, azacitidine and panobinostat synergize to reduce leukemic burden and prolong survival in two different AML xenografts in mice.
Fig. 3.
(A) The graph shows percentage of human CD45+ leukemic cells in mouse blood. At time 0, mice were injected with AML-193 cells. The arrow indicates the time when drug treatment was initiated. (B) Kaplan-Meier plot shows the percentage of mice surviving following treatment. The p-value for median survival between different treatment groups (p = 0.0038). (C) Table showing the length of remission and median survival in days for the mice treated with indicated drugs. n = number of mice per group. n.a. = not applicable.
Modulation of gene expression profile by azacitidine and panobinostat in AML cells
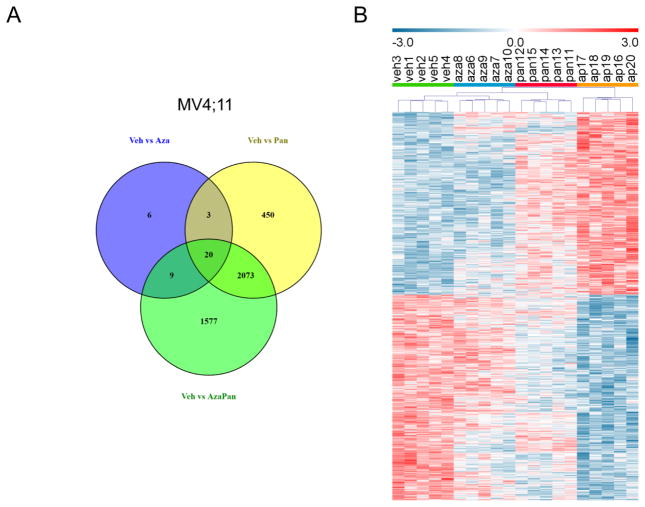
In order to understand the mechanism of synergism between azacitidine and panobinostat, differential gene expression analysis was performed in MV4;11 cells treated with vehicle, azacitidine, panobinostat or azacitidine-panobinostat combination. 38, 2546 and 3679 transcript clusters were differentially expressed (1% FDR) when comparing (1) vehicle and azacitidine treatments, (2) vehicle and panobinostat treatments and (3) vehicle and azacitidine-panobinostat treatments, respectively. A Venn diagram of these differentially expressed transcript clusters showed 1577 transcript clusters were unique to the vehicle vs azacitidine-panobinostat comparison (Fig. 4A). These transcript clusters didn’t reach significance when comparing vehicle and azacitidine treatments or vehicle and panobinostat treatments. Hierarchical clustering with these 1577 transcript clusters resulted in grouping of samples according to treatment (Fig. 4B). This also illustrated that the expression levels of some of the transcript clusters were higher in vehicle treated cells (vehl-5) and some were higher in azacitidine-panobinostat treated cells (ap16–29). The pattern of expression in azacitidine treated cells (aza6–10) and panobinostat treated cells (pan11–15) was consistent within treatment groups, but not as distinct from vehicle treated cells.
Fig. 4.
(A) Venn diagram of differentially expressed transcript clusters (1% FDR) showing shared and unique transcript clusters in MV4;11 cells. 38, 2546 and 3679 transcript clusters were differentially expressed when comparing (1) vehicle and azacytidine treatments, (2) vehicle and panobinostat treatments and (3) vehicle and azacytidine-panobinostat treatments, respectively. 1577 transcript clusters were unique to the vehicle vs azacitidine-panobinostat comparison. (B) Hierarchical clustering of MV4;11 cells treated with vehicle (n=5, green bar, veh1-5), azacitidine (n=5, blue bar, aza6–10), panobinostat (n=5, red bar, pan11–15) or azacytidine-panobinostat combination (n=5, orange bar, ap16–20). Relative expression of transcript clusters uniquely regulated by the drug combination (1577) is shown.
The 1577 transcript clusters (consisting of 1301 annotated transcript clusters) uniquely modulated by the combination were imported into IPA. Analysis of the genes represented by these transcript clusters identified p53 as the most significant upstream regulator (p-value = 2.88×10⁻¹⁶), although the TP53 gene transcript itself was not modulated. The activation z-score assessing the match of observed and predicted up/down regulation patterns of target molecules in the dataset was 2.758. 158 transcript clusters (out of 1301) uniquely modulated by the combination were transcriptionally regulated by p53 and contributed to activation of the p53 pathway.
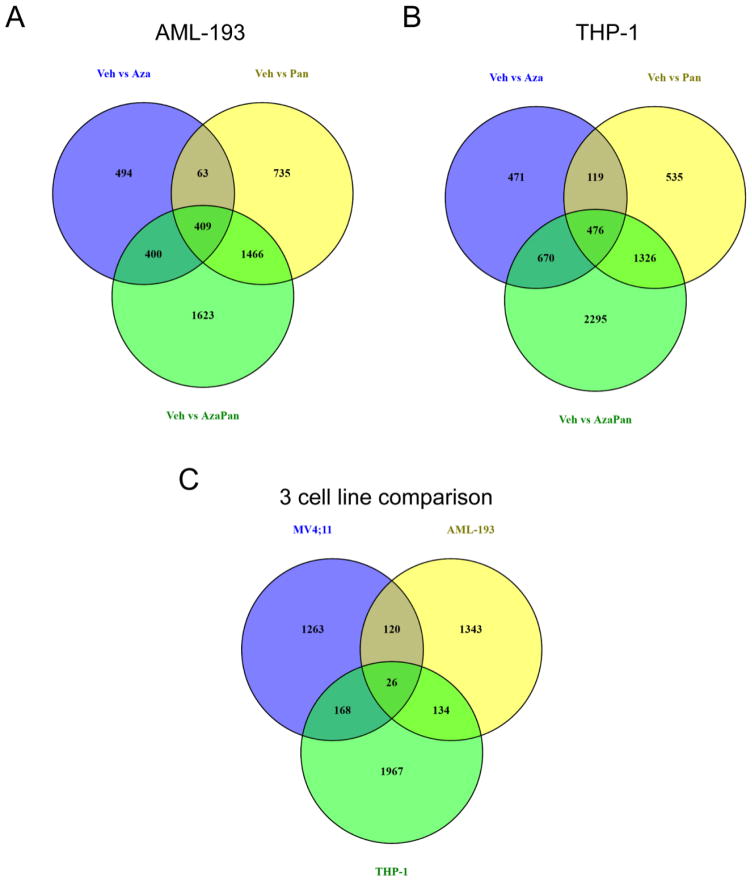
In an effort to correlate the in vitro drug sensitivities and in vivo response with gene expression profiles, differential gene expression analysis was performed in AML-193 and THP-1 cells in addition to MV4;11 cells.. Venn diagrams of differentially expressed transcript clusters identified 1623 and 2295 transcript clusters that were uniquely regulated by the combination in AML-193 and THP-1 cells, respectively (Fig. 5A,B). IPA analysis of the transcript clusters with a 1% FDR did not recognize p53 to be an activated upstream regulator in AML-193 or THP-1 cells.
Fig. 5.
(A) Venn diagram of differentially expressed transcript clusters (1% FDR) showing shared and unique transcript clusters in AML-193 cells. 1366, 2673 and 3898 transcript clusters were differentially expressed when comparing (1) vehicle and azacitidine treatments, (2) vehicle and panobinostat treatments and (3) vehicle and azacitidine-panobinostat treatments, respectively. 1623 transcript clusters were unique to the vehicle vs azacitidine-panobinostat comparison. (B) Venn diagram of differentially expressed transcript clusters (1% FDR) showing shared and unique transcript clusters in THP-1 cells. 1736, 2456 and 4767 transcript clusters were differentially expressed when comparing (1) vehicle and azacitidine treatments, (2) vehicle and panobinostat treatments and (3) vehicle and azacitidine-panobinostat treatments, respectively. 2295 transcript clusters were unique to the vehicle vs azacitidine-panobinostat comparison. (C) Venn diagram of transcript clusters that were differentially expressed when comparing vehicle and azacitidine-panobinostat treatments and unique to this comparison in MV4;11, THP-1 and AML-193 cells. 1577, 1623 and 2295 transcript clusters met these criteria in MV4;11, AML-193 and THP1 cells, respectively.
The 1577 transcript clusters uniquely modulated by the azacitidine-panobinostat combination in MV4;11 cells were compared to those uniquely modulated by the drug combination in AML-193 (1623 transcript clusters) and THP-1 cells (2295 transcript clusters). 1263 transcript clusters were uniquely modulated in MV4;11 cells compared to AML-193 and THP-1 cells (Fig. 5C). Pathway mapping of these transcripts detected p53 as the most significant upstream regulator with a p-value of 4.56 × 10⁻¹⁵ and activation z-score = 2.770. Interestingly, MV4;11 cells possess wild-type p53 [19] while both AML-193 and THP-1 cells have mutated p53 [20]. These data suggested that azacitidine-panobinostat combination was likely to be more efficient in inducing death in AML cells bearing wild-type p53.
Overexpression of dominant negative mutant of p53 in MV4;11 cells desensitizes to azacitidine-panobinostat treatment
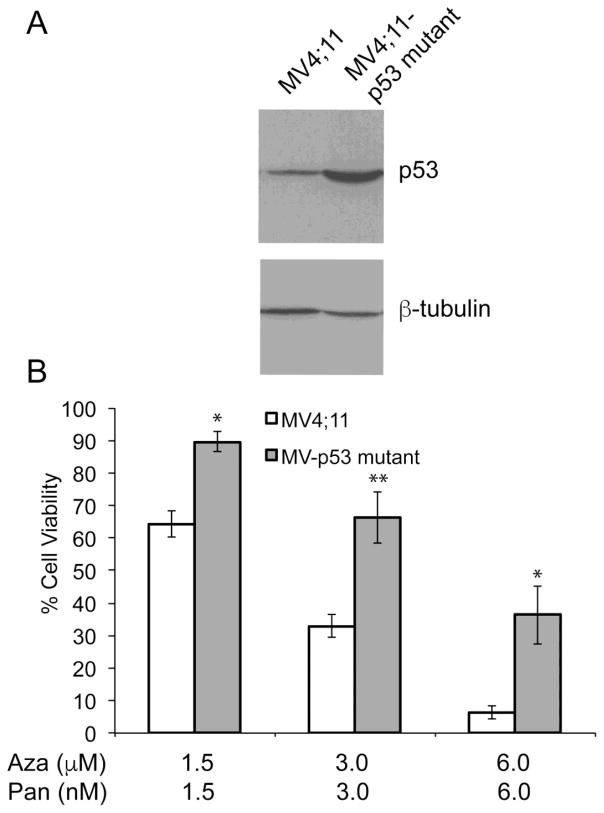
In order to determine if the presence of mutated p53 reduces sensitivity to the azacitidine-panobinostat combination, MV4;11 cells expressing R248W dominant negative mutant of p53 were generated. Figure 6A shows increased levels of p53 protein in cells expressing R248W. MV4;11 R248W cells were used to compare their sensitivity towards azacitidine-panobinostat combination. These cells showed higher cell viabilities when treated with varying doses of azacitidine-panobinostat (Fig. 6B). These data indicate that the presence of wild-type p53 may enhance the sensitivity to epigenetic drugs.
Fig. 6.
(A) Representative immunoblot showing the level of p53 in MV4;11 and MV4;11 cells overexpressing p53 R248W. The antibody recognizes both forms of p53. β-tubulin was used as a loading control. (B) Cell viability of MV4;11 and MV4;11 cells with mutant p53 expressed as a percentage of the viability of the respective cell line when treated with vehicle. Average values from three independent experiments were plotted. *p-value < 0.05, **p-value < 0.001.
DISCUSSSION
Single agent testing of demethylating agents and HDAC inhibitors in children with refractory AML is underway [21]. Clinical application of these agents is largely driven by strategies developed for adult malignancies [5, 18, 22]. In order to develop these promising therapies further in children, a strong preclinical rationale is required. The use of cell line-derived xenograft models of AML for preclinical testing has been established [23]. In this study, we demonstrated the efficacy of the combination of azacitidine and panobinostat, as single agents or in combination, in NSG-B2m mice transplanted with two pediatric AML cell lines – MV4;11 and AML-193, suggesting that this drug combination may be an effective strategy in pediatric AML.
MV4;11 cells, which possess wild-type p53, had lower IC50s for azacitidine and panobinostat compared to AML-193 and THP-1 cells in vitro. MV4;11 cells expressing mutant p53 showed reduced sensitivity to azacitidine-panobinostat combination. These data are consistent with a previous study which showed that a spontaneously generated p53 mutant line of MV4;11 had reduced sensitivity to DNMT and HDAC inhibitor [24]. In our study, mice transplanted with MV4;11 cells achieved complete remission when treated with the drug combination. It should be noted that AML-193 xenografts also responded to combination treatment, although complete remission was not attained. A clinical study showed that the presence of TP53 mutations correlated with poorer survival in AML patients treated with azacitidine [25]. Thus, p53 may be used as a biomarker to stratify patients who would better respond to epigenetic drug therapy. The incidence of TP53 gene mutation in AML is approximately 7% [3, 26], indicating that the majority of AML patients are likely to benefit from this epigenetic drug combination. AML patients with mutant p53 may benefit from supplementation of epigenetic therapy to their cytotoxic chemotherapy regimen. Studies are in progress in the laboratory to develop an integrative treatment regimen that combines chemotherapy with epigenetic therapy in preclinical models.
Other studies have shown that clinical response did not correlate with promoter hypomethylation or histone deacetylation [27]. Our data generates confidence that expanding the gene expression analysis methodology to include other cell lines – both responsive and non-responsive – should provide mechanistic insights into the synergistic induction of complete remission in MV4;11 cells and develop the basis for screening and identifying patients who will benefit from epigenetic therapy.
Highlights.
Epigenetic drugs azacitidine and panobinostat synergistically induce AML cell death
This combination prolonged survival in disseminated mouse models of pediatric AML
Azacitidine panobinostat combination cured mice transplanted with MV4;11 cells
p53 may be a predictor of response to epigenetic therapy in pediatric AML
Acknowledgments
This project was supported by grants from the Delaware-CTR ACCEL (U54GM104941), Leukemia Research Foundation of Delaware, Pilot Awards and Core Access Awards from the Delaware-INBRE (P20GM103446 and P20GM103446-16S1), Biomolecular Core and the Cell Science Core of the Nemours Center for Pediatric Research (P30GM114736), and the Nemours Foundation.
Footnotes
Author contributions: AG designed the research, conducted study, analyzed data and wrote manuscript. EAK designed the research and analyzed data. SMM analyzed the data and edited manuscript. SPB designed the research, conducted study, analyzed data and wrote manuscript.
Disclosures: The authors declare no potential conflicts of interest.
Publisher's Disclaimer: This is a PDF file of an unedited manuscript that has been accepted for publication. As a service to our customers we are providing this early version of the manuscript. The manuscript will undergo copyediting, typesetting, and review of the resulting proof before it is published in its final citable form. Please note that during the production process errors may be discovered which could affect the content, and all legal disclaimers that apply to the journal pertain.
References
- 1.Agrawal-Singh S, Isken F, Agelopoulos K, et al. Genome-wide analysis of histone H3 acetylation patterns in AML identifies PRDX2 as an epigenetically silenced tumor suppressor gene. Blood. 2012;119:2346–2357. doi: 10.1182/blood-2011-06-358705. [DOI] [PubMed] [Google Scholar]
- 2.Schoofs T, Berdel WE, Muller-Tidow C. Origins of aberrant DNA methylation in acute myeloid leukemia. Leukemia. 2014;28:1–14. doi: 10.1038/leu.2013.242. [DOI] [PubMed] [Google Scholar]
- 3.Cancer Genome Atlas Research N. Genomic and epigenomic landscapes of adult de novo acute myeloid leukemia. N Engl J Med. 2013;368:2059–2074. doi: 10.1056/NEJMoa1301689. [DOI] [PMC free article] [PubMed] [Google Scholar]
- 4.Im AP, Sehgal AR, Carroll MP, et al. DNMT3A and IDH mutations in acute myeloid leukemia and other myeloid malignancies: associations with prognosis and potential treatment strategies. Leukemia. 2014;28:1774–1783. doi: 10.1038/leu.2014.124. [DOI] [PMC free article] [PubMed] [Google Scholar]
- 5.Bartholdy B, Christopeit M, Will B, et al. HSC commitment-associated epigenetic signature is prognostic in acute myeloid leukemia. The Journal of clinical investigation. 2014;124:1158–1167. doi: 10.1172/JCI71264. [DOI] [PMC free article] [PubMed] [Google Scholar]
- 6.Araki H, Yoshinaga K, Boccuni P, et al. Chromatin-modifying agents permit human hematopoietic stem cells to undergo multiple cell divisions while retaining their repopulating potential. Blood. 2007;109:3570–3578. doi: 10.1182/blood-2006-07-035287. [DOI] [PubMed] [Google Scholar]
- 7.Farrar JE, Schuback HL, Ries RE, et al. Genomic Profiling of Pediatric Acute Myeloid Leukemia Reveals a Changing Mutational Landscape from Disease Diagnosis to Relapse. Cancer research. 2016;76:2197–2205. doi: 10.1158/0008-5472.CAN-15-1015. [DOI] [PMC free article] [PubMed] [Google Scholar]
- 8.Ho PA, Kutny MA, Alonzo TA, et al. Leukemic mutations in the methylation-associated genes DNMT3A and IDH2 are rare events in pediatric AML: a report from the Children’s Oncology Group. Pediatric blood & cancer. 2011;57:204–209. doi: 10.1002/pbc.23179. [DOI] [PMC free article] [PubMed] [Google Scholar]
- 9.Balgobind BV, Zwaan CM, Pieters R, et al. The heterogeneity of pediatric MLL-rearranged acute myeloid leukemia. Leukemia. 2011;25:1239–1248. doi: 10.1038/leu.2011.90. [DOI] [PubMed] [Google Scholar]
- 10.de Rooij JD, Zwaan CM, van den Heuvel-Eibrink M. Pediatric AML: From Biology to Clinical Management. J Clin Med. 2015;4:127–149. doi: 10.3390/jcm4010127. [DOI] [PMC free article] [PubMed] [Google Scholar]
- 11.Baker SJ, Markowitz S, Fearon ER, et al. Suppression of human colorectal carcinoma cell growth by wild-type p53. Science. 1990;249:912–915. doi: 10.1126/science.2144057. [DOI] [PubMed] [Google Scholar]
- 12.Gopalakrishnapillai A, Kolb EA, Dhanan P, et al. Generation of pediatric leukemia xenograft models in NSG-B2m mice: Comparison with NOD/SCID mice. Frontiers in oncology. 2016:6. doi: 10.3389/fonc.2016.00162. [DOI] [PMC free article] [PubMed] [Google Scholar]
- 13.Carvalho BS, Irizarry RA. A framework for oligonucleotide microarray preprocessing. Bioinformatics. 2010;26:2363–2367. doi: 10.1093/bioinformatics/btq431. [DOI] [PMC free article] [PubMed] [Google Scholar]
- 14.Benjamini Y, Drai D, Elmer G, et al. Controlling the false discovery rate in behavior genetics research. Behav Brain Res. 2001;125:279–284. doi: 10.1016/s0166-4328(01)00297-2. [DOI] [PubMed] [Google Scholar]
- 15.Ritchie ME, Phipson B, Wu D, et al. limma powers differential expression analyses for RNA-sequencing and microarray studies. Nucleic Acids Res. 2015;43:e47. doi: 10.1093/nar/gkv007. [DOI] [PMC free article] [PubMed] [Google Scholar]
- 16.Smyth GK. Linear models and empirical bayes methods for assessing differential expression in microarray experiments. Stat Appl Genet Mol Biol. 2004;3 doi: 10.2202/1544-6115.1027. Article3. [DOI] [PubMed] [Google Scholar]
- 17.Saeed AI, Sharov V, White J, et al. TM4: a free, open-source system for microarray data management and analysis. Biotechniques. 2003;34:374–378. doi: 10.2144/03342mt01. [DOI] [PubMed] [Google Scholar]
- 18.Tan P, Wei A, Mithraprabhu S, et al. Dual epigenetic targeting with panobinostat and azacitidine in acute myeloid leukemia and high-risk myelodysplastic syndrome. Blood cancer journal. 2014;4:e170. doi: 10.1038/bcj.2013.68. [DOI] [PMC free article] [PubMed] [Google Scholar]
- 19.Kojima K, Konopleva M, Tsao T, et al. Selective FLT3 inhibitor FI-700 neutralizes Mcl-1 and enhances p53-mediated apoptosis in AML cells with activating mutations of FLT3 through Mcl-1/Noxa axis. Leukemia. 2010;24:33–43. doi: 10.1038/leu.2009.212. [DOI] [PubMed] [Google Scholar]
- 20.Bamford S, Dawson E, Forbes S, et al. The COSMIC (Catalogue of Somatic Mutations in Cancer) database and website. Br J Cancer. 2004;91:355–358. doi: 10.1038/sj.bjc.6601894. [DOI] [PMC free article] [PubMed] [Google Scholar]
- 21.Tasian SK, Pollard JA, Aplenc R. Molecular therapeutic approaches for pediatric acute myeloid leukemia. Frontiers in oncology. 2014;4:55. doi: 10.3389/fonc.2014.00055. [DOI] [PMC free article] [PubMed] [Google Scholar]
- 22.Figueroa ME, Lugthart S, Li Y, et al. DNA methylation signatures identify biologically distinct subtypes in acute myeloid leukemia. Cancer cell. 2010;17:13–27. doi: 10.1016/j.ccr.2009.11.020. [DOI] [PMC free article] [PubMed] [Google Scholar]
- 23.Saland E, Boutzen H, Castellano R, et al. A robust and rapid xenograft model to assess efficacy of chemotherapeutic agents for human acute myeloid leukemia. Blood cancer journal. 2015;5:e297. doi: 10.1038/bcj.2015.19. [DOI] [PMC free article] [PubMed] [Google Scholar]
- 24.Nishioka C, Ikezoe T, Yang J, et al. Simultaneous inhibition of DNA methyltransferase and histone deacetylase induces p53-independent apoptosis via down-regulation of Mcl-1 in acute myelogenous leukemia cells. Leuk Res. 2011;35:932–939. doi: 10.1016/j.leukres.2011.04.004. [DOI] [PubMed] [Google Scholar]
- 25.Bally C, Ades L, Renneville A, et al. Prognostic value of TP53 gene mutations in myelodysplastic syndromes and acute myeloid leukemia treated with azacitidine. Leuk Res. 2014;38:751–755. doi: 10.1016/j.leukres.2014.03.012. [DOI] [PubMed] [Google Scholar]
- 26.Fenaux P, Preudhomme C, Quiquandon I, et al. Mutations of the P53 gene in acute myeloid leukaemia. Br J Haematol. 1992;80:178–183. doi: 10.1111/j.1365-2141.1992.tb08897.x. [DOI] [PubMed] [Google Scholar]
- 27.Klco JM, Spencer DH, Lamprecht TL, et al. Genomic impact of transient low-dose decitabine treatment on primary AML cells. Blood. 2013;121:1633–1643. doi: 10.1182/blood-2012-09-459313. [DOI] [PMC free article] [PubMed] [Google Scholar]


