Abstract
A new portal imager consisting of four vertically stacked conventional electronic portal imaging device (EPID) layers has been constructed in pursuit of improved detective quantum efficiency (DQE). We hypothesize that super-resolution (SR) imaging can also be achieved in such a system by shifting each layer laterally by half a pixel relative to the layer above. Super-resolution imaging will improve resolution and contrast-to-noise ratio (CNR) in megavoltage (MV) planar and cone beam computed tomography (MV-CBCT) applications. Simulations are carried out to test this hypothesis with digital phantoms.
To assess planar resolution, 2 mm long iron rods with 0.3 × 0.3 mm2 square cross-section are arranged in a grid pattern at the center of a 1 cm thick solid water. For measuring CNR in MV-CBCT, a 20 cm diameter digital phantom with 8 inserts of different electron densities is used. For measuring resolution in MV-CBCT, a digital phantom featuring a bar pattern similar to the Gammex™ phantom is used.
A 6 MV beam is attenuated through each phantom and detected by each of the four detector layers. Fill factor of the detector is explicitly considered. Projections are blurred with an estimated point spread function (PSF) before super-resolution reconstruction.
When projections from multiple shifted layers are used in SR reconstruction, even a simple shift-add fusion can significantly improve the resolution in reconstructed images. In the reconstructed planar image, the grid pattern becomes visually clearer. In MV-CBCT, combining projections from multiple layers results in increased CNR and resolution. The inclusion of two, three and four layers increases CNR by 40%, 70% and 99%, respectively. Shifting adjacent layers by half a pixel almost doubles resolution. In comparison, using four perfectly aligned layers does not improve resolution relative to a single layer.
Keywords: EPID, super-resolution imaging, portal imaging, MV-CBCT
1 Introduction
In complex external beam radiation therapy (EBRT) treatments such as intensity modulated radiotherapy (IMRT), volumetric modulated arc therapy (VMAT) and stereotactic body radiation therapy (SBRT), the dose is highly conformal to the target with steep dose gradients1–6. While the high conformality leads to better tumor control and healthy tissue sparing, it is important to verify patient set-up before treatment and tumor position during the treatment7–9.
Megavoltage cone-beam computed tomography (MV-CBCT) has been studied10–13 and implemented commercially in helical tomotherapy and linear accelerator treatment machines14–17. For example, Abou-Elenein et al. reported that a Seimens OPTIVUE/MVCB system is capable of distinguishing a 1% electron density difference for objects larger than 2 cm with a 5 MU protocol16. Advantages of MV-CBCT over kV-CBCT include reduced artifacts from metal objects, inherently co-registered treatment and imaging isocenter, and simplified Hounsfield Unit to electron density conversion for adaptive radiation therapy18–22. Disadvantages include additional imaging dose and poorer image contrast. If these drawbacks could be overcome, a simplified linac with only MV imaging could offer substantial advantages especially in low and middle-income countries.
A typical MV electronic portal imaging device (EPID) is composed of a copper plate, Gd2O2S:Tb phosphor and active matrix flat panel imager (AMFPI). For a 6 MV beam, the detective quantum efficiency (DQE) of clinical EPIDs is ~1%23. Due to the low efficiency, increased radiation dose is necessary to acquire clinically useful images. The reported MV-CBCT imaging dose varies from 5–15 cGy depending on imaging site and generally higher MU is required to delineate soft tissue such as muscle and fat16, 18, 24, 25. Efforts have been made to reduce imaging dose by synchronizing image acquisition and respiratory gating26, 27 and utilizing low-Z targets such as aluminum or carbon. With the latter, it has been shown that a 1 cGy image dose can produce sharp enough CBCT image for head-neck and prostate alignment28, 29.
To overcome the limitation imposed by the low DQE of current generation EPIDs, high efficiency detectors have been investigated. For example, Star-Lack et al. recently reported the construction of a focused large-area pixelated “strip” cadmium tungstate (CdWO4) detector, which offers a DQE >20%, an improvement of more than 20-fold in sensitivity, and a spatial resolution of 7 lp/cm in CBCT scans30. Wang et al. showed that detectors based on thick, segmented Bi4Ge3O12 (BGO) or CsI:Tl can significantly increase DQE to above 20% at zero spatial frequency31. El-Mohri et al. showed that MV-CBCT using a similar device with a total scan dose of ~4 cGy can visualize objects with electron density difference of ~2.76% and spatial resolutions of 4 lp/cm for BGO and 3 lp/cm for CsI:Tl can be achieved32. Kirvan et al. demonstrated that 15 mm diameter, 1.5% contrast target can be resolved using multislice thick, segmented CdWO4 photodiode detectors with a 2 cGy delivery and demonstrated high contrast spatial resolution (5 lp/cm)33.
We have reported on the development of a prototype imager that consists of four vertically stacked conventional EPID layers, as illustrated in Figure 1, with the ability to switch on any layer combination34. By combining signals from multiple layers, the quantum efficiency and therefore CNR will be improved. The characterization of this detector is published elsewhere35.
Figure 1.
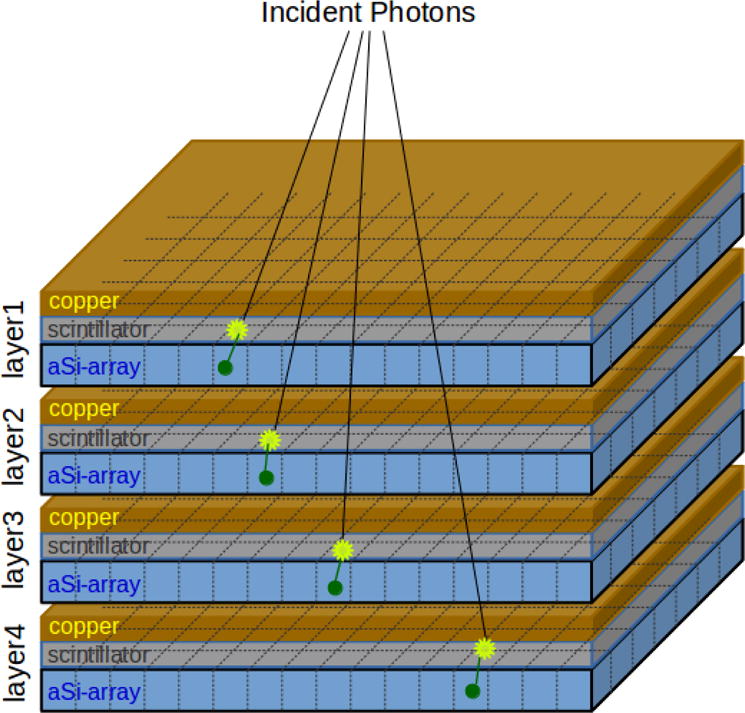
Illustration of the configuration of four stacked EPID layers
Since Tsai and Huang first proposed the principle of super-resolution (SR) image reconstruction, many reconstruction methods have been proposed36–40. SR image reconstruction seeks resolution enhancement through the super-position of multiple low resolution (LR) images from slightly different perspectives. The LR images may come from one camera in several captures, such as images captured by a camera or video recorder on a satellite or an airplane. Alternatively, LR images may be captured by several cameras each located at a different position. When combined, each LR image can contribute to a high resolution (HR) image with information which is not available in other LR constituents. When LR images are sampled under the Nyquist frequency, spectrum overlapping and aliasing can occur, causing high frequency information (image details) to be packed into the sparsely sampled LR images. This high frequency information can be recovered if the LR images are shifted by a fraction of a pixel, which causes a phase shift in the frequency domain. As the phase shift is frequency dependent, a set of phase shift equations can be constructed from a set of LR images, and high frequency information can be recovered by solving these equations.
We hypothesize that a prototype imager consisting of four conventional EPID layers can be used for super-resolution imaging, if each layer is shifted strategically. Specifically, with all layers perpendicular to the central axis of the incident linac beam, keeping the first layer centered at the beam axis, the second layer is shifted in the x direction by half a pixel pitch, the third layer is shifted in the y direction by half a pixel pitch, and the fourth layer is shifted in both x and y directions by half a pixel pitch (as shown in Figure 2a). Effectively, there would be four cameras capturing the same scene, each from a slightly different position. The projections from each layer can serve as LR images for SR image reconstruction, which will lead to higher resolution portal and MV-CBCT images.
Figure 2.
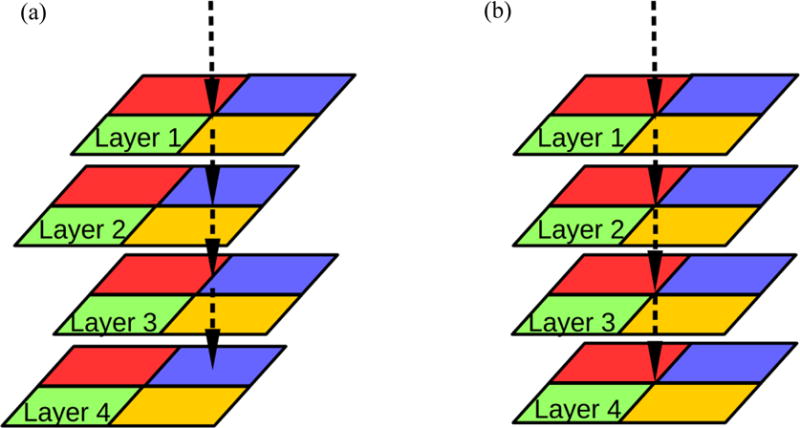
Four adjacent pixels, each represented by a colored block, are shown for each layer. The arrow points to the isocenter projection in each layer (a) Four shifted layers and (b) Four aligned layers
The proposed method doubles the sampling rate, similar to detector quarter-offset or focal spot wobble, two tactics used in diagnostic CT for improving image resolution41–43. But, a few crucial differences should be noted. First, the proposed shifting strategy in the stacked EPID layers doubles the sampling rate in both directions, similar to a conventional CT equipped with both detector quarter-offset and z-flying focal spot or focal spot wobbling in both directions. Second, detector quarter-offset must combine projections from opposite gantry angles to work as they interleave, while the proposed shifting in the multi-layer detector doubles sampling rate in both x and y directions for any given gantry angle, hence, a full arc is not required. Third, a medical linear accelerator is not equipped with focal spot wobbling capability, but shifting pixels doubles the sampling rate without the need to move the focal spot. This eliminates any possible motion blur that would come from steering an electron beam. Therefore, the proposed lateral shifting in a multilayer detector combined with SR image reconstruction offers a promising solution to the unique challenges of imaging with the radiotherapy beam.
2 Method
The simulation uses the geometry of a Varian clinical linear accelerator (Varian Medical System, Inc., Palo Alto, CA), with a source-axis distance (SAD) of 100 cm. The top detector layer is 150 cm from the effective source with the remaining three layers positioned as described above. Three phantoms are used to simulate the SR reconstructions of portal image and MV-CBCT. The phantoms are placed at isocenter. The reconstruction toolkit RTK44 and Python are used for creating phantoms, forward projecting and CBCT reconstruction.
In the following, section 2.1 describes how images are formed in each of the four EPID layers; section 2.2 describes the SR reconstruction of portal image; sections 2.3 and 2.4 describe how the enhancement of CNR and resolution in SR MV-CBCT is accessed.
2.1 Image formation in an EPID layer
To simulate the effect of lateral shifting, the four layers are arranged as in Figure 2a. The isocenter is projected on the center of the first layer; the second layer is shifted in the x direction by half a pixel pitch; the third layer is shifted in the y direction by half a pixel pitch; the forth layer is shifted in both the x and y directions by half a pixel pitch. In comparison, Figure 2b shows four perfectly aligned vertically stacked layers.
Because the four EPID layers are stacked vertically, each layer is located further away from the isocenter relative to the layer above by one-layer thickness, introducing a divergence effect, as shown in Figure 3. To simulate this effect, each layer is assigned an appropriate source-imager distance (SID). For example, if the first layer has a SID of 150 cm, then the SID for the other three layers are 150.35 cm, 150.70 cm, and 151.05 cm, respectively.
Figure 3.
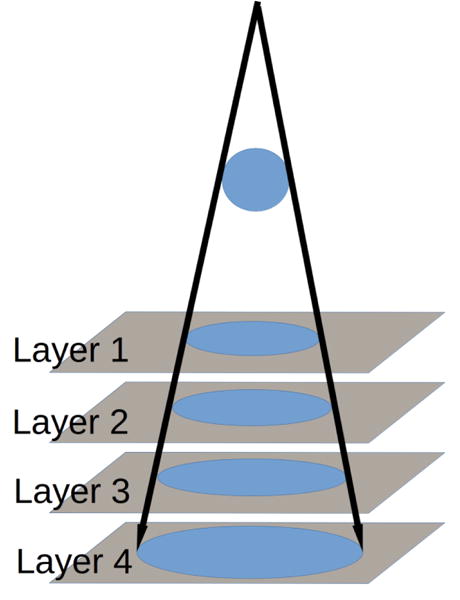
Layers further away from the source have a larger SID, causing a divergence effect.
The detector pixel pitch is set to 0.34 mm (similar to the current clinical EPID specifications) and pixel fill factor is explicitly considered in the simulation. As shown in Figure 4, a pixel (for example, the red block) is first divided into a finer grid (4 × 4 in Figure 4 for illustration purposes), a phantom placed at the isocenter is then projected onto this fine-grid ‘imager’ using RTK. Then, the shaded area is set to 0 to represent the area taken up by electronics. The remaining area is regrouped (as indicated by the yellow square) and the average value is assigned to the pixel, for which the star is the center. This regrouped image is used as the ideal output of an EPID layer, which will be further processed (see below) to represent the real output of a layer. In the actual simulation, an 8 × 8 grid is used, for a fill factor of 75%.
Figure 4.
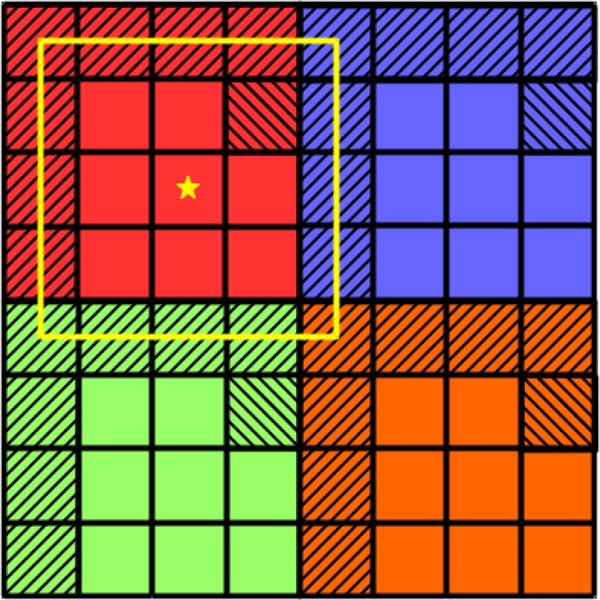
To simulate fill factor, each pixel is divided to a finer grid to form a ’super-fine’ detector, then in the projection, the shaded pixels are set to 0 to represent the area occupied by electronics.
After fill factor is considered, the resulting image is convolved with a point spread function (PSF) to simulate the degradation of image quality due to the finite focal spot size and scattering. For simplicity, a Gaussian kernel whose Fourier transform approximates the measured modulation transfer function (MTF) is used for all four layers as the measured MTFs for each layer are almost the same. Signal loss from one layer to the next is also neglected since the measurements have shown little attenuation from one layer to the next35. The above operation results in four images representing the four EPID layers, which are then used for SR portal imaging and MV-CBCT reconstructions.
2.2 Super-resolution reconstruction of portal images
A grid pattern phantom created using RTK and Python, as shown in Figure 5, is used to test SR portal imaging. The grid pattern consists of 2 mm iron rods whose cross section is 0.3 × 0.3 mm2 square, arranged 0.3 mm apart, embedded at the center of 1 cm thick solid water. The surface of the solid water is 20 × 20 cm2 so that its projection covers most of the detector. The larger area is necessary to test if SR reconstruction works for both the center and the edges of the detector. Images from each EPID layer are calculated as described in section 2.1 and Poisson noise is added.
Figure 5.
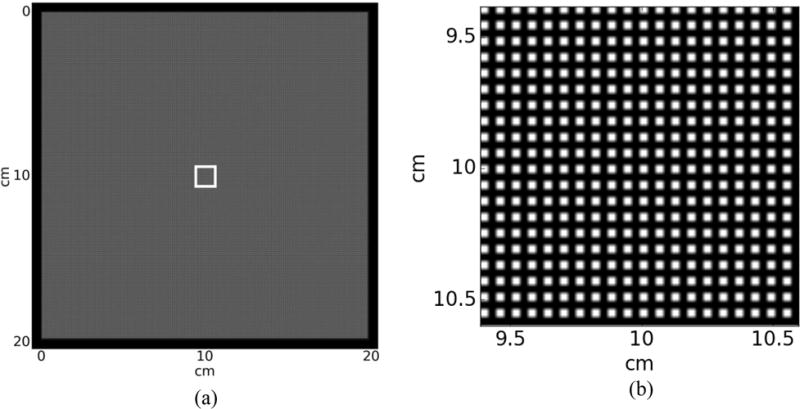
Super-resolution portal imaging phantom (a) Large area phantom to test the validity of SR reconstruction across the detector and (b) Enlarged view of the region indicated in (a) by the white square
As the projections from four stacked EPID layers are not on the same plane, it is necessary to first back project the bottom three layers to the top layer before SR reconstruction. Because we are using a flat detector and a divergent beam, the effective pixel shift changes from the center of the detector towards the edge, as illustrated in Figure 6. If the kth layer is shifted by half a pixel pitch with respect to the first layer, the pixel at i + 0.5 on the kth layer will appear at instead. This discrepancy in pixel shift becomes larger towards the edge of the detector. Thus, the back projected image is interpolated to its original grid at i + 0.5, similar to the approach adopted in digital tomosynthesis. The resulting images will be used as LR images for SR reconstruction.
Figure 6.
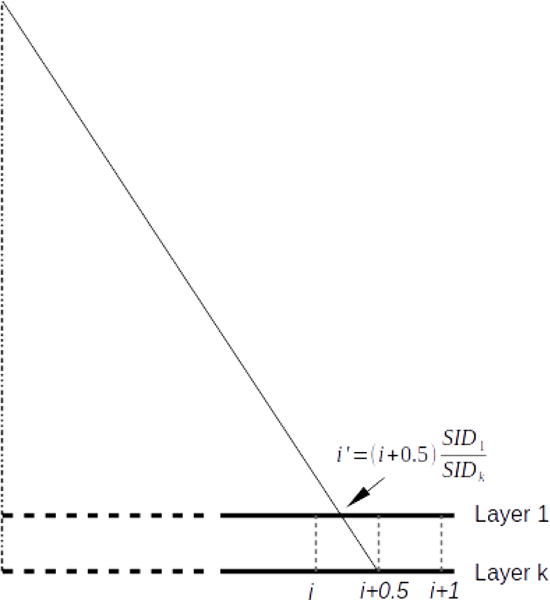
When projections from bottom layers are back projected to the first layer, the apparent shift will appear to be less than a half pixel due beam divergence. It is necessary to interpolate the back projected image onto its original grid.
The image from the top layer and the three back projected images can be used as an observed LR image for reconstructing the HR image. Let be the HR image and be the LR image. The relationship between LR and HR images can be modelled by the following equation:
| (1) |
where, Wi is a warp matrix representing translational and rotational motion, Hi is a blurring matrix, Di is the downsampling matrix and ni is the additive noise.
Because the three bottom layers are each off set by half a pixel in x-direction, y-direction, and both x- and y-directions with respect to the top layer, the four projections form a complete set of LR images. In this particular case, it is exactly known how each LR image adds to the HR image. A simple shift-add LR fusion can be used as the initial step of SR reconstruction. In the shift-add fusion, each observation in LR images is cycled through and placed in the HR image, as illustrated in Figure 7.
Figure 7.
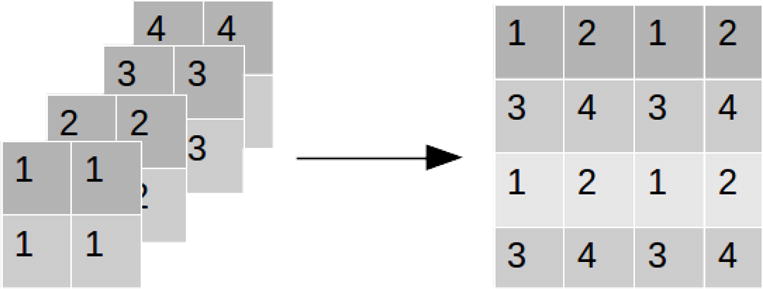
In shift-add fusion, each observation in a LR image is cycled through and placed in the HR image
The shift-add fusion essentially reverses the effects of translation Wi and downsampling Di resulting in a noised, blurred HR image. Note that the blurring kernel Hi here does not represent finite focal spot size, geometrical blurring, or photon scattering in the imaging system. Rather, it is a result of the area of a pixel on the AMFPI increasing by a factor of four (pixel density reducing by factor of four). Thus, it’s assumed that the output of a coarse pixel is an average of four fine pixels:
| (2) |
Consequently, the resulting image from shift-add fusion can be deconvolved using Hi to de-blur and de-noise. An unsupervised Wiener-Hunt deconvolution algorithm is used to minimize the introduction of artefacts45. The algorithm estimates the point spread function (PSF) parameters and hyperparamters within a Bayesian framework, and is shown to be able to restore spatial details.
2.3 CNR enhancement in MV-CBCT
The SR MV-CBCT images involving different EPID layers are formed by averaging the reconstructed volumes from individual layers. These reconstructed volumes, each using only projections from one layer, are reconstructed at the same volume grid using RTK with the FDK algorithm46.
The SR MV-CBCT images from four shifted layers are compared with that from a single layer and four perfectly aligned stacked layers. In the case of four aligned, stacked layers, the signal may be processed in two ways. If the signal from each layer is read out individually, the MV-CBCT images are formed as described above. If the signal is summed internally and only one set of images is read out instead of separate sets, the reconstruction is performed based on the summed image using an averaged SIDeq:
| (3) |
where N is number of layers. The motivation of using the geometric mean instead of arithmetic mean is that geometric mean is more closely related to the inverse square law and the X-ray fluence at SIDeq approximates better to the averaged fluence from four stacked layers (see appendix 1).
The addition of multiple layers increases the amount of collected photons. If the four layers are perfectly stacked, the signal-to-noise ratio (SNR) in the SR MV-CBCT images resulting from averaging four individually reconstructed volumes should be roughly doubled compared to a single layer. It is expected that when information from four laterally shifted layers are combined to form one set of SR MV-CBCT images, it would lead to a similar improvement in image quality. To verify this, a second digital phantom is created using RTK to study the effects of lateral shifting on CNR. The phantom consists of a 20 cm diameter disk with a thickness of 2.5 cm and eight inserts of various densities arranged in a ring, as illustrated in Figure 8. The linear attenuation coefficient of lung, μlung, at 2 MeV, (the averaged energy of a 6 MeV beam), is assigned to the disk. Each of the eight inserts has a linear attenuation coefficient of n · μlung (n = 1,2 ⋯ 8), where n = 1 is used as reference. Since ρlung ≈ ρsoft tissue/4 as in Ref47, and at 2 MeV, the mass attenuation coefficients of soft tissue and lung are similar (4.895 × 10⁻²cm2⁄g for soft tissue versus 4.9 × 10⁻²cm2⁄g for lung tissue, NIST, ICRU-44)48, the n=4 insert represents the case of a tumor inside a lung. The output images from each EPID layer is calculated according section 2.1 and Poisson noise is added to all projections.
Figure 8.
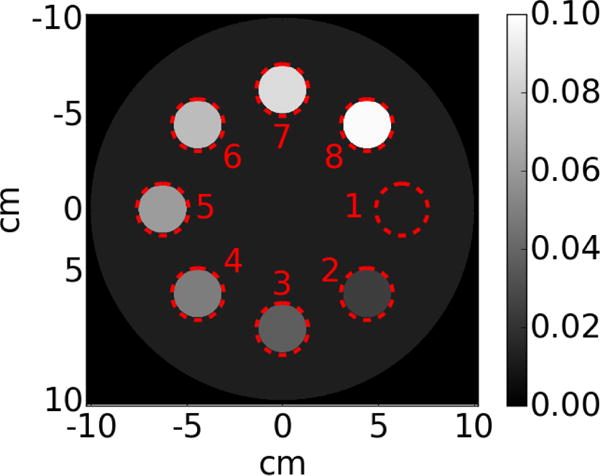
Contrast phantom consisting of a 2.5 cm thick, 20 cm diameter disk and 8 inserts. The disk is lung equivalent, the nth insert has a attenuation coefficient equal to n × μlung
Reconstructions are carried out with projections from the top layer only, the top two layers, the top three layers and all four layers. In each case, CNR is evaluated for inserts (n = 2 ⋯ 8) with respect to the reference insert (n = 1). Then the ratio of CNR for each configuration to the CNR for a single layer is evaluated:
| (4) |
where n is the insert index, and N is the number of layers involved.
2.4 Resolution enhancement in MV-CBCT
To study the effect of lateral shifting of each layer on spatial resolution in a reconstructed MV-CBCT volume, a phantom with a bar pattern similar to the Gammex™ phantom is created, as illustrated in Figure 9. The phantom is 12.5 mm thick, the voxel dimension is 50 × 50 × 50 μm3 and the detector pixel pitch for each EPID layer is 0.34 mm. The high definition of this phantom is necessary to study the effect of layer shifting on resolution but it also limits the size of the phantom that can be used. The bar patterns range from 2 to 16 voxels per line pair, which is equivalent to 1.25, 1.4, 1.7, 2.0, 2.5, 3.3, 5.0 and 10.0 lp/mm. Attenuation coefficient of soft tissue at 2 MeV (μ⁄ρ = 4.895 × 10⁻²cm2⁄g, ρ = 1.06 cm3, from NIST) is assigned to the disk and calcium sulfate at 2 MeV (μ⁄ρ = 4.488 × 10⁻²cm2⁄g, ρ = 2.96 g⁄cm3, from NIST) is assigned to bars.
Figure 9.
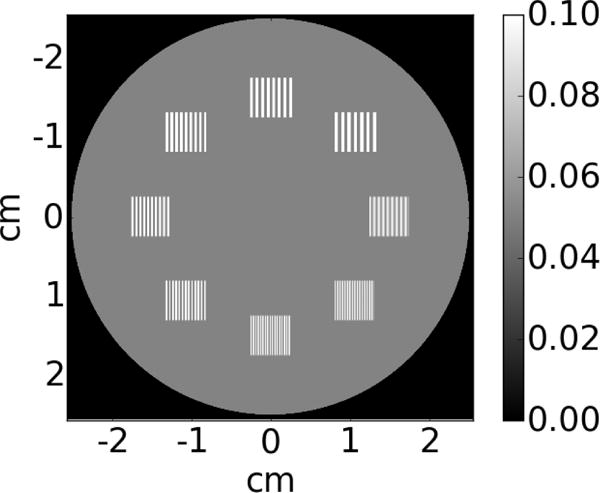
Resolution phantom consisting of a cylinder embedded with bar patterns. The voxel size is 50 μm. The resolution of bar patterns ranges from 2 voxels to 16 voxels per line pair.
3 Results
3.1 SR portal imaging
Figure 10a shows the full view of a reconstructed SR image after deconvolution. Figure 10b to 10f show detailed views of the center and the corner areas marked by the squares in Figure 10a. Figure 10b shows the center of the projection of the phantom in Figure 5 onto the first EPID layer. It is evident that the grid pattern is unrecognizable because the detector does not have sufficient resolution. Figure 10c shows the center of the image after shift-add fusion, where the grid pattern becomes visible. Deconvolution further improves the reconstructed portal image as shown in Figure 10d. Figure 10e shows the corner area of SR reconstruction, where the grid pattern is clearly seen and identical to the center as in 10d. Figure 10f shows that if the beam divergence is not corrected for, the SR reconstruction will fail for areas away from the center of the beam. Figure 10a to 10f show the projections from each layer, after being back projected onto the top layer and corrected for the beam divergence, form a complete set of LR images which can be used for SR reconstruction. The pattern may also be recognizable by a higher resolution detector, for example, a single layer EPID with a 0.17mm pixel pitch. Figure 10g shows the projection of the phantom onto to such a detector. While the pattern can be seen, the SNR is much lower because, for the same imaging dose, each pixel receives only a quarter of the total X-ray fluence.
Figure 10.
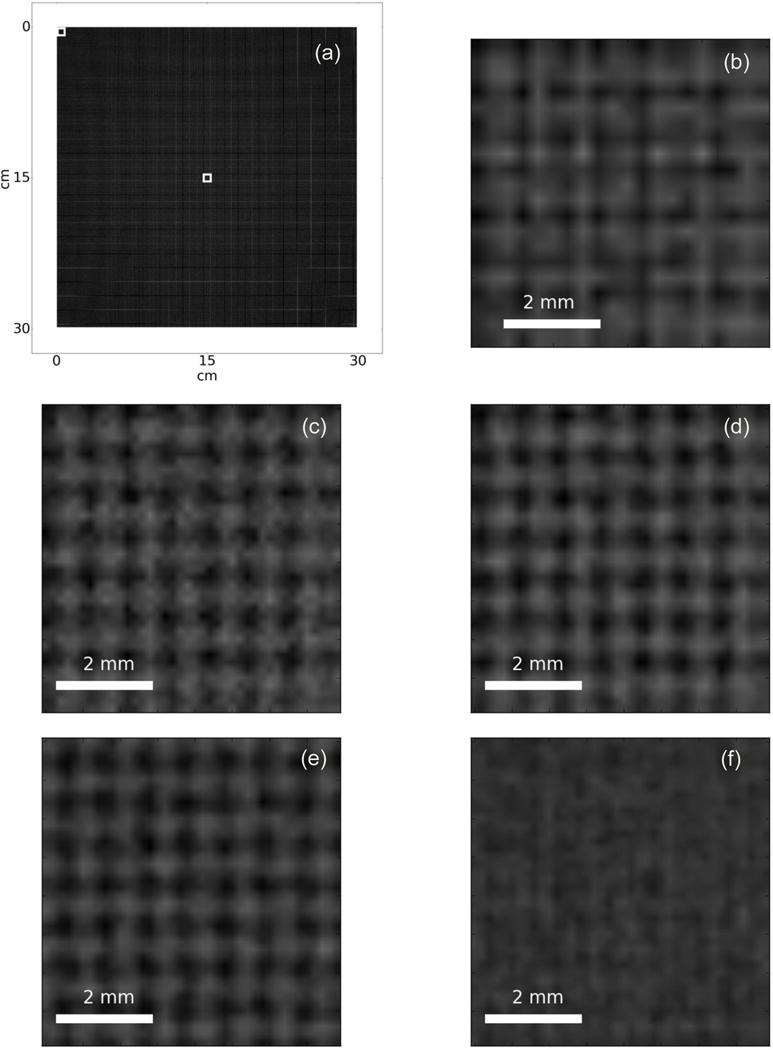
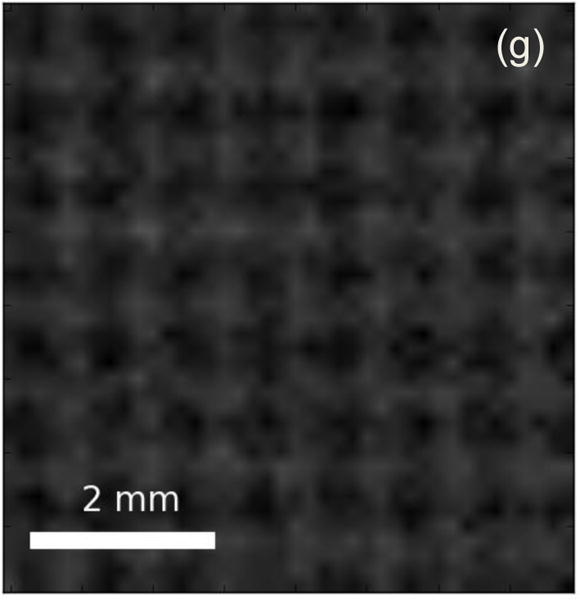
Super-resolution image reconstruction results in high resolution portal image. The reconstructed SR image has a better SNR compared to a projection in a single higher resolution detector (a). full view of the SR reconstruction, (b) center of LR image from top layer, (c) center of shift-add fusion, (d) center of deconvoluted shift-add fusion, (e) corner of deconvoluted shift-add fusion, (f) corner of shift-add fusion without interpolating back projected LR images, and (g) HR image, projection onto a detector with 4 times pixel density.
3.2 CNR enhancement in MV-CBCT
It is hypothesized that SR MV-CBCT images resulted from combining the outputs of laterally shifted layers would have similar CNR as that from four well aligned layers. Figure 11 shows axial views of the central slice of the CNR phantom reconstructed from the first layer only, four shifted layers and four aligned layers. Qualitatively, the reconstruction from just one layer is noisier compared to the other three reconstructions (Figure 11a).
Figure 11.
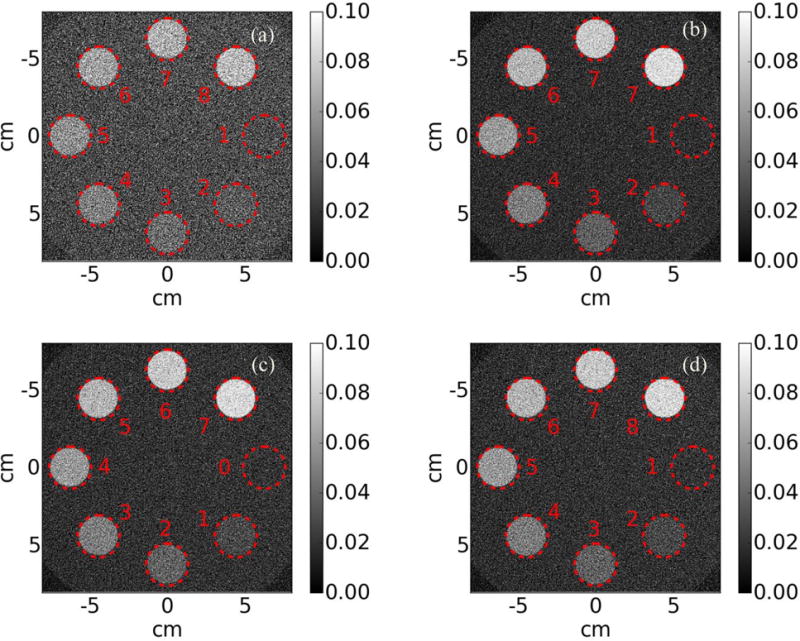
Central axial view of reconstructed CNR phantom using (a) the first layer, (b) laterally shifted layers, (c) aligned layers, each layer is read out separately and (d) aligned layers, all layers are summed and read out as one
Quantitatively, we find that as more layers are included, image quality improves, regardless of alignment. From theory, the CNR is expected to improve with (N= the number of layers)49. The CNR ratio for soft tissue is found to be , , as theory predicts. In fact, the ratios are about the same for all other inserts. In the case of four aligned layers, the CNR is independent of whether projections are read out separately or summed internally and read out in unison.
3.3 Resolution enhancement in MV-CBCT
Laterally shifting layers by half a pixel (as shown in Figure 2) improves MV-CBCT resolution. Figure 12a shows the resolution phantom reconstructed from just one layer. Figure 12b and 12c show reconstruction using four perfectly aligned, stacked layers. The former represents the case where each layer is read out separately while the latter represents the case where all four layers are integrated internally before read out. The resolutions in Figure 12a, 12b and 12c are almost identical, each can partially resolve bar patterns of 2.5 and 2.0 lp/mm, but fail at 3.3 lp/mm. With shifted layers (Figure 12d), bar patterns of 2.0, 2.5 and 3.3 lp/mm are resolved.
Figure 12.
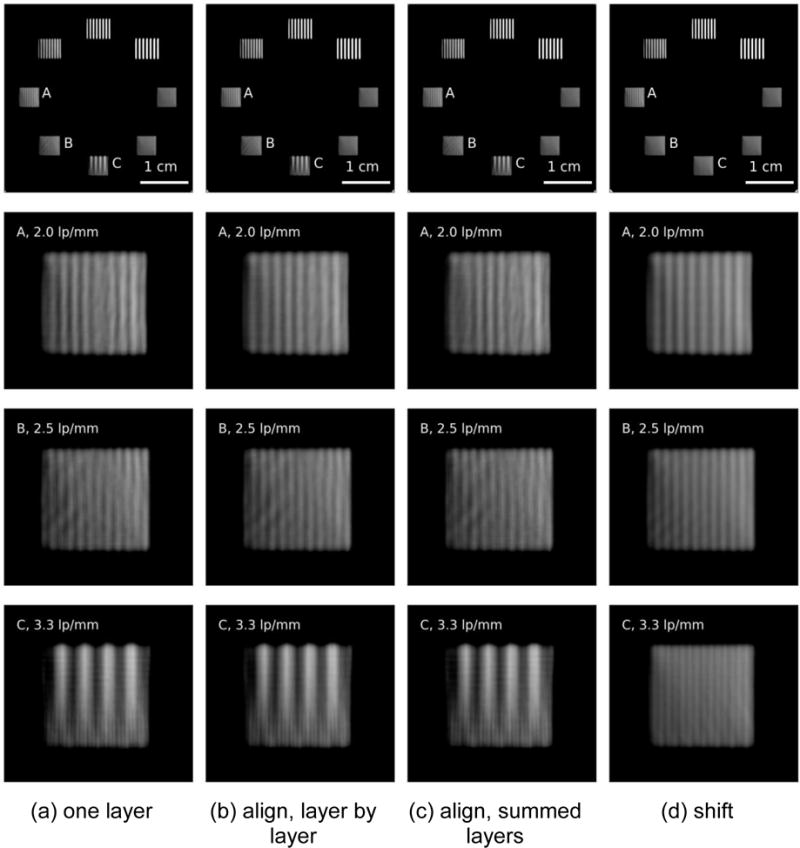
Resolution comparison. Single layer (column (a)) and aligned layers(columns(b) and (c)) have similar resolving power, traces of effects of aliasing can be seen at 2 lp/mm and 2.5 lp/mm, while laterally shifted layer (column (d)) can resolve up to 3.3 lp/mm.
4 Discussion
We have shown that shifting layers relative to each other in a four-layer detector enables SR image reconstruction for both MV portal imaging and MV-CBCT. SR imaging enhances both image resolution and CNR relative to single layer or perfectly aligned multi-layers. Our study modelled beam divergence and fill factor as degrading factors. In particular, because the EPID is flat, the beam divergence must be accounted for prior to reconstructing the SR portal image. The SR image reconstruction method used in this paper is relatively simple, yet it is sufficient to demonstrate that the proposed shifting strategy leads to a complete set of LR images from which a high resolution image can be reconstructed. It is expected that images of better quality can be achieved if more sophisticated SR reconstruction algorithms such as iterative reconstruction are employed50, 51. The EPID pixel size in this study is assumed to be 0.34 mm, but the concept presented here is not limited to this particular pixel size. For example, for a MV detector which uses thick, segmented crystal scintillators, pixel size would likely be larger and SR imaging could have a greater benefit if they are stacked up in the fashion proposed by this paper. In the case of a stacked EPID imager, the projections in each layer could be binned before readout and then the SR reconstruction would recover the resolution with the benefit of reduced imaging dose because of binning and higher frame rate.
Because the new imager consists of four vertically stacked conventional EPID layers, four times as many photons are detected compared to the current clinical single layer MV panel. Combining the outputs of four layers is equivalent to a four-fold increase in the detection efficiency, which leads to a doubling in CNR. In the prototype multi-layer imager, a five fold increase in DQE is found due to the use of thicker scintillator layers (436 μm) than that is normally used in the clinical single layer imagers (290 μm)35. The improved CNR has several clinical implications. An immediate benefit is dose reduction during IGRT, either using MV-CBCT or planar imaging. In theory, the multi-layer imager can achieve the same CNR as the clinical single layer imager with five times less dose. Another benefit is improved tumor localization during radiation therapy, which could enable online adaptive radiation therapy, or more accurate reconstruction of delivered dose52.
While stacking EPID layers improves CNR in MV-CBCT, including lateral layer shifting also improves MV-CBCT resolution. Shifting by half a pixel in both x and y directions doubles the sampling rate and Nyquist frequency. Each shifted layer acts as a camera that captures the same scene with a slightly different perspective. Each shifted layer image contains information that is not in the other three projections, which allows for SR MV-CBCT. In reconstructing SR MV-CBCT, we adopt the approach of first reconstructing the volume on the same grid from each layer and then combining four reconstructed volumes. Alternatively, four projections from the same gantry angle can be combined to construct a SR projection and then each of these used for the MV-CBCT reconstruction. But caution must be taken as the reconstructed SR projection may contain high frequency noise which could lead to artefacts, especially when deconvolution is used. Investigation of robust SR MV-CBCT reconstruction will be carried out in the future.
While a prototype of the vertically stacked, four-layer design has been built to evaluate the characteristics, such as DQE, CNR and MTF, layer shifting has not implemented physically yet. However, the results of this paper provide the theoretical justification for the continued exploration of this novel imaging concept.
5 Conclusion
Multiple layering of detector components in an EPID has already been shown to improve DQE and CNR. The simulation presented in this paper shows that if each layer in a four-layer imager is shifted by half a pixel pitch, the sampling rate will be doubled. The four projections from each layer can be used as a complete set of LR images for SR image reconstruction. This provides superior portal imaging and MV-CBCT resolution, while still maintaining the same CNR improvement as four aligned layers.
Acknowledgments
The project described was supported, in part, by a grant from Varian Medical Systems, Inc., and award No. R01CA188446-01 from the National Cancer Institute. The content is solely the responsibility of the authors and does not necessarily represent the official views of the National Cancer Institute or the National Institutes of Health.
6 Appendix
-
When signals from four layers are averaged internally and read out as one, it has to be assigned with a SIDeq that is between the top and the bottom layers.
Let Φ0 be the fluence at 1 m away from the target. For simplicity, let r = SID1 and Δ be the separation between two layers. Note is small, then the averaged fluence from four layers can be approximated as:
At SIDeq, the fluence is:
References
- 1.Yu CX. Intensity-modulated arc therapy with dynamic multileaf collimation: an alternative to tomotherapy. Phys Med Biol. 1995;40(9):1435. doi: 10.1088/0031-9155/40/9/004. [DOI] [PubMed] [Google Scholar]
- 2.I.M.R.T.C.W. Group. Intensity-modulated radiotherapy: current status and issues of interest. Int J Radiat Oncol. 2001;51(4):880–914. doi: 10.1016/s0360-3016(01)01749-7. [DOI] [PubMed] [Google Scholar]
- 3.Otto Karl. Volumetric modulated arc therapy: IMRT in a single gantry arc. Med Phys. 2008;35(1):310–317. doi: 10.1118/1.2818738. [DOI] [PubMed] [Google Scholar]
- 4.Teoh M, Clark CH, Wood K, Whitaker S, Nisbet A. Volumetric modulated arc therapy: a review of current literature and clinical use in practice. Br J Radiol. 2011;84(1007):967–996. doi: 10.1259/bjr/22373346. [DOI] [PMC free article] [PubMed] [Google Scholar]
- 5.Sapkaroski Daniel, Osborne C, Knight KA. A review of stereotactic body radiotherapy - is volumetric modulated arc therapy the answer? J Med Radiat Sci. 2015;62(2):142–151. doi: 10.1002/jmrs.108. [DOI] [PMC free article] [PubMed] [Google Scholar]
- 6.Infusino E. Clinical utility of RapidArc™ radiotherapy technology. Cancer Manag Res. 2015;7:345–356. doi: 10.2147/CMAR.S72775. [DOI] [PMC free article] [PubMed] [Google Scholar]
- 7.Hong TS, Tomé WA, Chappell RJ, Chinnaiyan P, Mehta MP, Harari PM. The impact of daily setup variations on head-and-neck intensity-modulated radiation therapy. Int J Radiat Oncol Biol Phys. 2005;61(3):779–788. doi: 10.1016/j.ijrobp.2004.07.696. [DOI] [PubMed] [Google Scholar]
- 8.Ruan D, Kupelian P, Low DA. Image-guided positioning and tracking. Cancer J Sudbury Mass. 2011;17(3):155–158. doi: 10.1097/PPO.0b013e318221ad69. [DOI] [PubMed] [Google Scholar]
- 9.Han C, Schiffner DC, Schultheiss TE, Chen Y-J, Liu A, Wong JYC. Residual setup errors and dose variations with less-than-daily image guided patient setup in external beam radiotherapy for esophageal cancer. Radiother Oncol. 2012;102(2):309–314. doi: 10.1016/j.radonc.2011.07.027. [DOI] [PubMed] [Google Scholar]
- 10.Lewis DG, Swindell W, Morton EJ, Evans PM, Xiao ZR. A megavoltage CT scanner for radiotherapy verification. Phys Med Biol. 1992;37(10):1985. doi: 10.1088/0031-9155/37/10/013. [DOI] [PubMed] [Google Scholar]
- 11.Midgley S, Millar RM, Dudson J. A feasibility study for megavoltage cone beam CT using a commercial EPID. Phys Med Biol. 1998;43(1):155. doi: 10.1088/0031-9155/43/1/010. [DOI] [PubMed] [Google Scholar]
- 12.Morin O, et al. Megavoltage cone-beam CT: System description and clinical applications. Med Dosim. 2006;31(1):51–61. doi: 10.1016/j.meddos.2005.12.009. [DOI] [PubMed] [Google Scholar]
- 13.Markwell T, Perera L, Trapp J, Fielding A. Evaluation of MegaVoltage Cone Beam CT image quality with an unmodified Elekta Precise Linac and EPID: a feasibility study. Australas Phys Eng Sci Med Support Australas Coll Phys Sci Med Australas Assoc Phys Sci Med. 2014;37(2):291–302. doi: 10.1007/s13246-014-0258-9. [DOI] [PubMed] [Google Scholar]
- 14.Meeks SL, H JF, Jr, Langen KM, Willoughby TR, Wagner TH, Kupelian PA. Performance characterization of megavoltage computed tomography imaging on a helical tomotherapy unit. Med Phys. 2005;32(8):2673–2681. doi: 10.1118/1.1990289. [DOI] [PubMed] [Google Scholar]
- 15.Langen KM, Meeks SL, Pouliot J. Quality Assurance of Onboard Megavoltage Computed Tomography Imaging and Target Localization Systems for On- and Off-Line Image-Guided Radiotherapy. Int J Radiat Oncol. 2008;71(1):S62–S65. doi: 10.1016/j.ijrobp.2007.04.094. [DOI] [PubMed] [Google Scholar]
- 16.Abou-Elenein HS, Attalla EM, Ammar H, Eldesoky I, Farouk M, Zaghloul MS. Megavoltage cone beam computed tomography: Commissioning and evaluation of patient dose. J Med Phys Assoc Med Phys India. 2011;36(4):205–212. doi: 10.4103/0971-6203.89969. [DOI] [PMC free article] [PubMed] [Google Scholar]
- 17.Sumida I, et al. Evaluation of imaging performance of megavoltage cone-beam CT over an extended period. J Radiat Res (Tokyo) 2014;55(1):191–199. doi: 10.1093/jrr/rrt100. [DOI] [PMC free article] [PubMed] [Google Scholar]
- 18.Pouliot J, et al. Low-dose megavoltage cone-beam CT for radiation therapy. Int J Radiat Oncol. 2005;61(2):552–560. doi: 10.1016/j.ijrobp.2004.10.011. [DOI] [PubMed] [Google Scholar]
- 19.Morin O, et al. Dose calculation using megavoltage cone-beam CT. Int J Radiat Oncol. 2007;67(4):1201–1210. doi: 10.1016/j.ijrobp.2006.10.048. [DOI] [PubMed] [Google Scholar]
- 20.Petit SF, van Elmpt WJC, Nijsten SMJJG, Lambin P, Dekker ALAJ. Calibration of megavoltage cone-beam CT for radiotherapy dose calculations: Correction of cupping artifacts and conversion of CT numbers to electron density. Med Phys. 2008;35(3):849–865. doi: 10.1118/1.2836945. [DOI] [PubMed] [Google Scholar]
- 21.Petit SF, van Elmpt WJC, Lambin P, Dekker ALAJ. Dose recalculation in megavoltage cone-beam CT for treatment evaluation: Removal of cupping and truncation artefacts in scans of the thorax and abdomen. Radiother Oncol. 2010;94(3):359–366. doi: 10.1016/j.radonc.2009.12.001. [DOI] [PubMed] [Google Scholar]
- 22.Bryant JH, Rottmann J, Lewis JH, Mishra P, Keall PJ, Berbeco RI. Registration of clinical volumes to beams-eye-view images for real-time tracking. Med Phys. 2014;41(12):121703. doi: 10.1118/1.4900603. [DOI] [PMC free article] [PubMed] [Google Scholar]
- 23.Kausch C, Schreiber B, Kreuder F, Schmidt R, Dössel O. Monte Carlo simulations of the imaging performance of metal plate/phosphor screens used in radiotherapy. Med Phys. 1999;26(10):2113–2124. doi: 10.1118/1.598727. [DOI] [PubMed] [Google Scholar]
- 24.Morin O, et al. Physical performance and image optimization of megavoltage cone-beam CT. Med Phys. 2009;36(4):1421–1432. doi: 10.1118/1.3096706. [DOI] [PubMed] [Google Scholar]
- 25.Dzierma D rer nat Y, Ames E, Nuesken D rer nat F, Palm D med J, Licht D rer nat N, Rübe PD med C. Image quality and dose distributions of three linac-based imaging modalities. Strahlenther Onkol. 2014:1–10. doi: 10.1007/s00066-014-0798-7. [DOI] [PubMed] [Google Scholar]
- 26.Sillanpaa J, et al. Developments in megavoltage cone beam CT with an amorphous silicon EPID: Reduction of exposure and synchronization with respiratory gating. Med Phys. 2005;32(3):819–829. doi: 10.1118/1.1861522. [DOI] [PubMed] [Google Scholar]
- 27.Chang J, et al. Integrating respiratory gating into a megavoltage cone-beam CT system. Med Phys. 2006;33(7):2354–2361. doi: 10.1118/1.2207136. [DOI] [PubMed] [Google Scholar]
- 28.Faddegon BA, Wu V, Pouliot J, Gangadharan B, Bani-Hashemi A. Low dose megavoltage cone beam computed tomography with an unflattened 4 MV beam from a carbon target. Med Phys. 2008;35(12):5777–5786. doi: 10.1118/1.3013571. [DOI] [PubMed] [Google Scholar]
- 29.Faddegon BA, et al. Comparison of patient megavoltage cone beam CT images acquired with an unflattened beam from a carbon target and a flattened treatment beama) Med Phys. 2010;37(4):1737–1741. doi: 10.1118/1.3359822. [DOI] [PubMed] [Google Scholar]
- 30.Star-Lack J, et al. A piecewise-focused high DQE detector for MV imaging. Med Phys. 2015;42(9):5084–5099. doi: 10.1118/1.4927786. [DOI] [PMC free article] [PubMed] [Google Scholar]
- 31.Wang Y, Antonuk LE, Zhao Q, El-Mohri Y, Perna L. High-DQE EPIDs based on thick, segmented BGO and CsI:Tl scintillators: Performance evaluation at extremely low dose. Med Phys. 2009;36(12):5707–5718. doi: 10.1118/1.3259721. [DOI] [PMC free article] [PubMed] [Google Scholar]
- 32.El-Mohri Y, Antonuk LE, Zhao Q, Choroszucha RB, Jiang H, Liu L. Low-dose megavoltage cone-beam CT imaging using thick, segmented scintillators. Phys Med Biol. 2011;56(6):1509. doi: 10.1088/0031-9155/56/6/001. [DOI] [PMC free article] [PubMed] [Google Scholar]
- 33.Kirvan PF, Monajemi TT, Fallone BG, Rathee S. Performance characterization of a MVCT scanner using multislice thick, segmented cadmium tungstate-photodiode detectors. Med Phys. 2010;37(1):249–257. doi: 10.1118/1.3273032. [DOI] [PubMed] [Google Scholar]
- 34.Rottmann J, et al. TH-EF-BRB-01: JUNIOR INVESTIGATOR WINNER — Novel EPID for Enhanced Contrast and Detective Quantum Efficiency. Med Phys. 2015;42(6):3742–3742. [Google Scholar]
- 35.Rottmann J, Morf D, Fueglistaller R, Zentai G, Star-Lack J, Berbeco R. A novel EPID design for enhanced contrast and detective quantum efficiency. Phys Med Biol. 2016;61(17):6297. doi: 10.1088/0031-9155/61/17/6297. [DOI] [PMC free article] [PubMed] [Google Scholar]
- 36.Tsai RY, Huang TS. Adv Comput Vis Image Process. JAI Press Inc; 1984. Multiframe image restoration and registration; pp. 317–339. [Google Scholar]
- 37.Chaudhuri S. Super-Resolution Imaging. Kluwer Academic Publishers; New York, Boston, Dordrecht, London, Moscow: 2002. [Google Scholar]
- 38.Babu RS, Murthy KS. A survey on the methods of super-resolution image reconstruction. Int J Comput Appl. 2011;15(2):1. [Google Scholar]
- 39.Park SC, Park MK, Kang MG. Super-resolution image reconstruction: a technical overview. IEEE Signal Process Mag. 2003;20(3):21–36. [Google Scholar]
- 40.Borman S, Stevenson RL. Circuits Syst Midwest Symp On. IEEE Computer Society; Los Alamitos, CA, USA: 1998. Super-Resolution from Image Sequences - A Review; p. 374. [Google Scholar]
- 41.Flohr TG, Stierstorfer K, Ulzheimer S, Bruder H, Primak AN, McCollough CH. Image reconstruction and image quality evaluation for a 64-slice CT scanner with z-flying focal spot. Med Phys. 2005;32(8):2536–2547. doi: 10.1118/1.1949787. [DOI] [PubMed] [Google Scholar]
- 42.Kyriakou Y, Kachelrieβ M, Knaup M, Krause JU, Kalender WA. Impact of the z-flying focal spot on resolution and artifact behavior for a 64-slice spiral CT scanner. Eur Radiol. 2006;16(6):1206–1215. doi: 10.1007/s00330-005-0118-9. [DOI] [PubMed] [Google Scholar]
- 43.Kachelriess M, Knaup M, Penssel C, Kalender WA. Flying focal spot (FFS) in cone-beam CT. IEEE Trans Nucl Sci. 2006;53(3):1238–1247. [Google Scholar]
- 44.Rit S, Oliva MV, Brousmiche S, Labarbe R, Sarrut D, Sharp GC. The Reconstruction Toolkit (RTK), an open-source cone-beam CT reconstruction toolkit based on the Insight Toolkit (ITK) J Phys Conf Ser. 2014;489(1):12079. [Google Scholar]
- 45.Orieux F, Giovannelli J-F, Rodet T. Bayesian estimation of regularization and point spread function parameters for Wiener–Hunt deconvolution. J Opt Soc Am. 2010;A 27(7):1593. doi: 10.1364/JOSAA.27.001593. [DOI] [PubMed] [Google Scholar]
- 46.Feldkamp LA, Davis LC, Kress JW. Practical Cone-beam Algorithm. J Opt Soc Am. 1984;1(6):612–619. [Google Scholar]
- 47.Traub RJ, Olsen PC, McDonald JC. The radiological properties of a novel lung tissue substitute. Radiat Prot Dosimetry. 2006;121(2):202–207. doi: 10.1093/rpd/nci371. [DOI] [PubMed] [Google Scholar]
- 48.Suplee C. X-Ray Mass Attenuation Coefficients. NIST; 2009. https://www.nist.gov/pml/x-ray-mass-attenuation-coefficients. [Google Scholar]
- 49.Bushberg Jerrold T, Seibert AJ, Leidholdt EM, Boone JM. The essential physics of medical imaging. 3rd. Lippincott Williams & Wilkins; Philadelphia, PA: 2012. [Google Scholar]
- 50.Hardie RC, Barnard KJ, Armstrong EE. Joint MAP registration and high-resolution image estimation using a sequence of undersampled images. IEEE Trans Image Process. 1997;6(12):1621–1633. doi: 10.1109/83.650116. [DOI] [PubMed] [Google Scholar]
- 51.Iterative-Interpolation Super-Resolution Image Reconstruction | Vivek Bannore |. Springer; 2016. [Google Scholar]
- 52.Yip S, et al. TH-EF-BRB-02: Combination of Multiple EPID Imager Layers Improves Image Quality and Tracking Performance of Low Contrast Objects. Med Phys. 2015;42(6):3742–3742. doi: 10.1002/mp.12422. [DOI] [PubMed] [Google Scholar]


