

Abstract
Inertial measurement units (IMUs) are small wearable sensors that have tremendous potential to be applied to clinical gait analysis. They allow objective evaluation of gait and movement disorders outside the clinic and research laboratory, and permit evaluation on large numbers of steps. However, repeatability and validity data of these systems are sparse for gait metrics. The purpose of this study was to determine the validity and between-day repeatability of spatiotemporal metrics (gait speed, stance percent, swing percent, gait cycle time, stride length, cadence, and step duration) as measured with the APDM Opal IMUs and Mobility Lab system. We collected data on 39 healthy subjects. Subjects were tested over two days while walking on a standard treadmill, split-belt treadmill, or overground, with IMUs placed in two locations: both feet and both ankles. The spatiotemporal measurements taken with the IMU system were validated against data from an instrumented treadmill, or using standard clinical procedures. Repeatability and minimally detectable change (MDC) of the system was calculated between days. IMUs displayed high to moderate validity when measuring most of the gait metrics tested. Additionally, these measurements appear to be repeatable when used on the treadmill and overground. The foot configuration of the IMUs appeared to better measure gait parameters; however, both the foot and ankle configurations demonstrated good repeatability. In conclusion, the IMU system in this study appears to be both accurate and repeatable for measuring spatiotemporal gait parameters in healthy young adults.
Keywords: Inertial sensors, Biomechanics, Gait detection, Accuracy, Wearable, Wearable devices
Introduction
Individuals with gait disorders exhibit a wide range of spatiotemporal abnormalities. Understanding these gait abnormalities is critical for therapeutic planning, management, and clinical-decision making. In the clinical setting, therapists often evaluate gait and mobility using visual observation, questionnaires, or functional assessments to determine abnormalities in spatiotemporal parameters (e.g., cadence, stance time, step length, and stride length, etc.) [1]. While these methods of gait and mobility assessments are simple and do not require sophisticated instruments, they are often qualitative and are prone to evaluator bias. Further, they are dependent on the experience of the evaluator and often lack inter-rater reliability [2–5]. Alternative, objective assessments are critical for accurate documentation of patient progress and are increasingly sought by third-party payers.
There are several technological approaches to quantitative gait assessment, with three-dimensional (3-D) motion capture systems and force plates considered the “gold standard”. However, these instruments are expensive to acquire and operate, reducing their feasibility for clinical use. There are several low-cost instruments as well, such as Kinect [6], Wii fit and even webcams [7], which are appealing for clinicians to perform quantitative assessments. However, all these technologies (including the high-end 3-D camera and Gait Mat systems) are restricted to a small capture volume, and only few steps are available for data analysis. The invention of inertial measurement unit (IMU) for spatiotemporal and kinematic assessments was a major technological advancement in the field of biomechanics and wearable sensors, as they are relatively inexpensive, allow a virtually unlimited number of steps to be evaluated, and provide the ability to evaluate gait and movement disorders outside the constrained environments of the clinic and research laboratory.
Several proprietary IMU-based gait and mobility assessment units have been developed in recent years, but only a few are tailored toward clinical assessment needs. The APDM sensors are one such product, which allows clinicians to perform unobtrusive gait assessments in a simple and quick manner [8]. The APDM IMUs are wristwatch sized wireless devices that capture and store 3-D linear acceleration, angular velocity, and magnetic field (for directional orientation) using onboard accelerometers, gyroscopes, and magnetometers, respectively. These data can be analyzed for gait parameters (stride length, velocity, cadence, stance and swing time, etc.) using Mobility Lab software. Their system allows for two sensor configurations when measuring gait: placing sensors at either the ankle or the foot. With sensors at the ankle, the system utilizes the angular velocity of the shank to determine timing of mid-swing, initial contact, and toe-off, and combines these timing signals with a kinematic model of the lower body to estimate cadence and stride length [9]. With sensors on the foot, the system utilizes all the inertial measurements to reconstruct the 3-D kinematic trajectory of the foot. This approach uses numerical integration of angular velocity to determine the orientation of the sensor, and constrained double-integration of the accelerometer signal (rotated into the world reference frame) to estimate the sensor’s displacement. Kinematic measurements are computed directly from foot position at different times in the gait cycle [10]. These two sensor placements have different strengths and weaknesses, such as improved wearability with ankle placement, vs. increased data richness with foot placement.
Several clinicians and researchers use the APDM devices and analysis throughout the United States and elsewhere; however, repeatability and validity data are sparse for gait metrics. This information is critical as it could significantly affect the clinical-decision making process and the validity of research outcomes. Moreover, it would ease the transition for clinicians to start using this new technology in their practice. Therefore, the primary purpose of this study was to determine the validity and between-day repeatability of spatiotemporal metrics recorded by these sensors in healthy individuals.
Methods
Participants and Procedures
A total of 39 subjects (25 males, 14 females, age 23.8±6.2 years, weight 73.4±16.1 kg, height 176.6±10.3 cm, BMI 23.4±3.9) with no signs of neurological or orthopedic impairment participated in the study. Exclusion criteria included: recent major ligament injury, surgery, fracture or muscle injury in the lower limb, abnormal gait pattern, contraindication to exercise, or other health conditions that would adversely impact the outcomes of the study. The protocol for this study was approved by the Institutional Review Board of the University of Michigan and all participants signed an informed consent before participating.
Experimental Setup and Protocols
Accuracy and repeatability of APDM measurements (Mobility Lab v1, APDM, Inc., Portland, OR) obtained via their Opal sensors were tested during standard treadmill, split-belt treadmill, and overground walking. The normal treadmill condition was utilized to minimize biological variability in human walking between days [11], and the split-belt condition was used to test controlled asymmetric walking. For each condition, IMUs were secured to both the ankles and dorsum of the feet in order to test the validity and repeatability of gait parameters as measured with the two different algorithms (Figure 1).
Figure 1.
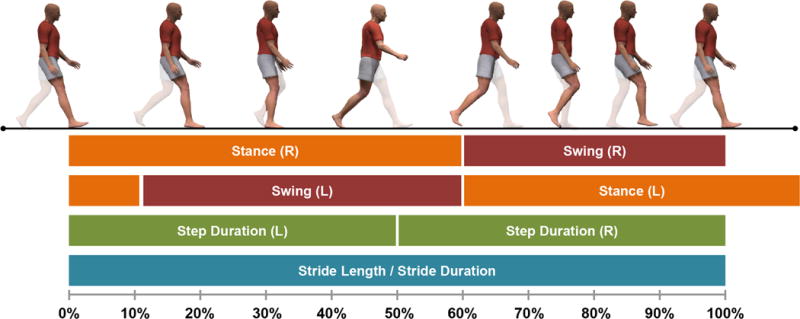
Schematic of the human gait cycle and the spatiotemporal parameters validated in this study. Specifically, we validated the IMU system’s ability to measure the stance percent, swing percent, stride duration (gait cycle time), stride length, and step duration in addition to the speed and cadence of the cycle.
Treadmill Condition
Twenty-five healthy participants visited the laboratory for IMU validation testing while walking on either a conventional single belt treadmill (n=14) (Woodway USA, Waukesha, WI) or an instrumented split-belt treadmill (n=11) (Bertec, Columbus, OH) with the belts in a “tied” configuration. Following a brief warm-up, subjects walked on the treadmill at 0.45, 0.67, 0.89, 1.12, 1.34, 1.56, and 1.79 m/s for one minute at each speed. Subjects were given approximately 30 seconds to equilibrate at each speed. The order of speeds was pseudo-randomized for the first testing session (beginning at 0.89 and ending at 0.45 m/s). In order to measure repeatability of the IMUs, 19 subjects returned for a second day of testing. The protocol remained identical to the first day and the order of the trials was preserved.
Split-belt Condition
We validated how well the IMUs measure controlled gait asymmetries by having subjects (n=11) walk on the instrumented treadmill with the belts in a “split” configuration (i.e., belts moving at different speeds). Subjects performed four trials where the treadmill belt of the right leg was set to constantly move at 1.5 m/s while the belt for the left leg moved at 0.50, 0.75, 1.0, and 1.25 m/s; this order was preserved for all subjects. Repeatability was not performed for this condition, since split-belt walking is a known adaptation paradigm and therefore, not repeatable [12].
Overground Condition
Fourteen subjects performed several trials of timed 10-meter walk test (10MWT)—a procedure administered routinely in clinic—while wearing the IMUs. The 10MWT was administered by having subjects walk on a 12-meter straight walkway, while a stopwatch was used to time the intermediate 10-meter walk (subjects were given one meter to accelerate and decelerate). Since the mobility lab system removes the first and last strides of a test, the APDM system and 10MWT were both estimating steady-state speeds. We used a hand timed 10MWT instead of automatic timers (e.g., instrumented walkway, infrared timing gates, etc.) because we wanted to provide validation of the sensors in reference to a gait test that is clinically used. However, we note that stopwatch measurements provide similar results to instrumented automatic timers [13].
Subjects first performed the 10MWT three times at their self-paced speed and the average of the three trials was used in the analysis. In order to validate the IMUs ability to measure various speeds overground, we then had subjects walk at slower and faster speeds by having them match a metronome that altered their gait cycle time (and in consequence, speed) (10% and 20% decrease/increase). All subjects returned for a second day of testing to determine repeatability at their self-paced speed.
Data Analysis
Spatiotemporal gait parameters from the IMU sensors were extracted using APDM’s mobility lab software (Version 1). Gait parameters from the instrumented force plate treadmill were computed using previously established procedures in the literature. Gait events were detected using vertical ground reaction force from the force plates on the treadmill (20N cutoff threshold) [14,15]. Stance and swing percent and gait cycle time were then computed using the gait events. Cadence was measured by computing the total number of steps per minute. Stride length was computed using procedures described previously [16,17].
Statistical Analysis
All data analyses were performed in SPSS for windows version 22 (SPSS Inc., Chicago, IL, USA) and R statistical software (version 3.1.3). IMU measurements collected during the treadmill, split belt treadmill, and overground conditions were validated against the data collected from either the treadmill (speed), the force plates on the split belt treadmill (stance percent, swing percent, gait cycle time, stride length, and cadence), or the 10MWT (overground speed), respectively; these metrics were taken to be either gold or clinical standards. We performed multiple statistics, some of which may seem redundant, in order to provide a complete representation of the system’s validity and repeatability. Lin’s concordance correlation coefficients (LCC - an index of how a new test reproduces a “gold standard” test) were used to validate the IMU data obtained using the ankle and foot configuration. LCC is a conservative measure that operates with relatively few assumptions compared to other methods. Thus, LCC would capture any subtle deviations in agreement between the measured variables and the reference criteria. It was computed using an SPSS macro that is available online (http://gjyp.nl/marta/). Pearson’s correlation coefficients (r) were used to measure the linear strength of association between the IMU data and the data obtained from the treadmill or stopwatch. Pearson’s correlations are a poor indicator of validity since they do not account for absolute agreement, but they indicate if measurements can be fixed with recalibration (i.e., if a variable has a high Pearson’s correlation, a scaling or offset can be applied to allow absolute agreement). Bland-Altman plots [18] were also created using a customized Matlab GUI (downloadable at http://neurro-lab.engin.umich.edu/downloads) for all validation measures to visually display any systematic errors in the IMU measurements.
To determine repeatability of the IMU system measurements, we calculated LCC, Pearson’s correlations (r), intraclass correlations [ICC(3,1)], and minimally detectable change (MDC) for both ankle and foot configurations for the treadmill and overground conditions between the two testing days. Although ICC(3,1) is a similar statistic to LCC (LCC operates on fewer assumptions), it was included in the analysis since it is a popular statistic in repeatability literature and is needed to calculate MDC. MDC scores were calculated using equations 1 and 2 [19–21].
| (1) |
| (2) |
Where SEM is the standard error of measurement and SD is the standard deviation of the measure. Using these statistics, we calculated repeatability of the measured speed, stance percent, swing percent, gait cycle time, stride length, cadence, and step duration as measured with the IMUs between the two days.
Results
Descriptive statistics (average, standard deviation, and range) for all spatiotemporal gait parameters are provided in supplementary tables 1–3. We have provided many reliability and validation metrics, some of which are redundant, in order to provide a complete picture of the system’s operation. When interpreting the data, we placed most weight on the more conservative LCC and utilized the following criteria to determine strength of agreement for all statistics: Excellent (0.75 – 1.00), Good (0.60 – 0.74), Fair (0.40 – 0.59), and Poor (< 0.40) [22].
Treadmill Condition
Validity of treadmill walking is reported in table 1 (n=25 for gait speed and n=11 for all other variables). Bland-Altman plots showing validity of the IMU foot and ankle measurements are shown in figure 2A and 2D and supplemental figures 1 and 2. Measurements taken from IMUs located on the feet showed excellent validity when measuring speed, gait cycle time, stride length, and cadence (LCC>0.99). The foot configuration showed fair validity when measuring the percentage of the gait cycle spent in the stance and swing phase (LCC=0.50), but Pearson’s correlations, which are more forgiving when data diverge from absolute agreement, for these measures were higher (r>0.95). The ankle configuration demonstrated excellent validity when measuring gait speed, gait cycle time and cadence (LCC>0.93), but was less accurate when measuring stance and swing percent (LCC=0.76) or stride length (LCC=0.61).
Table 1.
Validity and repeatability of the IMU system while walking on a treadmill
| Validity | LCC | r | ICC(3,1) | MDC | |
|---|---|---|---|---|---|
| Foot | Gait Speed | 0.99 | 0.99 | ||
| Stride Length | 0.99 | 0.99 | |||
| Cadence | 0.99 | 0.99 | |||
| Gait Cycle Time | 0.99 | 0.99 | |||
| Stance Percent | 0.50 | 0.95 | |||
| Swing Percent | 0.50 | 0.95 | |||
|
| |||||
| Ankle | Gait Speed | 0.93 | 0.98 | ||
| Stride Length | 0.61 | 0.89 | |||
| Cadence | 0.99 | 0.99 | |||
| Gait Cycle Time | 0.99 | 0.99 | |||
| Stance Percent | 0.76 | 0.95 | |||
| Swing Percent | 0.76 | 0.95 | |||
|
| |||||
| Repeatability | |||||
|
| |||||
| Foot | Gait Speed | 0.99 | 0.99 | 0.99 | 0.07 |
| Stride Length | 0.99 | 0.99 | 0.99 | 0.10 | |
| Cadence | 0.99 | 0.99 | 0.99 | 3.30 | |
| Gait Cycle Time | 0.99 | 0.99 | 0.99 | 0.12 | |
| Stance Percent | 0.97 | 0.97 | 0.97 | 1.65 | |
| Swing Percent | 0.97 | 0.97 | 0.97 | 1.65 | |
| Step Duration | 0.99 | 0.99 | 0.99 | 0.06 | |
|
| |||||
| Ankle | Gait Speed | 0.99 | 0.99 | 0.99 | 0.08 |
| Stride Length | 0.97 | 0.97 | 0.97 | 0.08 | |
| Cadence | 0.99 | 0.99 | 0.99 | 6.12 | |
| Gait Cycle Time | 0.99 | 0.99 | 0.99 | 0.12 | |
| Stance Percent | 0.92 | 0.92 | 0.92 | 3.38 | |
| Swing Percent | 0.92 | 0.92 | 0.92 | 3.38 | |
|
| |||||
| Treadmill | Stride Length | 0.99 | 0.99 | 0.99 | 0.07 |
| Cadence | 0.99 | 0.99 | 0.99 | 5.08 | |
| Gait Cycle Time | 0.99 | 0.99 | 0.99 | 0.09 | |
| Stance Percent | 0.98 | 0.98 | 0.98 | 1.39 | |
| Swing Percent | 0.98 | 0.98 | 0.98 | 1.39 | |
Sample sizes: validity [Gait Speed (n = 25); all other variables (n = 11)]; Repeatability [Foot and Ankle (n = 19); Treadmill (n = 5)]. Abbreviations: LCC (Lin’s concordance correlation coefficient), r (Pearson’s correlation), α (Cronbach’s alpha), ICC (intraclass correlation); Units for MDC: Gait Speed (m/s), Stride Length (m), Cadence (steps/min), Gait Cycle Time (s), Step Duration (s).
Figure 2.
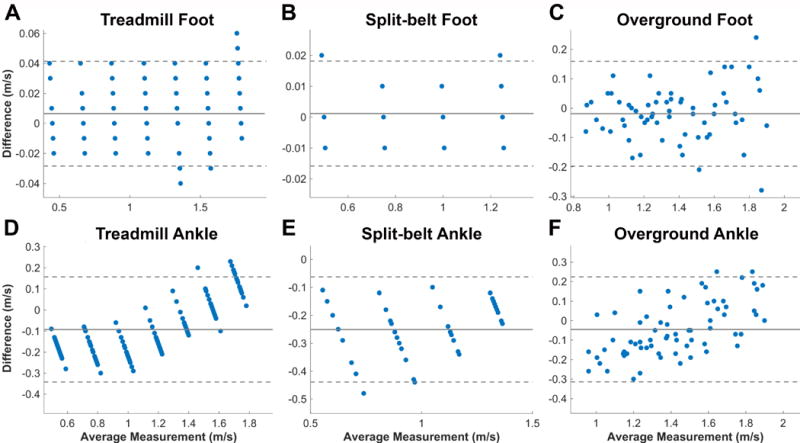
Bland-Altman plots for validity of both foot and ankle configurations during treadmill, split-belt, and overground walking conditions. The plots show the validity of gait speed as measured with the IMUs against the speed measured with the treadmills and ten meter walk test for each subject and speed. The Y-axis of the plot corresponds to the difference between the two measurement systems, while the X-axis is the average of the two measurements. Solid lines mark the average difference for the whole sample, while the dashed lines correspond to the 95% limits of agreement. Sample size: Treadmill (n = 25); Split-belt (n = 11); Overground (n = 14).
We also report repeatability in table 1 (n=19). Both foot and ankle configurations demonstrated excellent repeatability when measured over the treadmill (0.92<LCC<0.99). This was also the case when using other repeatability metrics (0.92<r<0.99 and 0.92<ICC(3,1)<0.99).
Split-belt Condition
Validity data for the left, slower moving leg in the presence of an asymmetry, using the foot and ankle configurations are shown in table 2 (n=11). Bland-Altman plots showing validity of the IMU foot and ankle measurements are shown in figures 2B and 2E and supplemental figures 3 and 4. Once again, the foot configuration showed excellent validity while walking with asymmetry on the split-belt treadmill for gait speed, gait cycle time, stride length, and cadence (LCC>0.99). But the foot configuration showed only fair validity when measuring the percentage of the gait cycle spent in the stance and swing phase (LCC=0.70), while Pearson’s correlations for these measures remained higher (r=0.97). Validity of the ankle configuration was excellent when measuring gait cycle time and cadence (LCC>0.99), but was less accurate when measuring gait speed, stride length, stance percent, and swing percent (0.53<LCC<0.77). However, Pearson’s correlations remained high (0.93<r<0.99) for all of these measures.
Table 2.
Validity of the IMU system during split-belt condition
| Validity | LCC | r | |
|---|---|---|---|
| Foot | Gait Speed | 0.99 | 0.99 |
| Stride Length | 0.99 | 0.99 | |
| Cadence | 0.99 | 0.99 | |
| Gait Cycle Time | 0.99 | 0.99 | |
| Stance Percent | 0.70 | 0.97 | |
| Swing Percent | 0.70 | 0.97 | |
|
| |||
| Ankle | Gait Speed | 0.64 | 0.94 |
| Stride Length | 0.53 | 0.93 | |
| Cadence | 0.99 | 0.99 | |
| Gait Cycle Time | 0.99 | 0.99 | |
| Stance Percent | 0.77 | 0.95 | |
| Swing Percent | 0.77 | 0.95 | |
Sample size: validity (n = 11). Abbreviations: LCC (Lin’s concordance correlation coefficient), r (Pearson’s correlation)
Overground
Validity and repeatability of the IMU measurements during the overground condition in healthy subjects are provided in table 3 (n=14). Bland-Altman plots showing validity of the IMU foot and ankle measurements are shown in figure 2C and 2F. There was excellent strength-of-agreement when validating speed with the foot IMU configuration (LCC=0.95) against the average speed collected with the 10MWT. However, the ankle configuration was less effective at measuring speed (LCC=0.86). The Pearson’s correlation was slightly higher than LCC for ankle speed validity (r=0.91).
Table 3.
Validity and repeatability of the IMU system while walking overground.
| Validity | LCC | r | ICC(3,1) | MDC | |
|---|---|---|---|---|---|
| Foot | Gait Speed | 0.95 | 0.95 | ||
| Ankle | Gait Speed | 0.86 | 0.91 | ||
|
| |||||
| Repeatability | |||||
|
| |||||
| Foot | Gait Speed | 0.93 | 0.95 | 0.94 | 0.12 |
| Stride Length | 0.96 | 0.97 | 0.96 | 0.11 | |
| Cadence | 0.94 | 0.95 | 0.95 | 2.72 | |
| Gait Cycle Time | 0.94 | 0.95 | 0.94 | 0.06 | |
| Stance Percent | 0.79 | 0.81 | 0.81 | 1.49 | |
| Swing Percent | 0.79 | 0.81 | 0.81 | 1.49 | |
| Step Duration | 0.96 | 0.96 | 0.96 | 0.03 | |
|
| |||||
| Ankle | Gait Speed | 0.92 | 0.94 | 0.92 | 0.09 |
| Stride Length | 0.95 | 0.95 | 0.95 | 0.07 | |
| Cadence | 0.97 | 0.98 | 0.98 | 3.65 | |
| Gait Cycle Time | 0.97 | 0.98 | 0.97 | 0.04 | |
| Stance Percentage | 0.64 | 0.65 | 0.65 | 2.82 | |
| Swing Percentage | 0.64 | 0.65 | 0.65 | 2.82 | |
|
| |||||
| 10MWT | Gait Speed | 0.91 | 0.92 | 0.92 | 0.18 |
Sample sizes: validity and repeatability (n = 14). Abbreviations: LCC (Lin’s concordance correlation coefficient), r (Pearson’s correlation), α (Cronbach’s alpha), ICC (intraclass correlation), 10MWT (ten meter walk test); Units for MDC: Speed (m/s), Stride Length (m), Cadence (steps/min), Gait Cycle Time (s), Step Duration (s).
Overground repeatability for the foot configuration was found to be excellent for measuring gait speed, stride length, cadence, gait cycle time, and step duration (LCC>0.93; Table 3). Repeatability was slightly lower when measuring stance and swing percent (LCC=0.79). In the ankle configuration, repeatability was excellent for gait speed, stride length, cadence, and gait cycle time (LCC>0.93). It was fair when measuring stance and swing percent (LCC=0.64). Other metrics of repeatability [ICC(3,1) and r] also showed similar trends. For reference, the repeatability when measuring overground gait speed using the 10MWT was 0.91 using LCC, which is consistent with the measurements from the foot and ankle.
Discussion
This study evaluated the validity and repeatability of spatiotemporal gait parameters measured with APDM’s IMUs so that clinicians and researchers can better interpret gait data obtained using this system. The findings of this study indicate that APDM’s IMU system is both accurate and repeatable for measuring many spatiotemporal gait parameters. When comparing the ankle and foot configurations, we found that the system demonstrated better validity when placed on the foot as opposed to the ankle. However, both configurations demonstrated similar repeatability regardless of testing conditions.
We intentionally chose the treadmill condition in this study design as it enabled us to tease out the true instrumentation error from the measurement error due to biological variation (i.e., natural variation in walking patterns between days) because of the fact that gait patterns are more invariant on a treadmill than overground [11,23,24]. The gait parameters from the foot configuration, except for the stance and swing percent, were highly accurate and reliable, thus indicating that the instrumentation error was minimal for most gait parameters. In contrast, the gait parameters from the ankle configuration were less accurate, indicating that this configuration suffered from substantial instrumentation error. This instrumentation error was particularly noticeable at low and high gait speeds and in the split-belt condition where subjects walked with an asymmetric gait. The nature of the error, though systematic, was nonlinear where the behavior of the error patterns changed direction with increases in gait speed — for e.g., gait speed and stride length parameters were overestimated at lower gait speeds and underestimated at higher gait speeds (Figure 2E & Supplemental Figure 2). The reliability coefficients for the ankle configuration also reduced noticeably when asymmetry was introduced. These findings indicate that clinicians and researchers should cautiously interpret the gait data obtained from the ankle configuration and should consider using the foot configuration when feasible. This is particularly relevant to the users of Mobility Lab v1 (which is the vast majority of current users), where the default option is the ankle configuration. Further, it is important to recognize that the ability to detect changes in gait speed with an intervention will be low for the ankle configuration due to the nonlinear nature of the systematic error.
The findings of this study are similar to others that have validated or examined repeatability of wearable sensors for gait. Other systems commonly detect gait by placing sensors at the lumbar [25–27] or shank [8,27,28] of the subject. Many of these systems are shown to be reasonably accurate [29,30] and repeatable (ICC ranging between 0.75 and 0.90) [31]. However, similar to this study, it has been found that gait event detection improved as the sensor was placed closer to the ground [29]. Interestingly, it appears that many systems have difficulty in detecting toe off events [27], and show poor accuracy (23–55 ms error) when reporting stance and swing times [32–35]. This is similar to the average error in detecting swing time with the foot configuration used in this study (15.21 ms) (Supplemental Table 1); however, given the high Pearson’s correlations measured with the APDM system, these errors could be partially remedied by recalibrating the toe off detection algorithm.
This study also provides MDC values for spatiotemporal gait parameters. The MDC represents the minimum amount of change that must take place for the difference to be considered “real” rather than measurement error; thus, making it particularly useful for gauging the effects of rehabilitation. It is to be noted that the MDC values computed for overground walking using IMUs are similar to or better than those established using other techniques [36,37]. However, we would like to point out that the values provided in the tables of this manuscript are to be used only when interested in determining whether an individual subject has made a noticeable improvement in their gait parameters as measured with IMUs. If MDC is being used to determine meaningful improvements in a group of subjects (e.g., after an intervention), then the MDC values must be modified to reflect the size of the group (n), as in equation 3 below [38,39].
| (3) |
Thus, the MDCgroup values for the IMU system will reduce proportionally based on the sample size used in a study.
There are some limitations to this study. First, we only evaluated gait parameters using equipment and software from APDM; however, other systems may use different algorithms to detect gait parameters [25–28,40–42] and therefore, we recommend caution when extrapolating results to systems other than APDM. Second, the software used for this study can collect many other metrics that were not used in this study, including balance, timed up and go, and multiple turning metrics [43–49]. As a result, we cannot comment on the validity and reliability of these metrics. Evaluation of these additional metrics could potentially provide greater utility of IMU sensors for research or clinical work. Finally, we did not use the latest version of the Mobility Lab software (Mobility Lab v2), as it was not available at the time when the study was performed. Hence, the performance of the newer version of the software is not clear from this study. However, we note that the newer version only uses foot configuration for gait measurements and to our knowledge there are no changes in algorithms for gait detection. Hence, we believe that the newer version should perform equally, if not superior to the current system’s foot configuration.
Conclusion
The IMU system used in this study appears to be both accurate and repeatable for measuring spatiotemporal gait parameters in healthy young adults, particularly when using the foot configuration. This held true for both treadmill and overground conditions regardless of walking asymmetries. The ICC and MDC values observed for the system are also comparable to the existing gold standard gait evaluation techniques. These findings have meaningful implications for clinicians and researchers who use IMUs for evaluating and studying gait deficits.
Supplementary Material
Highlights.
We tested the accuracy and repeatability of APDM’s Mobility Lab gait system
The system is accurate and repeatable when measuring spatiotemporal gait parameters
The system is more accurate with sensors placed at the foot rather than the ankle
The foot configuration was accurate and repeatable when measuring asymmetric gait
Acknowledgments
This work was partly supported by Grants R01-EB019834, R44-AG030815, and R43-HD074424 from the National Institutes of Health and the National Science Foundation Graduate Research Fellowship Program under Grant No. DGE #1256260. Any opinions, findings, and conclusions or recommendations expressed in this material are those of the author(s) and do not necessarily reflect the views of the funding agencies.
Footnotes
Publisher's Disclaimer: This is a PDF file of an unedited manuscript that has been accepted for publication. As a service to our customers we are providing this early version of the manuscript. The manuscript will undergo copyediting, typesetting, and review of the resulting proof before it is published in its final citable form. Please note that during the production process errors may be discovered which could affect the content, and all legal disclaimers that apply to the journal pertain.
References
- 1.Eastlack ME, Arvidson J, Snyder-Mackler L, Danoff JV, McGarvey CL. Interrater reliability of videotaped observational gait-analysis assessments. Phys Ther. 1991;71:465–472. doi: 10.2522/ptj.20140009. [DOI] [PubMed] [Google Scholar]
- 2.Ong AML, Hillman SJ, Robb JE. Reliability and validity of the Edinburgh Visual Gait Score for cerebral palsy when used by inexperienced observers. Gait Posture. 2008;28:323–326. doi: 10.1016/j.gaitpost.2008.01.008. [DOI] [PubMed] [Google Scholar]
- 3.Brunnekreef JJ, van Uden CJT, van Moorsel S, Kooloos JGM. Reliability of videotaped observational gait analysis in patients with orthopedic impairments. BMC Musculoskelet Disord. 2005;6:17. doi: 10.1186/1471-2474-6-17. [DOI] [PMC free article] [PubMed] [Google Scholar]
- 4.Viehweger E, Zürcher Pfund L, Hélix M, Rohon M-A, Jacquemier M, Scavarda D, Jouve J-L, Bollini G, Loundou A, Simeoni M-C. Influence of clinical and gait analysis experience on reliability of observational gait analysis (Edinburgh Gait Score Reliability) Ann Phys Rehabil Med. 2010;53:535–546. doi: 10.1016/j.rehab.2010.09.002. [DOI] [PubMed] [Google Scholar]
- 5.Lord SE, Halligan PW, Wade DT. Visual gait analysis: the development of a clinical assessment and scale. Clin Rehabil. 1998;12:107–119. doi: 10.1191/026921598666182531. http://www.ncbi.nlm.nih.gov/pubmed/9619652 (accessed September 27, 2016) [DOI] [PubMed] [Google Scholar]
- 6.Xu X, McGorry RW, Chou LS, Hua Lin J, Chi Chang C. Accuracy of the Microsoft Kinect™ for measuring gait parameters during treadmill walking. Gait Posture. 2015;42:145–151. doi: 10.1016/j.gaitpost.2015.05.002. [DOI] [PubMed] [Google Scholar]
- 7.Krishnan C, Washabaugh EP, Seetharaman Y. A low cost real-time motion tracking approach using webcam technology. J Biomech. 2015;48:544–548. doi: 10.1016/j.jbiomech.2014.11.048. [DOI] [PMC free article] [PubMed] [Google Scholar]
- 8.Mancini M, Horak FB. Potential of APDM mobility lab for the monitoring of the progression of Parkinson’s disease. Expert Rev Med Devices. 2016;13:455–462. doi: 10.1586/17434440.2016.1153421. [DOI] [PMC free article] [PubMed] [Google Scholar]
- 9.Salarian A, Russmann H, Vingerhoets FJG, Dehollain C, Blanc Y, Burkhard PR, Aminian K. Gait assessment in Parkinson’s disease: Toward an ambulatory system for long-term monitoring. IEEE Trans Biomed Eng. 2004;51:1434–1443. doi: 10.1109/TBME.2004.827933. [DOI] [PubMed] [Google Scholar]
- 10.Rebula JR, Ojeda LV, Adamczyk PG, Kuo AD. Measurement of foot placement and its variability with inertial sensors. Gait Posture. 2013;38:974–980. doi: 10.1016/j.gaitpost.2013.05.012. [DOI] [PMC free article] [PubMed] [Google Scholar]
- 11.Hollman JH, Watkins MK, Imhoff AC, Braun CE, Akervik KA, Ness DK. A comparison of variability in spatiotemporal gait parameters between treadmill and overground walking conditions. Gait Posture. 2016;43:204–209. doi: 10.1016/j.gaitpost.2015.09.024. [DOI] [PubMed] [Google Scholar]
- 12.Reisman DS, Wityk R, Silver K, Bastian AJ. Locomotor adaptation on a split-belt treadmill can improve walking symmetry post-stroke. Brain. 2007;130:1861–1872. doi: 10.1093/brain/awm035. [DOI] [PMC free article] [PubMed] [Google Scholar]
- 13.Peters DM, Fritz SL, Krotish DE. Assessing the reliability and validity of a shorter walk test compared with the 10-Meter Walk Test for measurements of gait speed in healthy, older adults. J Geriatr Phys Ther. 2013;36:24–30. doi: 10.1519/JPT.0b013e318248e20d. [DOI] [PubMed] [Google Scholar]
- 14.Zeni JA, Richards JG, Higginson JS. Two simple methods for determining gait events during treadmill and overground walking using kinematic data. Gait Posture. 2008;27:710–714. doi: 10.1016/j.gaitpost.2007.07.007. [DOI] [PMC free article] [PubMed] [Google Scholar]
- 15.Jordan K, Challis JH, Newell KM. Walking speed influences on gait cycle variability. Gait Posture. 2007;26:128–134. doi: 10.1016/j.gaitpost.2006.08.010. [DOI] [PubMed] [Google Scholar]
- 16.Lee SJ, Hidler J. Biomechanics of overground vs. treadmill walking in healthy individuals. J Appl Physiol. 2008;104:747–755. doi: 10.1152/japplphysiol.01380.2006. [DOI] [PubMed] [Google Scholar]
- 17.Kirtley C. Clinical Gait Analysis: Theory and Practice. Elsevier; 2005. [Google Scholar]
- 18.Bland JM, Altman DG. Comparing methods of measurement: why plotting difference against standard method is misleading. Lancet. 1995;346:1085–1087. doi: 10.1016/S0140-6736(95)91748-9. [DOI] [PubMed] [Google Scholar]
- 19.Campanini I, Merlo A. Reliabilty, smallest real difference and concurrent validity of indices computed from GRF components in gait of stroke patients. Gait Posture. 2009;30:127–131. doi: 10.1016/j.gaitpost.2009.03.011. [DOI] [PubMed] [Google Scholar]
- 20.Kesar TM, Binder-Macleod SA, Hicks GE, Reisman DS. Minimal detectable change for gait variables collected during treadmill walking in individuals post-stroke. Gait Posture. 2011;33:314–317. doi: 10.1016/j.gaitpost.2010.11.024. [DOI] [PMC free article] [PubMed] [Google Scholar]
- 21.Beckerman H, Roebroeck ME, Lankhorst GJ, Becher JG, Bezemer PD, Verbeek ALM. Smallest real difference, a link between reproducibility and responsiveness. Qual Life Res. 2001;10:571–578. doi: 10.1023/A:1013138911638. [DOI] [PubMed] [Google Scholar]
- 22.Cicchetti DV. Guidelines, criteria, and rules of thumb for evaluating normed and standardized assessment instruments in psychology. Psychol Assess. 1994;6:284–290. doi: 10.1037/1040-3590.6.4.284. [DOI] [Google Scholar]
- 23.Riley PO, Paolini G, Della Croce U, Paylo KW, Kerrigan DC. A Kinematic and Kinetic Comparison of Overground and Treadmill Walking in Healthy Subjects. Gait Posture. 2007;26:17–24. doi: 10.1016/j.gaitpost.2006.07.003. [DOI] [PubMed] [Google Scholar]
- 24.Dingwell JB, Cusumano JP, Cavanagh PR, Sternad D. Local Dynamic Stability Versus Kinematic Variability of Continuous Overground and Treadmill Walking. J Biomech Eng. 2001;123:27. doi: 10.1115/1.1336798. [DOI] [PubMed] [Google Scholar]
- 25.Zijlstra W, Hof AL. Assessment of spatio-temporal gait parameters from trunk accelerations during human walking. Gait Posture. 2003;18:1–10. doi: 10.1016/S0966-6362(02)00190-X. [DOI] [PubMed] [Google Scholar]
- 26.González RC, López AM, Rodriguez-Uría J, Álvarez D, Alvarez JC. Real-time gait event detection for normal subjects from lower trunk accelerations. Gait Posture. 2010;31:322–325. doi: 10.1016/j.gaitpost.2009.11.014. [DOI] [PubMed] [Google Scholar]
- 27.Moon Y, McGinnis RS, Seagers K, Motl RW, Sheth N, Wright JA, Ghaffari R, Sosnoff JJ. Monitoring gait in multiple sclerosis with novel wearable motion sensors. PLoS One. 2017;12:e0171346. doi: 10.1371/journal.pone.0171346. [DOI] [PMC free article] [PubMed] [Google Scholar]
- 28.Moore ST, MacDougall HG, Gracies JM, Cohen HS, Ondo WG. Long-term monitoring of gait in Parkinson’s disease. Gait Posture. 2007;26:200–207. doi: 10.1016/j.gaitpost.2006.09.011. [DOI] [PubMed] [Google Scholar]
- 29.Iosa M, Picerno P, Paolucci S, Morone G. Wearable inertial sensors for human movement analysis. Expert Rev Med Devices. 2016;4440:1–19. doi: 10.1080/17434440.2016.1198694. [DOI] [PubMed] [Google Scholar]
- 30.Dejnabadi H, Jolles BM, Aminian K. A new approach to accurate measurement of uniaxial joint angles based on a combination of accelerometers and gyroscopes. IEEE Trans Biomed Eng. 2005;52:1478–1484. doi: 10.1109/TBME.2005.851475. [DOI] [PubMed] [Google Scholar]
- 31.Henriksen M, Lund H, Moe-Nilssen R, Bliddal H, Danneskiod-Samsøe B. Test-retest reliability of trunk accelerometric gait analysis. Gait Posture. 2004;19:288–297. doi: 10.1016/S0966-6362(03)00069-9. [DOI] [PubMed] [Google Scholar]
- 32.Aminian K, Najafi B, Büla C, Leyvraz PF, Robert P. Spatio-temporal parameters of gait measured by an ambulatory system using miniature gyroscopes. J Biomech. 2002;35:689–699. doi: 10.1016/S0021-9290(02)00008-8. [DOI] [PubMed] [Google Scholar]
- 33.Lee JK, Park EJ. Quasi real-time gait event detection using shank-attached gyroscopes. Med Biol Eng Comput. 2011;49:707–712. doi: 10.1007/s11517-011-0736-0. [DOI] [PubMed] [Google Scholar]
- 34.Sabatini AM, Martelloni C, Scapellato S, Cavallo F. Assessment of walking features from foot inertial sensing. IEEE Trans Biomed Eng. 2005;52:486–494. doi: 10.1109/TBME.2004.840727. [DOI] [PubMed] [Google Scholar]
- 35.Pappas IPI, Popovic MR, Keller T, Dietz V, Morari M. A reliable gait phase detection system. IEEE Trans Neural Syst Rehabil Eng. 2001;9:113–125. doi: 10.1109/7333.928571. [DOI] [PubMed] [Google Scholar]
- 36.Fulk GD, Echternach JL. Test-retest reliability and minimal detectable change of gait speed in individuals undergoing rehabilitation after stroke. J Neurol Phys Ther. 2008;32:8–13. doi: 10.1097/NPT0b013e31816593c0. [DOI] [PubMed] [Google Scholar]
- 37.Lewek MD, Randall EP. Reliability of spatiotemporal asymmetry during overground walking for individuals following chronic stroke. J Neurol Phys Ther. 2011;35:116–121. doi: 10.1097/NPT.0b013e318227fe70. [DOI] [PubMed] [Google Scholar]
- 38.de Vet HC, Bouter LM, Bezemer PD, Beurskens AJ. Reproducibility and responsiveness of evaluative outcome measures. Theoretical considerations illustrated by an empirical example. Int J Technol Assess Health Care. 2001;17:479–487. http://www.ncbi.nlm.nih.gov/pubmed/11758292 (accessed September 27, 2016) [PubMed] [Google Scholar]
- 39.Lu WS, Wang CH, Lin JH, Sheu CF, Hsieh CL. The minimal detectable change of the simplified stroke rehabilitation assessment of movement measure. J Rehabil Med. 2008;40:615–619. doi: 10.2340/16501977-0230. [DOI] [PubMed] [Google Scholar]
- 40.Elbaz A, Mor A, Segal G, Bar D, Monda MK, Kish B, Nyska M, Palmanovich E. Lower Extremity Kinematic Profile of Gait of Patients After Ankle Fracture: A Case-Control Study. J Foot Ankle Surg. 2016;55:918–21. doi: 10.1053/j.jfas.2016.04.004. [DOI] [PubMed] [Google Scholar]
- 41.Kim M, Lee D. Development of An IMU based Foot-Ground Contact Detection (FGCD) Algorithm. Ergonomics just-accep. 2016:1–23. doi: 10.1080/00140139.2016.1174314. [DOI] [PubMed] [Google Scholar]
- 42.Kitagawa N, Ogihara N. Estimation of foot trajectory during human walking by a wearable inertial measurement unit mounted to the foot. Gait Posture. 2016;45:110–114. doi: 10.1016/j.gaitpost.2016.01.014. [DOI] [PubMed] [Google Scholar]
- 43.Coulthard JT, Treen TT, Oates AR, Lanovaz JL. Evaluation of an inertial sensor system for analysis of timed-up-and-go under dual-task demands. Gait Posture. 2015;41:882–887. doi: 10.1016/j.gaitpost.2015.03.009. [DOI] [PubMed] [Google Scholar]
- 44.Mancini M, El-Gohary M, Pearson S, Mcnames J, Schlueter H, Nutt JG, King LA, Horak FB. Continuous monitoring of turning in Parkinson’s disease: Rehabilitation potential. NeuroRehabilitation. 2015;37:3–10. doi: 10.3233/NRE-151236. [DOI] [PMC free article] [PubMed] [Google Scholar]
- 45.Spain RI, St George RJ, Salarian A, Mancini M, Wagner JM, Horak FB, Bourdette D. Body-worn motion sensors detect balance and gait deficits in people with multiple sclerosis who have normal walking speed. Gait Posture. 2012;35:573–578. doi: 10.1016/j.gaitpost.2011.11.026. [DOI] [PMC free article] [PubMed] [Google Scholar]
- 46.Mancini M, Chiari L, Holmstrom L, Salarian A, Horak FB. Validity and reliability of an IMU-based method to detect APAs prior to gait initiation. Gait Posture. 2016;43:125–131. doi: 10.1016/j.gaitpost.2015.08.015. [DOI] [PMC free article] [PubMed] [Google Scholar]
- 47.Baston C, Mancini M, Rocchi L, Horak F. Effects of Levodopa on Postural Strategies in Parkinson’s disease. Gait Posture. 2016;46:26–29. doi: 10.1016/j.gaitpost.2016.02.009. [DOI] [PMC free article] [PubMed] [Google Scholar]
- 48.Curtze C, Nutt JG, Carlson-Kuhta P, Mancini M, Horak FB. Levodopa Is a Double-Edged Sword for Balance and Gait in People With Parkinson’s Disease. Mov Disord. 2015;30:1361–1370. doi: 10.1002/mds.26269. [DOI] [PMC free article] [PubMed] [Google Scholar]
- 49.El-Gohary M, Pearson S, McNames J, Mancini M, Horak F, Mellone S, Chiari L. Continuous monitoring of turning in patients with movement disability. Sensors (Basel) 2013;14:356–369. doi: 10.3390/s140100356. [DOI] [PMC free article] [PubMed] [Google Scholar]
Associated Data
This section collects any data citations, data availability statements, or supplementary materials included in this article.