

Abstract
Cellular phenotypes are the result of complex interactions between many components. Understanding and predicting the system level properties of the resulting networks requires the development of perturbation tools that can simultaneously and independently modulate multiple cellular variables. Here, we develop synthetic modules that use different arrangements of two transcriptional regulators to achieve either concurrent and independent control of the expression of two genes, or decoupled control of the mean and variance of a single gene. These modules constitute powerful tools to probe the quantitative attributes of network wiring and function.
Keywords: noise, orthogonal, control, mating pathway, sic1
Graphical abstract
Functional outputs of cellular networks rely on intricate interactions between their component genes and proteins. A systems-level understanding of the operation of these networks requires probing the individual roles of these components and then mapping their quantitative interactions.
Assessing the roles of individual genes has traditionally relied on gene deletions, knockdowns, and overexpression. Combinatorial perturbations of mean gene expression, such as genome-wide epistasis studies based on deletions1 and knockdowns2 have led to important discoveries about the relationship between different genes and their concerted impact on functional phenotypes. These technologies are very informative about the specific arrangements of these genes with respect to each other in a network (e.g., their position in series or in parallel) and their involvement in particular biological processes (such as membership in a macromolecular complex). However, this information is often insufficient to predict how perturbations of these genes, especially concurrent perturbations, quantitatively affect network output or complex activity. To do so, technologies that provide simultaneous, graded and independent perturbations to multiple genes are needed.3,4
Methods for graded perturbations of single genes include synthetic hormone inducible transcription circuits,5–8 repurposed bacterial systems,9–12 yeast galactose-inducible promoters13 and plant-derived light-inducible transcription factors.14,15 These technologies perturb the mean expression of a gene under study and conclusions are drawn from the ensuing changes in the mean behavior of a functional phenotype.
However, single cell studies have indicated that cell-to-cell variability, or noise,16,17 in gene expression has dramatic relevance to many phenotypes in a variety of biological systems.18–23 Systematic mapping of the contribution of noise in a given gene to network function has awaited the development of perturbation methods to simultaneously and independently control the mean and variance of gene expression. Mutations in promoters24,25 and ribosome competing RNAs26 allow for modulation of noise but not independently from the mean, with low noise levels correlating with high mean expression levels.24 Strategies that achieve different noise levels for the same mean include propagating noise through transcriptional cascades.27,28 While successful, these approaches do not provide the flexibility needed to achieve the desired quantitative, predictable, tunable and dynamical noise modulation. A system with such properties has only been described in bacteria by modulating bias and frequency of a genetic switch.29
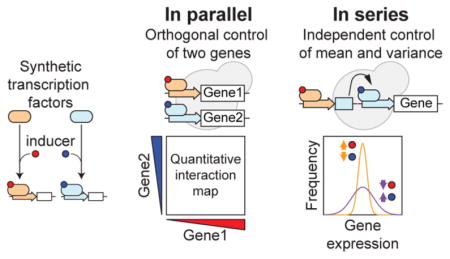
In this work, we demonstrate how different arrangements of two simple inducible synthetic Transcriptional Regulators (TRs) can address the challenges of dual gene activation, as well as mean and variance control of gene expression. Specifically, two inducible TRs arranged in parallel can drive the simultaneous and independent expression of two genes, while their arrangement in series can decouple mean and variability of a single gene in a substantial dynamic range. Together, these circuits provide a versatile and robust technology to elucidate the quantitative relationships between genes and the causal impact of their expression noise on cellular function.
RESULTS AND DISCUSSION
A 2D-Parallel Circuit Is a Quantitative Tool for Simultaneously Perturbing Two Cellular Variables
The inducible activation of human hormone receptors has been previously exploited to modulate the activity of synthetic TRs in mammalian cell lines. In these constructs, the ligand binding domain (LBD) of either the human estradiol30 or progester-one31,32 receptors (hER and hPR, respectively) is fused to the Gal4p DNA binding domain (GAL4-DBD) and to the viral VP16 activation domain. Both the apo-receptor and the ligand-bound TRs interact with Hsp90 and other auxiliary proteins, which regulate the nuclear localization and activity of the TR.33,34 In the absence of hormone, the TRs are localized in the cytoplasm. When the inducing hormone binds the LBD of one of these chimeric TRs, the complex translocates to the nucleus and controls expression from promoters containing Gal4p binding sites.6 An estradiol-responsive variant of these TRs has also been implemented in S. cerevisiae5–8 to control the galactose regulon. More recently, the Gal4p DBD was replaced by the DBD of the mouse transcription factor Zif268,35 successfully targeting the TR to only one promoter engineered to contain the corresponding binding motifs. These inducible circuits each provided quantitative graded control of the expression of one gene.
To simultaneously and independently control the expression level of two different genes, we constitutively expressed two chimeric TRs in the same cell. The first is an estradiol-responsive TR in which the GAL4-DBD is fused to the hER-LBD and the transcription factor Msn2p activation domain (MSN2-AD) (GEM, Figure 1a, upper). The second TR is a new recombinant protein consisting of the ZIF268-DBD, the hPR-LBD and the MSN2-AD (ZPM, Figure 1a, bottom). Estradiol-bound GEM translocates into the nucleus and binds and activates transcription from promoters that contain Gal4p binding sites, such as pGAL1, which contains four dimeric Gal4 binding sites.36,37 Similarly, progesterone-bound ZPM activates transcription from pZ, a modified pGAL1 promoter containing three dimeric Zif268 binding sites but lacking Gal4p binding sites35 (Figure 1b, Supporting Information).
Figure 1.

Simultaneous and independent control of gene expression using two chimeric transcriptional regulators (TRs) in parallel. (a) Scheme of two chimeric TRs constitutively expressed under the control of a crippled ADH1 promoter (pADH1(cr)). The TRs (GEM and ZPM) are a fusion of a DNA binding domain (Gal4p-DBD or Zif268-DBD, respectively), a human hormone receptor lipid binding domain (from the estradiol or progesterone receptors, hER-LBD and hPR-LBD) and a transcriptional activation domain (Msn2p-AD). (b) Representation of the action of the TRs GEM (left) and ZPM (right) in the presence of estradiol (E) or progesterone (P), respectively. (c) Diagram of the experimental setup. Two strains were cocultured, both expressing the GEM and ZPM constructs but alternatively containing the transcriptional reporters pGAL1-YFP (top) or pZ-YFP (bottom). A red-fluorescent protein was used to label the pGAL1-YFP-containing strain (top). Fluorescence, volume and cell counts were measured by automated flow cytometry. (d) Time-dependent distributions of pGAL1-YFP (red) and pZ-YFP (blue) fluorescence for different combinations of logarithmically spaced doses of estradiol and progesterone. Drug addition time is marked with black arrows. Fluorescence values are volume-corrected. (e) Steady-state dose response of the pGAL1-YFP reporter as a function of estradiol for different progesterone concentrations (shades of blue). (f) Steady-state dose response of the pZ-YFP reporter as a function of progesterone for different doses of estradiol (shades of red). In (e) and (f) pGAL1-YFP and pZ-YFP expression rates are averaged over progesterone or estradiol concentrations, respectively. The expression rates were also averaged from 3 to 12.3 h after induction.
To characterize the dynamics of this 2D-parallel circuit, we used automated high-throughput flow cytometry38 to monitor the time-resolved expression of a yellow fluorescent protein (YFP) under the transcriptional control of either pZ or pGAL1. We cocultured two strains each containing both the GEM and ZPM constructs driving YFP. We could differentiate the two cocultured strains by labeling the strain containing the pGAL1-YFP reporter with a constitutively expressed red fluorescent protein (mKate2) expressed from the TDH3 promoter (Figure 1c). In this scheme, we are able to control for well-to-well variability in hormone concentration and assess gene expression elicited by the two inducible TRs on equal footing using the same fluorescent protein.
In cultures stimulated with estradiol and progesterone, we observed exclusive and graded gene expression corresponding to action of the two TRs (Figure 1d), suggesting that there is little detectable cross-activation between the two systems. Cells containing both constructs, one driving expression of YFP and the other driving expression of mKate2 confirmed their simultaneous and independent operation (Supplementary Figure S1). Furthermore, induction of either or both TRs activity did not cause any growth defects (Supplementary Table S1).
To quantify promoter activity, we calculated the expression rate of pGAL1-YFP and pZ-YFP as the growth-corrected change in fluorescence38 (see Supplementary Methods). The steady state expression rate of pGAL1-YFP as a function of estradiol shows that GEM activity has a graded dependence on estradiol and is largely independent of progesterone at all tested concentrations (Figure 1e and Supplementary Figure S2 and S3, left panels). Likewise, pZ-YFP expression rate at steady-state has graded dependence on progesterone and slight inhibition by estradiol at very high concentrations (Figure 1f and Supplementary Figure S2 and S3, right panels), consistent with previous observations on human hormone receptors.39
Close examination of the outputs of the GEM and ZPM circuits indicated that ZPM achieves a higher steady state expression rate than GEM at saturating doses of the hormones (Figure 1e,f and Supplementary Figure S4a). Furthermore, ZPM reaches its maximal activity faster than GEM, as quantified by the time it takes to achieve half-maximum expression (Supplementary Figure S4b,c). These differences are quantitative but reproducible. In order to dissect the contribution of the different TR domains to these differences, we exchanged either the DBD or the LBD in the GEM construct. First, we replaced the GAL4-DBD with the ZIF268-DBD. This new chimeric TR (ZEM), which still responds to estradiol but now activates pZ-YFP expression, exhibited higher expression rates but similar activation times when compared to the original GEM construct (Supplementary Figure S5). Second, we replaced the hER-LBD with the hPR-LBD. This modified version of the GEM construct (GPM) is now responsive to progesterone, but activates pGAL1-YFP expression. GPM exhibited similar expression rates but faster responses when compared to the original GEM (Supplementary Figure S6). Taken together, these results suggest that the hormone-LBD pair is the major contributor to the differences in the time scale of induction, whereas the DBD-promoter pair is the major contributor to differences in maximal expression rate.
To characterize the 2D-parallel circuit under different operating conditions, we measured circuit output in three scenarios: varying cell densities, different growth media and time-varying induction levels. We found that as cell density increased over time, the expression rates of both ZPM and GEM slowly declined (Supplementary Figure S7a,b). By contrast, when we matched the culture dilution rate to that of the population proliferation rate, thereby keeping the number of cells in the culture constant, the expression rates of both constructs remained constant for hours after the addition of hormone inputs (Supplementary Figure S7c,d). In agreement, in a separate experiment, in cultures originally inoculated at different densities, GEM and ZPM also showed different expression rates for different densities, with decreasing expression with increasing density (Supplementary Figure S8). We next investigated the differential impact of growth in YPD versus minimal (SDC) media. In SDC, the 2D parallel circuit maintained inducibility and component independence, but exhibited a quantitatively different dose response than that in YPD (Supplementary Figure S9). These results highlight the quantitative dependence of this synthetic circuit on experimental conditions, a feature that is likely to hold for most synthetic constructs, therefore motivating their thorough characterizations under appropriate operating conditions for practical applications. Finally, we probed the ability of the 2D circuit to be switched off for applications that require a regulated pulse-like operation. In this experiment, we induced cultures with different estradiol and progesterone concentrations, and then washed out the hormones after 3.7 h. We observed that the expression rates for both TR systems dropped to basal levels in approximately 2 h, thereby demonstrating the reversibility of this system (Supplementary Figure S10). Taken together, these data demonstrate that the 2D-parallel circuit is tunable and reversible, as previously described for a single TR.6
To demonstrate the capabilities of the 2D-parallel circuit, we used it to quantitatively map the dose dependent genetic interactions of positive and negative regulators of an endogenous cellular pathway, the yeast pheromone mating response, a canonical GPCR-MAPK signaling cascade.40 In this pathway, the binding of pheromone to a GPCR membrane receptor is transduced to the cell through a series of phosphorylation events that ultimately activate the transcription factor Ste12p and result in the subsequent expression of various proteins required for mating. Many regulators tune the activity of this pathway in a dose dependent fashion. Positive regulators include the beta-gamma subunit of the G protein, Ste4p,41 which recruits the MAPKs to the membrane to initiate the phosphorylation cascade. Negative regulators of the pathway include the transcriptional repressor Dig1p,42 which binds and inhibits Ste12p; the dual-specificity phosphatase, Msg5p,43 which dephosphorylates and deactivates the MAPK Fus3p; and the GTP-binding alpha subunit of the G protein, Gpa1p,44 which sequesters and inhibits Ste4p (Figure 2a).
Figure 2.

A 2D-parallel circuit controlling the expression of positive and negative regulators modulates the transcriptional output of the yeast mating pathway. (a) Mating pathway signaling cascade regulators relevant to this study. A positive regulator (Ste4p) is under the control of ZPM and three negative regulators (Gpa1p, Msg5p, Dig1p) are under the control of GEM. The activity of the pathway is measured with a transcriptional reporter consisting on the AGA1 promoter driving the expression of YFP (pAGA1-YFP). (b–d) Upper panels: Schemes of the strains used in each experiment. Middle panels: Steady-state dose response of pAGA1-YFP as a function of estradiol modulating the expression of Gpa1p (b), Msg5p (c) or Dig1p (d). Different doses of progesterone (shades of blue) generate different levels of Ste4p. Fluorescence was measured after 4 h of induction and was volume-corrected. Lower panels: Mean steady-state growth rate as a function of estradiol and progesterone (shades of blue). Insets: same data as in line graphs, shown as a heat map.
We built a strain containing the ZPM TR in which progesterone induces expression of an extra copy of the STE4 gene from the pZ promoter. In the same strain, we also incorporated a GEM TR with pGAL1 driving the expression of one of the negative regulators Gpa1p, Msg5p or Dig1p (Figure 2). We modulated the expression of the positive/negative regulator pairs over a large combinatorial range by varying the concentrations of the two hormones (Supplementary Figure S11). We then measured growth rate and mating pathway activity as quantified by YFP expression rates from the Ste12p-responsive promoter of AGA1 (pAGA1-YFP45).
Estradiol-dependent induction of Ste4p results in graded activation of the mating response.46 Expression of Ste4p in our strains also induced pAGA1-YFP in a progesterone dose dependent fashion (Figure 2b,c, top panels). We could inhibit this pathway activity elicited by Ste4p overexpression through induction of the negative regulators, with quantitative effects that depended both on the identity of the regulator and the level of Ste4p expression. The two-dimensional dose responses were similar for MSG5 and GPA1 (MSG5-STE4 and GPA1-STE4), but were markedly different for DIG1 (DIG1-STE4). Specifically, Dig1p failed to efficiently overpower Ste4p positive action except at very high induction levels, whereas Msg5p and Gpa1p could exert marked inhibition at lower Ste4p levels (Figure 2b–d top panels, see for example the estradiol dose response for P = 4.44 nM).
Activation of the mating pathway slows growth through Far1p mediated cell cycle arrest.47 Therefore, increasing Ste4p expression without overexpressing any of the negative regulators caused corresponding decrease in growth rate (Figure 2b,c, bottom panels, 0 estradiol). Counterbalancing overexpression of Ste4p with overexpression of either Gpa1p or Msg5p had a favorable effect on growth, culminating in a recovery to normal growth rate at concentrations of the negative regulators that abolish signaling in the pathway as evidenced by recovery of pAGA1-YFP to prestimulus levels (Figure 2b,c, top and bottom panels, see as an example P = 10 nM and E = 100 nM). The increase in the growth rate coincided with estradiol concentrations where the negative regulators started exhibiting their inhibitory action, suggesting that growth recovery is likely resulting from decreased signaling in the mating pathway, and that lack of balanced signaling, rather than overexpression of the proteins themselves, is likely to be the major contributor to growth penalty upon overexpression of positive regulators.
Interestingly, however, expression of Gpa1p and Msg5p at concentrations below those needed to overcome Ste4 induced pathway activity seemed to reproducibly penalize growth (Figure 2b, lower panel, see for example P = 2.96 nM, E = 0–2 nM). As mentioned above, this detrimental effect on growth was reversed at supra-inhibitory Gpa1p and Msg5p levels, where growth rate now increased as a function of Gpa1p and Msg5p (Figure 2b, lower panel, see P = 2.96 nM, E > 2 nM). This nonmonotonic behavior cannot be solely attributed to generic overexpression effects of these regulators, since this overexpression in the absence of Ste4p induction does not affect growth. Also, the growth recovery phase for MSG5-STE4 occurred at higher levels of estradiol than GPA1-STE4 (Supplementary Figure S12). Finally, Dig1 overexpression did not seem to markedly affect growth. Taken together, these data suggest that intricate epistatic relationships exist between these positive and negative regulators of the mating pathway, and that quantitative mapping is needed to uncover their existence. Traditional epistatic mapping using only extreme over-expression or complete deletion would miss Gpa1p and Msg5p’s effects on growth rate as well as pathway repression by Dig1p, both of which occur at intermediate levels of Ste4p and are only observed by looking at the entire dual dose responses of Figure 2. These data suggest that the 2D-parallel circuit constitutes a useful tool to perform next generation genetic rescue experiments in which a quantitative phenotype is systematically mapped as a function of its effectors. These methods are crucial for generating a systems-level understanding of biological pathways.
A 2D-Series Circuit Is a Versatile Noise Rheostat
The 2D-parallel circuit is able to independently and simultaneously modulate the first moments, or means, of two transcriptional output distributions. We now explore whether a different configuration of the ZPM and GEM modules can be used to simultaneously control two moments (mean and variance) of the distribution of a single transcriptional output. Such a “noise rheostat” circuit would be a powerful tool for adding different amounts of noise into a cellular process and quantifying the repercussions of this noise.
We explored the behavior that would ensure from connecting the GEM and ZPM TRs in series instead of in parallel. In this circuit, the expression of ZPM is under the control of GEM and both are activated by their respective inputs (progesterone and estradiol) (Supplementary Figure S13a). Computational modeling demonstrated that this configuration allows for the same transcriptional mean output to be achieved with different combinations of GEM and ZPM activation levels (Supplementary Figure S13b and Supplementary Note). This phenomenon is mediated by the fact that this circuit effectively operates as a multiplier—at all combinatorial estradiol and progesterone concentrations, the mean output is the simple product of two doses responses, the first being the mean steady-state dose response of circuit output as a function of estradiol at saturating concentration of progesterone while the second is the mean steady-state dose response as a function of progesterone at a saturating concentration of estradiol. Modeling of this circuit also demonstrated that different combinations of estradiol and progesterone can produce the same mean output but with different variances. Specifically, for the same mean output, high upstream (GEM) activity and correspondingly low ZPM activity leads to low variability while low upstream (GEM) activity leads to larger variability. That is, the model predicted that different output noise levels could be achieved, with high output variance for low levels of estradiol and high levels of progesterone and low variance for high levels of estradiol and low levels of progesterone (Supplementary Figure S13b,c).
To experimentally implement this design and verify its predictions, we built a strain in which a constitutively expressed GEM TR drives the expression of the ZPM TR from pGAL1 in response to estradiol. The ZPM TR in turn drives the expression of YFP from the pZ promoter in response to progesterone (Figure 3a). We measured the two-dimensional dose response output of this circuit for different combinations of estradiol and progesterone (Supplementary Figure S14). As expected, the output increased gradually as a function of both inputs and was highest for maximum concentrations of both estradiol and progesterone (Figure 3b). From our data, we extracted output dose response as a function of estradiol at saturating progesterone concentration, and vice versa, as a function of progesterone at saturating estradiol concentration. We then used these functions to confirm the multiplicative property of the circuit as suggested by the computational model (Supplementary Figure S15, Supplementary Note).
Figure 3.

Two TRs connected in series act as a noise rheostat circuit that decouples mean and variance. (a) Schematic of the noise rheostat. An estradiol-responsive transcriptional regulator (GEM) is used to dial the abundance of a progesterone-responsive regulator (ZPM), which in turns dials the expression of yellow- and red-fluorescent proteins (YFP and mCherry, respectively) under the control of pZ. (b) Mean and CV2 of pZ-YFP distribution for different combinations of estradiol and progesterone. (c) Steady-state pZ-YFP distributions centered at (i) 750, (ii) 1500, (iii) 3000 and (iv) 6000 arbitrary fluorescence units. For each one of these cases, the same mean of the distribution but different variance around the mean could be achieved using different combinations of estradiol and progesterone (inset). (d) Time-dependent pZ-YFP distributions for conditions in (b) that generate the minimum (upper) and maximum (lower) spread over the mean. (e) Coefficient of variation of the intrinsic (green), extrinsic (red) and total (blue) noise as a function mean fluorescence, Only conditions for which the fluorescence is greater than autoffuorescence are plotted.
Furthermore, as predicted by the model, different combinations of estradiol and progesterone yielded similar mean expression values over a substantial dynamic range (Figure 3b). Gratifyingly, in agreement with the principles of the design, we also observed wide differences in the transient and steady-state fluorescence distributions for these similar means (Figure 3c,d). We quantified the spread of these distributions using the squared coefficient of variation (CV2 = variance/mean2) of fluorescence at steady state, and confirmed that different CV2 values can be achieved for the same mean (Figure 3b,e). We note here that the observation that multiple-input/single-output systems can give rise to different variances for the same mean has previously been reported.48 Our work exploits a similar principle to implement noise modulation, but using synthetic components that are orthogonal to the endogenous cellular circuitry.
To achieve a thorough characterization of the noise rheostat circuit, we carried out a number of experiments. In the first, we decomposed noise in the expression of the pZ promoter into its intrinsic and extrinsic49 components by measuring, in the same cell, a second fluorescent protein (mCherry) driven by a second pZ promoter (Figure 3a, Supplementary Figure S16 and S17a,b). We observed that extrinsic, or correlated, variation accounts for the majority of the variation in fluorescence (Figure 3f) and is asymmetric with respect to the two estradiol and progesterone inputs (Supplementary Figure S17c). On the other hand, intrinsic noise in pZ is symmetric with respect to the inputs (Supplementary Figure S17d). This suggests that protein number noise in the pZ promoter itself is not a significant contribution to the cell-to-cell variation. As expected, a plot of the CV2 associated with intrinsic noise for pZ versus mean fluorescence shows a Poisson-like structure, while the same plot for CV2 of extrinsic noise shows a range of values for any given mean (Figure 3e and Supplementary Figure S13e). Finally, we compared the variability of the two promoters in the circuit using a dual-fluorophore strain containing a pGAL1-mCherry (to monitor the GEM system, Supplementary Figure S18) and a pZ-YFP (to monitor the ZPM system). Most of the variation can be attributed to the correlated component (Supplementary Figure S19). These noise trends were reproducible across experiments (Supplementary Figure S20a,b) and reporter fluorophores (Supplementary Figure S20c,d) and in qualitative agreement with the modeling predictions (Supplementary Figure S13f). Overall, our data demonstrate that the 2D-series configuration constitutes a simple circuit that can be used to achieve noise control in a robust and predictable way.
To illustrate an application of the noise rheostat circuit, we used it to assess the impact of modulating the mean and noise in the expression of the cell cycle regulator Sic1p. Sic1p is a cyclin-dependent kinase inhibitor that regulates the G1/S transition controller Cdc28-Clb complex.50 Overexpression of wild-type Sic1p has been reported to result in cell cycle arrest in G1 and elongated bud morphology.51 We built a strain harboring the noise rheostat construct controlling the expression of an extra copy of the SIC1 gene (Figure 4a). To measure expression levels from pZ, we included a copy of the transcriptional reporter pZ-YFP in the same strain. At high Sic1p level (i.e., high estradiol and progesterone doses), cells have a marked phenotypic hallmark, appearing to be bigger with elongated buds (Figure 4b).
Figure 4.

Noise rheostat circuit control of cell cycle regulator SIC1 shows effects of variability in gene expression at the same mean. (a) Cell cycle regulator SIC1 expression under the control of the noise rheostat circuit. (b) Bright field microscopy of cells harboring a SIC1 copy driven by the noise rheostat with no or high concentration of estradiol and progesterone. Size bars: 10 μm. (c) Coefficient of variation as a function of mean of the single-cell YFP fluorescence distribution for different combinations of estradiol and progesterone in a strain containing the noise rheostat regulating the expression of SIC1 (left) and a control strain containing the noise rheostat without SIC1 construct (right). Cytometry cell counts (normalized to noninduced control) are represented in colors of dots. Data for SIC1 noise rheostat experiment represent mean of three replicates. Dotted lines show increasing cell counts with increasing CV2 for data points with similar mean fluorescence.
To probe the fitness effect of increased Sic1 noise beyond the extreme Sic1 expression case, we induced expression of Sic1p with different combinations of estradiol and progesterone and measured expression levels by flow cytometry. In the experiment, we also estimated growth for the different estradiol-progesterone combinations by measuring cell density 5 h after induction. As expected, we observed a monotonic decrease in growth with increased mean Sic1p expression, corroborating the idea that overexpression of this protein promotes cell cycle arrest (Figure 4c, Supplementary Figure S21). We also observed a robust wide regime in which different levels of cell–cell variability can be achieved for the same mean (Figure 4c). For this regime, there seemed to be a trend of increased growth with increased variability, manifesting as a positive correlation between CV2 of Sic1p expression and growth (dotted lines in Figure 4c, Supplementary Figure S22) in a mean-independent way (Supplementary Figure S23). That is, for two estradiol and progesterone combinations that generated the same Sic1 mean, the population subjected to the dosage that also produced higher variability seemed to have enhanced growth rate. This counterintuitive observation may potentially be attributed to the fact that increased variability at a given mean simultaneously increases the proportion of cells in the lowly and highly expressed tail regions of the Sic1p distribution. While cells in the high upper tail of the distribution might be growth stunted, those in the lower tail experience attenuated cell cycle arrest. Therefore, the higher growth of low-Sic1 expressing cells may supersede the effects of the slow growing, high-Sic1 expressing cells. Importantly, this effect of increased Sic1p variability is not apparent at all levels of induction. It surfaces and disappears as Sic1p levels change, highlighting the need to map phenotypes associated with cell–cell variability over a broad range of mean expression levels and noise.
CONCLUSION
In this work, we present two synthetic circuits that exploit two degrees of freedom to either control two independent cellular outputs or two moments of the distribution of a single output. The TRs used here provide high dynamic range control of gene expression, while having no (for ZPM) or limited (the GAL regulon activated by GEM) off-targets and no detectable leakage in the absence of inputs. Importantly, these TRs do not impact fitness, making them suitable for the construction of circuits that operate orthogonally to the physiology of the cell. Moreover, the modularity of the hormone-inducible TRs allows for future combinations of hormone-LBD pairs to be devised and constructed, therefore expanding the number of network components that can be simultaneously manipulated.
The in-parallel circuit configuration provides a tool that could be instrumental for in vivo quantitative characterization of genetic interactions, including protein complexes, pathway crosstalk, and genetic rescue experiments in which a quantitative phenotype is systematically mapped as a function of its effectors. By capitalizing on this system to drive the expression of mating pathway regulators, we showed quantitative phenotypes that could not be revealed without the ability to control the expression of two genes in a graded and simultaneous fashion. Conventional epistatic mapping using overexpressions and deletions would have disregarded Dig1p as a negative regulator of the pathway. In a similar way, traditional methods would miss the differences in how Gpa1p and Msg5p rescue mating pathway induced growth arrest, which are revealed only when observing the entire dual dose response of these negative regulators and Ste4p. We anticipate this circuit to be greatly instrumental in probing the hierarchy and timing of interacting cellular pathways, for example by mapping the influence of one cellular pathway on another as a function of their relative induction delay.52,53
The serial configuration of the two synthetic TRs allows for the modulation of noise independently of mean at low and medium expression levels, a range where variability is most physiologically relevant. This capability is primarily achieved through the presence of two dials that can be simultaneously changed to achieve the same mean, but with different consequences for output variability. The simplicity of this design and its robust operation makes it instrumental for testing the causal connections between noise and fitness, which has so far eluded systematic exploration because schemes for modulating variability, such as mutations to pathway components, are often accompanied by a change in mean, are not tunable or require changing nutritional composition of the media. The ability to compare phenotypes induced by different cell–cell variability in a signal in the context of the same population mean can bridge this gap, providing an invaluable resource for delineating the biological repercussions of molecular noise. Here, we have illustrated a simple manifestation of this point, demonstrating that it is possible to impact population-level fitness by changing the single-cell expression level distribution of the cell cycle regulator Sic1. Much investigation is still needed to go beyond the phenomenology we report, and to extract the underlying principles of noise regulation in this system as well as its exact map to cellular physiology. However, the intricate relationship between mean Sic1 expression, its cell–cell variability, and the resulting morphological and growth phenotypes argues that a tunable noise-controlling circuit such as the one we report here is crucially needed to pinpoint interesting operational regimes of cell–cell variability and delineate the contexts in which more mechanistic investigations should be deployed.
METHODS
Plasmids and Strains
All plasmids used in this study are listed in Supplementary Table S2. Plasmids were cut or PCR-amplified (pHES941) and transformed into S. cerevisiae with standard lithium acetate transformation protocol. The resulting yeast strains are listed in Supplementary Table S3. All plasmids are single-integration constructs when cut with PmeI or PCR-amplified. All constructs were built by restriction/ligation of plasmids and PCR products amplified with Elongase Enzyme Mix (Life Technologies).
The TR constructs consist of a constitutive promoter (a crippled version of the ADH1 promoter) driving the expression of the chimeric transcription factor (Figure 1a). The ZPM construct was built by inserting the hPR-LBD (amplified from Addgene plasmid pRR-PR-5Z, generated in the Miller lab) flanked with BamHI and NotI sites and a small linker into a plasmid containing a BamHI and a NotI restriction site downstream of pADH1(cr) and upstream of the MSN2-AD. The Zif268-LBD (amplified from genomic DNA of an S. cerevisiae strain provided by David Botstein’s lab) flanked by NheI and BglII restriction sites was inserted in between pADH1(cr) and the Zif268-LBD using NheI and BamHI restriction sites.
The TRs reporters were built in a similar way, inserting pGAL1 or pZ upstream of YFP or mCherry, using PspOMI and XhoI restriction sites. The pZ promoter was amplified from strains containing a pGAL1 promoter where three GAL4 binding sites were replaced by four Zif268 binding sites.6 We mutated an extra putative GAL4 binding site (see sequence in Supplementary Text) to avoid activation of transcription from this promoter with either galactose-containing media or the GEM construct. Mating pathway and SIC1 expression plasmids were built by inserting the GPA1, MSG5, DIG1, STE4 or SIC1 ORFs in pGAL1 or pZ-containing plasmids.
The mating pathway reporter was built by inserting a pAGA1-YFP construct, flanked by PspOMI and XhoI restriction sites, into a plasmid containing a Geneticin resistance cassette downstream of the insertion. This construct, including the resistance marker, was then PCR-amplified with homology regions to the CAN1 locus flanking the amplicon and transformed into yeast.
Media and Growth Conditions
Cells were inoculated from single colonies into liquid media and grown for at least 20h in exponential phase at 30 °C with constant shaking before starting experiments. Complete media (YPD) consists of 10 g/L yeast extract, 20 g/L Bacto peptone(Becton Dickinson) and 0.2 g/L dextrose (Sigma-Aldrich). Complete synthetic media (SDC) consists of 6.7 g/L nitrogen base without amino acids, 2 g/L dextrose (Sigma-Aldrich) and 0.79 g/L complete supplement mixture (MP Biomedicals).
Most transformations were selected in synthetic media agar plates with the corresponding amino acid dropout. The pAGA1-YFP-tKan construct transformation was selected in YPD agar plates containing 200 μg/mL G418 (Teknova).
In Parallel Circuit Automated Flow Cytometry Measurements
Experiments were conducted as previously described.38 In the case of multiplexing experiments, strains containing a pTdh3-mKate2-labeled strain were mixed with a strain lacking the label in a 1:1 ratio at the start of the experiment. All cultures were taken to an initial cell density of approximately 6 × 10⁵ cells/mL. Cells were transferred to a 96-well plate and placed in a robotic setup that constantly diluted the cells and took samples to a coupled cell cytometer (LSRII BD) every 20 min. Estradiol (β-estradiol, Sigma-Aldrich) and progesterone (Sigma-Aldrich) were added at the final concentrations indicated in the results section at time 0 and were maintained at those concentrations by replacing the samples taken by the robotic setup with fresh media containing the hormones. To match growth rate, the dilution rate of the cultures was 0.51 h−1, unless otherwise noted. Data was analyzed in Matlab.
Red fluorescence measurements for each cell were divided by the cell’s side scattering value (SSC) and the 2 subpopulations: mKate2-labeled cells (high red fluorescence) and unlabeled cells (low red fluorescence) were identified. The median green fluorescence measurements (FITC) each subpopulation was taken for further analysis. Histograms were computed on volume-corrected fluorescence, by dividing each cell’s fluorescence by its side scattering (SSC). Cell density was calculated as the event rate measured by the cytometer for each condition and time-point and this value was used to calculate growth rate. Changes in fluorescence over time and growth rates were used to calculate expression rates, following the equation:
where αcell,t is the expression rate at time t, Ftotal,t is the median fluorescence at time t and Nt is the cell density at time t. Since we did not observe large fluctuations in growth rates over time before saturation or after approximately 1 h after transferring the cells to the robotic setup, the median d log(N) value was used for all times t, unless otherwise noted. Activation time was calculated as the time to reach half the steady-state mean expression rate.
Noise Measurements and Analysis
For the in-series circuit two-color experiments, cells of two strains (containing pZ-YFP/pZ-mCherry or pZ-YFP/pGAL1-mCherry reporters) were grown and measured using an automated flow cytometry system as described previously. Using Matlab we computed single-cell fluorescence summary statistics for all time points and combinations of estradiol and progesterone. To filter out variability due to cell cycle stage, we gated in the FSC-SSC plane to extract a subset of cells with similar characteristics for computing intrinsic and extrinsic noise components (see Supplementary Figure S17). We extracted intrinsic and extrinsic noise components using principal component analysis (PCA). For comparison, we also computed intrinsic and extrinsic components of noise using the expression used by Elowitz et al.:54
where x and y are the fluorescence values of two different reporters in the cell (Supplementary Figure S24).
Gene Expression, Cell Density and Morphology Measurements for Noise Rheostat-Driven Expression of SIC1
Cells were grown from saturation for 5 h in exponential phase SDC at 30 °C. 200 μL of culture (OD600 0.05) were transferred to a shallow 96-well plate (Corning). Estradiol and progesterone were added at the concentrations indicated in Figure 4 and cells were left shaking at 1200 rpm and 30 °C (Thermo-shaker DTS-4, ELMI). After 5 h, cultures were diluted 1:2 with 1× TE buffer and taken to a cytometer (LSR-II, BD Biosciences) equipped with a high throughput sampler (BD Biosciences). Data was collected in FACS DIVA and analyzed in Matlab. Cell density was estimated from flow cytometry event rate.
Light microscopy was conducted on samples uninduced and fully induced with both hormones. 100 μL of cultures treated for 5 h were sonicated and added to glass-bottom plate precoated with conavalin-A. Cells were immediately imaged in a Nilon Eclipse-Ti microscope with a 40× objective.
Supplementary Material
Supplementary Table 1. Growth rates
Supplementary Table 2. Plasmids used in this study
Supplementary Table 3. Strains used in this study
Acknowledgments
We would like to thank Jacob Stewart-Ornstein for valuable discussion and early work on the characterization of the GEM construct. The Zif268-DBD and the modified GAL1 promoter were kindly provided by the Botstein lab. We thank Ophelia Venturelli and Michael Chevalier for useful conversations and their insight on experimental and theoretical aspects of the work, Lucien Bogar for technical assistance, as well as the rest of the El-Samad lab for feedback throughout. This work was supported by a grant from the Paul G. Allen Family Foundation and the NIGMS system biology center (P50 GM081879) to H.E.-S. The authors declare no competing financial interests.
ABBREVIATIONS
- TR
transcriptional regulator
- LBD
lipid binding domain
- DBD
DNA binding domain
- AD
activation domain
- hER
human estrogen receptor
- hPR
human progesterone receptor
- YFP
yellow fluorescent protein
Footnotes
ORCID
Andrés Aranda-Díaz: 0000-0002-0566-4901
Kieran Mace: 0000-0002-8131-3118
Notes
The authors declare no competing financial interest.
The Supporting Information is available free of charge on the ACS Publications website at DOI: 10.1021/acssynbio.6b00251.
Figures S1–S24 (PDF)
Supplementary Note; Tables S1–S3 (PDF)
References
- 1.Beltrao P, Cagney G, Krogan NJ. Quantitative genetic interactions reveal biological modularity. Cell. 2010;141:739–45. doi: 10.1016/j.cell.2010.05.019. [DOI] [PMC free article] [PubMed] [Google Scholar]
- 2.Schuldiner M, et al. Exploration of the function and organization of the yeast early secretory pathway through an epistatic miniarray profile. Cell. 2005;123:507–19. doi: 10.1016/j.cell.2005.08.031. [DOI] [PubMed] [Google Scholar]
- 3.Setty Y, Mayo aE, Surette MG, Alon U. Detailed map of a cis-regulatory input function. Proc Natl Acad Sci U S A. 2003;100:7702–7. doi: 10.1073/pnas.1230759100. [DOI] [PMC free article] [PubMed] [Google Scholar]
- 4.Anderson JC, Voigt Ca, Arkin AP. Environmental signal integration by a modular AND gate. Mol Syst Biol. 2007;3:133. doi: 10.1038/msb4100173. [DOI] [PMC free article] [PubMed] [Google Scholar]
- 5.Louvion JF, Havaux-Copf B, Picard D. Fusion of GAL4-VP16 to a steroid-binding domain provides a tool for gratuitous induction of galactose-responsive genes in yeast. Gene. 1993;131:129–134. doi: 10.1016/0378-1119(93)90681-r. [DOI] [PubMed] [Google Scholar]
- 6.McIsaac RS, et al. Fast-acting and nearly gratuitous induction of gene expression and protein depletion in Saccharomyces cerevisiae. Mol Biol Cell. 2011;22:4447–59. doi: 10.1091/mbc.E11-05-0466. [DOI] [PMC free article] [PubMed] [Google Scholar]
- 7.Stewart-Ornstein J, Weissman JS, El-Samad H. Cellular noise regulons underlie fluctuations in Saccharomyces cerevisiae. Mol Cell. 2012;45:483–93. doi: 10.1016/j.molcel.2011.11.035. [DOI] [PMC free article] [PubMed] [Google Scholar]
- 8.Ottoz DSM, Rudolf F, Stelling J. Inducible, tightly regulated and growth condition-independent transcription factor in Saccharomyces cerevisiae. Nucleic Acids Res. 2014;42:1–11. doi: 10.1093/nar/gku616. [DOI] [PMC free article] [PubMed] [Google Scholar]
- 9.Labow MA, Baim SB, Shenk T, Levine AJ. Conversion of the lac repressor into an allosterically regulated transcriptional activator for mammalian cells. Mol Cell Biol. 1990;10:3343–56. doi: 10.1128/mcb.10.7.3343. [DOI] [PMC free article] [PubMed] [Google Scholar]
- 10.Gossen M, Bujard H. Tight control of gene expression in mammalian cells by tetracycline-responsive promoters. Proc Natl Acad Sci U S A. 1992;89:5547–51. doi: 10.1073/pnas.89.12.5547. [DOI] [PMC free article] [PubMed] [Google Scholar]
- 11.Gossen M, et al. Transcriptional activation by tetracyclines in mammalian cells. Science. 1995;268:1766–9. doi: 10.1126/science.7792603. [DOI] [PubMed] [Google Scholar]
- 12.Qi LS, et al. Repurposing CRISPR as an RNA-guided platform for sequence-specific control of gene expression. Cell. 2013;152:1173–83. doi: 10.1016/j.cell.2013.02.022. [DOI] [PMC free article] [PubMed] [Google Scholar]
- 13.Hovland P, Flick J, Johnston M, Sclafani RA. Galactose as a gratuitous inducer of GAL gene expression in yeasts growing on glucose. Gene. 1989;83:57–64. doi: 10.1016/0378-1119(89)90403-4. [DOI] [PubMed] [Google Scholar]
- 14.Shimizu-Sato S, Huq E, Tepperman JM, Quail PH. A light-switchable gene promoter system. Nat Biotechnol. 2002;20:1041–4. doi: 10.1038/nbt734. [DOI] [PubMed] [Google Scholar]
- 15.Konermann S, et al. Optical control of mammalian endogenous transcription and epigenetic states. Nature. 2013;500:472–6. doi: 10.1038/nature12466. [DOI] [PMC free article] [PubMed] [Google Scholar]
- 16.Rao CV, Wolf DM, Arkin AP. Control, exploitation and tolerance of intracellular noise. Nature. 2002;420:231–7. doi: 10.1038/nature01258. [DOI] [PubMed] [Google Scholar]
- 17.Samoilov MS, Price G, Arkin AP. From fluctuations to phenotypes: the physiology of noise. Sci STKE. 2006;2006:re17. doi: 10.1126/stke.3662006re17. [DOI] [PubMed] [Google Scholar]
- 18.Balaban NQ, Merrin J, Chait R, Kowalik L, Leibler S. Bacterial persistence as a phenotypic switch. Science. 2004;305:1622–5. doi: 10.1126/science.1099390. [DOI] [PubMed] [Google Scholar]
- 19.Sourjik V, Wingreen NS. Responding to chemical gradients: bacterial chemotaxis. Curr Opin Cell Biol. 2012;24:262–8. doi: 10.1016/j.ceb.2011.11.008. [DOI] [PMC free article] [PubMed] [Google Scholar]
- 20.Spencer SL, Gaudet S, Albeck JG, Burke JM, Sorger PK. Non-genetic origins of cell-to-cell variability in TRAIL-induced apoptosis. Nature. 2009;459:428–32. doi: 10.1038/nature08012. [DOI] [PMC free article] [PubMed] [Google Scholar]
- 21.Delbrück M. The Burst Size Distribution in the Growth of Bacterial Viruses (Bacteriophages) J Bacteriol. 1945;50:131–5. doi: 10.1128/JB.50.2.131-135.1945. [DOI] [PubMed] [Google Scholar]
- 22.Burnett JC, Miller-Jensen K, Shah PS, Arkin AP, Schaffer DV. Control of stochastic gene expression by host factors at the HIV promoter. PLoS Pathog. 2009;5:e1000260. doi: 10.1371/journal.ppat.1000260. [DOI] [PMC free article] [PubMed] [Google Scholar]
- 23.Tanouchi Y, et al. A noisy linear map underlies oscillations in cell size and gene expression in bacteria. Nature. 2015;523:357–60. doi: 10.1038/nature14562. [DOI] [PMC free article] [PubMed] [Google Scholar]
- 24.Ozbudak EM, Thattai M, Kurtser I, Grossman AD, van Oudenaarden A. Regulation of noise in the expression of a single gene. Nat Genet. 2002;31:69–73. doi: 10.1038/ng869. [DOI] [PubMed] [Google Scholar]
- 25.Murphy KF, Balázsi G, Collins JJ. Combinatorial promoter design for engineering noisy gene expression. Proc Natl Acad Sci U S A. 2007;104:12726–12731. doi: 10.1073/pnas.0608451104. [DOI] [PMC free article] [PubMed] [Google Scholar]
- 26.Tabor JJ, Bayer TS, Simpson ZB, Levy M, Ellington AD. Engineering stochasticity in gene expression. Mol BioSyst. 2008;4:754–61. doi: 10.1039/b801245h. [DOI] [PMC free article] [PubMed] [Google Scholar]
- 27.Hooshangi S, Thiberge S, Weiss R. Ultra-sensitivity and noise propagation in a synthetic transcriptional cascade. Proc Natl Acad Sci U S A. 2005;102:3581–6. doi: 10.1073/pnas.0408507102. [DOI] [PMC free article] [PubMed] [Google Scholar]
- 28.Murphy KF, Adams RM, Wang X, Balázsi G, Collins JJ. Tuning and controlling gene expression noise in synthetic gene networks. Nucleic Acids Res. 2010;38:2712–26. doi: 10.1093/nar/gkq091. [DOI] [PMC free article] [PubMed] [Google Scholar]
- 29.Hung M, et al. Modulating the frequency and bias of stochastic switching to control phenotypic variation. Nat Commun. 2014;5:4574. doi: 10.1038/ncomms5574. [DOI] [PubMed] [Google Scholar]
- 30.Braselmann S, Graninger P, Busslinger M. A selective transcriptional induction system for mammalian cells based on Gal4-estrogen receptor fusion proteins. Proc Natl Acad Sci U S A. 1993;90:1657–61. doi: 10.1073/pnas.90.5.1657. [DOI] [PMC free article] [PubMed] [Google Scholar]
- 31.Wang Y, O’Malley BW, Tsai SY. A regulatory system for use in gene transfer. Proc Natl Acad Sci U S A. 1994;91:8180–4. doi: 10.1073/pnas.91.17.8180. [DOI] [PMC free article] [PubMed] [Google Scholar]
- 32.Wang Y, Xu J, Pierson T, O’Malley BW, Tsai SY. Positive and negative regulation of gene expression in eukaryotic cells with an inducible transcriptional regulator. Gene Ther. 1997;4:432–41. doi: 10.1038/sj.gt.3300402. [DOI] [PubMed] [Google Scholar]
- 33.Pratt WB. The hsp90-based chaperone system: involvement in signal transduction from a variety of hormone and growth factor receptors. Exp Biol Med. 1998;217:420–434. doi: 10.3181/00379727-217-44252. [DOI] [PubMed] [Google Scholar]
- 34.Smith DF, Toft DO. Minireview: the intersection of steroid receptors with molecular chaperones: observations and questions. Mol Endocrinol. 2008;22:2229–2240. doi: 10.1210/me.2008-0089. [DOI] [PMC free article] [PubMed] [Google Scholar]
- 35.McIsaac RS, et al. Synthetic gene expression perturbation systems with rapid, tunable, single-gene specificity in yeast. Nucleic Acids Res. 2013;41:e57. doi: 10.1093/nar/gks1313. [DOI] [PMC free article] [PubMed] [Google Scholar]
- 36.Bram RJ, Kornberg RD. Specific protein binding to far upstream activating sequences in polymerase II promoters. Proc Natl Acad Sci U S A. 1985;82:43–47. doi: 10.1073/pnas.82.1.43. [DOI] [PMC free article] [PubMed] [Google Scholar]
- 37.Giniger E, Varnum SM, Ptashne M. Specific DNA binding of GAL4, a positive regulatory protein of yeast. Cell. 1985;40:767–774. doi: 10.1016/0092-8674(85)90336-8. [DOI] [PubMed] [Google Scholar]
- 38.Zuleta I, Aranda-Díaz A, Li H, El-Samad H. Dynamic characterization of growth and gene expression using high-throughput automated flow cytometry. Nat Methods. 2014;11:443–8. doi: 10.1038/nmeth.2879. [DOI] [PMC free article] [PubMed] [Google Scholar]
- 39.Pichon MF, Milgrom E. Characterization and Assay of Progesterone Receptor in Human Mammary Carcinoma. Cancer Res. 1977:464–471. [PubMed] [Google Scholar]
- 40.Bardwell L. A walk-through of the yeast mating pheromone response pathway. Peptides. 2004;25:1465–76. doi: 10.1016/j.peptides.2003.10.022. [DOI] [PubMed] [Google Scholar]
- 41.Kim J, Couve A, Hirsch JP. Receptor inhibition of pheromone signaling is mediated by the Ste4p Gbeta subunit. Mol Cell Biol. 1999;19:441–9. doi: 10.1128/mcb.19.1.441. [DOI] [PMC free article] [PubMed] [Google Scholar]
- 42.Tedford K, Kim S, Sa D, Stevens K, Tyers M. Regulation of the mating pheromone and invasive growth responses in yeast by two MAP kinase substrates. Curr Biol. 1997;7:228–38. doi: 10.1016/s0960-9822(06)00118-7. [DOI] [PubMed] [Google Scholar]
- 43.Doi K, et al. MSG5, a novel protein phosphatase promotes adaptation to pheromone response in S. cerevisiae. EMBO J. 1994;13:61–70. doi: 10.1002/j.1460-2075.1994.tb06235.x. [DOI] [PMC free article] [PubMed] [Google Scholar]
- 44.Nomoto S, Nakayama N, Arai K, Matsumoto K. Regulation of the yeast pheromone response pathway by G protein subunits. EMBO J. 1990;9:691–6. doi: 10.1002/j.1460-2075.1990.tb08161.x. [DOI] [PMC free article] [PubMed] [Google Scholar]
- 45.McCullagh E, Seshan A, El-Samad H, Madhani HD. Coordinate control of gene expression noise and interchro-mosomal interactions in a MAP kinase pathway. Nat Cell Biol. 2010;12:954–62. doi: 10.1038/ncb2097. [DOI] [PMC free article] [PubMed] [Google Scholar]
- 46.Takahashi S, Pryciak PM. Membrane Localization of Scaffold Proteins Promotes Graded Signaling in the Yeast MAP Kinase Cascade. Curr Biol. 2008;18:1184–1191. doi: 10.1016/j.cub.2008.07.050. [DOI] [PMC free article] [PubMed] [Google Scholar]
- 47.Peter M, Gartner A, Horecka J, Ammerer G, Herskowitz I. FAR1 links the signal transduction pathway to the cell cycle machinery in yeast. Cell. 1993;73:747–60. doi: 10.1016/0092-8674(93)90254-n. [DOI] [PubMed] [Google Scholar]
- 48.Blake WJ, Kaern M, Cantor CR, Collins JJ. Noise in eukaryotic gene expression. Nature. 2003;422:633–7. doi: 10.1038/nature01546. [DOI] [PubMed] [Google Scholar]
- 49.Raser JM, O’Shea EK. Control of stochasticity in eukaryotic gene expression. Science. 2004;304:1811–4. doi: 10.1126/science.1098641. [DOI] [PMC free article] [PubMed] [Google Scholar]
- 50.Schwob E, Böhm T, Mendenhall MD, Nasmyth K. The B-type cyclin kinase inhibitor p40SIC1 controls the G1 to S transition in S. cerevisiae. Cell. 1994;79:233–44. doi: 10.1016/0092-8674(94)90193-7. [DOI] [PubMed] [Google Scholar]
- 51.Nugroho TT, Mendenhall MD. An inhibitor of yeast cyclin-dependent protein kinase plays an important role in ensuring the genomic integrity of daughter cells. Mol Cell Biol. 1994;14:3320–8. doi: 10.1128/mcb.14.5.3320. [DOI] [PMC free article] [PubMed] [Google Scholar]
- 52.García-Rodríguez LJ, Valle R, Durán A, Roncero C. Cell integrity signaling activation in response to hyperosmotic shock in yeast. FEBS Lett. 2005;579:6186–90. doi: 10.1016/j.febslet.2005.10.001. [DOI] [PubMed] [Google Scholar]
- 53.Pincus D, Aranda-Díaz A, Zuleta IA, Walter P, El-Samad H. Delayed Ras/PKA signaling augments the unfolded protein response. Proc Natl Acad Sci U S A. 2014;111:14800–5. doi: 10.1073/pnas.1409588111. [DOI] [PMC free article] [PubMed] [Google Scholar]
- 54.Elowitz MB, Levine AJ, Siggia ED, Swain PS. Stochastic gene expression in a single cell. Science. 2002;297:1183–6. doi: 10.1126/science.1070919. [DOI] [PubMed] [Google Scholar]
Associated Data
This section collects any data citations, data availability statements, or supplementary materials included in this article.
Supplementary Materials
Supplementary Table 1. Growth rates
Supplementary Table 2. Plasmids used in this study
Supplementary Table 3. Strains used in this study