
Figure 8.
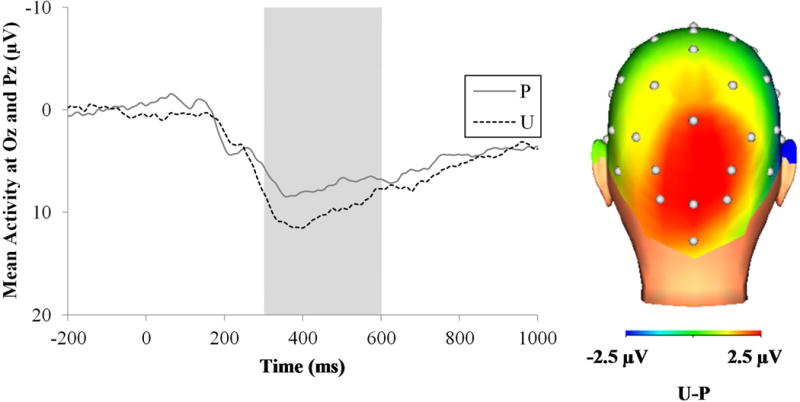
ERP waveforms at pooling of Oz and Pz (left) and scalp distribution (right) for the LPP to the unpleasant pictures across the different conditions. The shaded region shows where the early LPP component was scored (300 to 600 ms). ERP = event-related potential; LPP = late positive potential; ms = milliseconds; P = predictable threat; U = unpredictable threat.