Abstract
Background
Latent transforming growth factor β binding protein 2 (LTBP2) is proven to be associated with ECM and involved in the advancement of several kinds of cancer. The present study evaluated the diagnosis and prognosis of pancreatic carcinoma (PC) using LTBP2 as a biomarker.
Material/Methods
Protein levels of LTBP2 were evaluated in 111 pairs of pancreatic ductal adenocarcinoma (PDAC) tissues and adjacent nontumor tissues via immunohistochemistry. ELISA method was used to quantify the serum concentration of LTBP2. The subjects in this study included 141 PDAC patients, 20 patients with benign pancreatic disease, and 20 healthy volunteers.
Results
IHC results showed that LTBP2 levels were significantly elevated in the PDAC tissues as compared with the adjacent nontumor tissues (P<0.05). Sixty-one of the 111 (54.9%) PDAC tissues showed high expression of the protein. LTBP2 overexpression was significantly correlated with poor differentiation (P=0.018) and advanced TNM stage (P=0.036). Moreover, Kaplan-Meier analysis showed that high levels of LTBP2 predicted worse overall survival (P=0.001) and disease-free survival (P=0.001). Multivariate Cox regression analysis indicated that high expression of LTBP2 was an autonomous prognostic factor for poor overall and disease-free survival (P=0.001; P=0.002). Receiver operating characteristic (ROC) curve analyses of showed that LTBP-2 had an area under the curve (AUC) of 0.846 (95% confidence intervals: 0.757–0.934) and cut-off value of 19.12.
Conclusions
LTBP2 is a novel biomarker for the diagnosis of PC and may be a potential target for PDAC clinical therapy.
MeSH Keywords: Carcinoma, Pancreatic Ductal; Diagnosis; Latent TGF-beta Binding Proteins; Prognosis
Background
Pancreatic carcinoma, principally pancreatic ductal adenocarcinoma, is the thirteenth most prevalent malignancy worldwide [1,2]. With an extremely high rate of mortality, treatment for PDAC has become a struggle for surgeons [3]. The dismal outcome of PDAC is strongly attributed to the lack of timely diagnosis and frequent early metastasis of the tumor [4]. Unfortunately, patients with PDAC who underwent traditional surgery or chemoradiotherapy cannot obtain satisfactory clinical results [5]. It is, therefore, necessary to explore a novel and reliable biomarker for an earlier diagnosis as well as prediction of clinical outcomes of PDAC patients.
Latent transforming growth factor β binding protein 2 (LTBP2), which is a member of the fibrillin/LTBP super family of extracellular matrix proteins, might be involved in advancement of extracellular microfibrils and/or elastic fibers [6]. Accumulating evidence shows that the abnormal expression of LTBP2 contributes to many kinds of cancer development and progression, including esophageal squamous cell carcinoma [7], cervical adenocarcinoma [8], hepatocellular carcinoma [9], and head and neck squamous cell carcinoma [10]. The role of LTBP2 in the PDAC, however, remains poorly understood.
The present study was carried out to investigate the relation between LTBP2 expression levels and the diagnosis and prognosis of PDAC. Experimental results show that LTBP2 is overexpressed in PDAC tissues and is significantly correlated with poor differentiation and higher TNM stage. Moreover, LTBP2 could be a potential independent prognostic biomarker for PDAC and may be useful as a diagnostic biomarker for PDAC in early stages.
Material and Methods
Patients and sample collection
Preoperative blood samples were acquired from 31 PC patients, 21 benign pancreatic disease (BPD) patients, and 21 healthy volunteers, along with tumor tissue specimens from 111 PC patients. BPD patients included those with acute/chronic pancreatitis and serous cystadenoma. All volunteer patients were admitted to Anhui Provincial Hospital (Hefei, China) from 2011 to 2015. The patients comprised 80 males and 31 females, ages 38–79 years old, with an average age of 55 years. We collected 2.5-ml peripheral venous blood samples from patients half an hour before surgery and stored the samples at −80°C after centrifugation. The specimens were fixed in formalin, set in paraffin, then sliced (4-μm thick) for pathological analysis and diagnostic confirmation. The detailed pathological and clinical data (age, sex, tumor location, nerve invasion, degree of differentiation, histological type, invasion depth, metastasis of the lymph node) and TNM stages were obtained from the electronic database of medical records. All patients included in the study were pathologically diagnosed with pancreatic cancer, and those who had received radiotherapy and chemotherapy prior to surgery were excluded. Pathological staging was based on the 7th ed. of the UICC TNM staging system.
Enzyme-linked immunosorbent assay (ELISA)
ELISA was performed using recombinant human LTBP-2 ELISA Kit (Abcam, San Francisco, USA) to detect serum LTBP-2 levels. All procedures were in accordance with the manufacturer’s protocols. In summary, 100 μl of phosphate-buffered saline (PBS) and pancreatic cancer serum were added to 96-well plates and separately incubated at 37°C for 2 h. After drying, the detection antibody was added to the wells and then incubated for another 1 h at the same temperature. Then, after the wells were washed 3 times, 100 μl of the working dilution B was added into every well, then incubated at 37°C for another 30 min. We added 90 μl of substrate solution to each well, placed them in a dark environment for 20 min, followed by washing 5 times. Lastly, the absorbance of each well was quantified at 450 nm by use of a microplate reader.
Immunohistochemistry and scoring
Immunohistochemical methods were performed using the Envision two-step method. Antigens were repaired via high temperature and pressure antigen repair using citrate buffer (pH=6). The operation was performed in the immuno-histo stainer. Endogenous hydrogen peroxide activity of sections was inhibited with hydrogen peroxide (0.3%) for 15 min at room temperature, and then washed using phosphate-buffered saline (PBS; 3×3 min). Rabbit polyclonal anti-LTBP2 antibody (Abcam, San Francisco, USA) was added to the sections at 37°C for 2 h, then washed with PBS (3×3 min). Sections were then incubated with Universal IgG antibody-HRP polymer (Santa Cruz Biotechnology, Santa Cruz, California, USA) at 37°C for 15 min. All sections were then treated with 50 μl of diaminobenzidine (DAB) working solution at room temperature for 3–10 min and then washed with PBS (3×3 min). The tissue staining status was captured using an Olympus BX61 (Tokyo, Japan) microscope. The operating procedures were carried out in strict accordance with the instrument’s operating instructions.
The tumor expression of LTBP2 was semi-quantitatively assessed. Immunoreactivity to the protein was determined via the intensity of immunostaining as well as the percentage of positive cells. The density of staining intensity was graded as follows: 0 represented “none”; 1 represented “weak”; 2 represented “moderate”; and 3 represented “strong”. The proportion of positive cells was further categorized as: 0: <1%; 1: 1–30%; 2: 30–70%; and 3: >70%. Semi-quantitative assessment and the final immunostaining score established, that scores of 0, 1, 2, and 3 indicated low expression, while scores of 4, 6, and 9 indicated high expression. The immunohistochemical results were evaluated by 2 pathologists using blind testing method and discrepancies were resolved via consensus.
Statistical analysis
The SPSS 17.0 package (SPSS, Inc., Chicago, IL, USA) was used in performing the statistical analyses. The relationships between LTBP2 expression and patient characteristics were analyzed using the chi-square and Spearman correlation tests. Kaplan-Meier survival curves and the log rank test were used for survival analysis and survival curve drawing. Univariate and multivariate Cox regression analysis were applied to assess potential inde-pendent prognostic factors. The region under the ROC curve was used to analyze prognostic value of the index in the prognosis of pancreatic cancer. All P values are 2-sided and P<0.05 was regarded as statistically significant.
Results
Tissue immunohistochemical expression of LTBP2
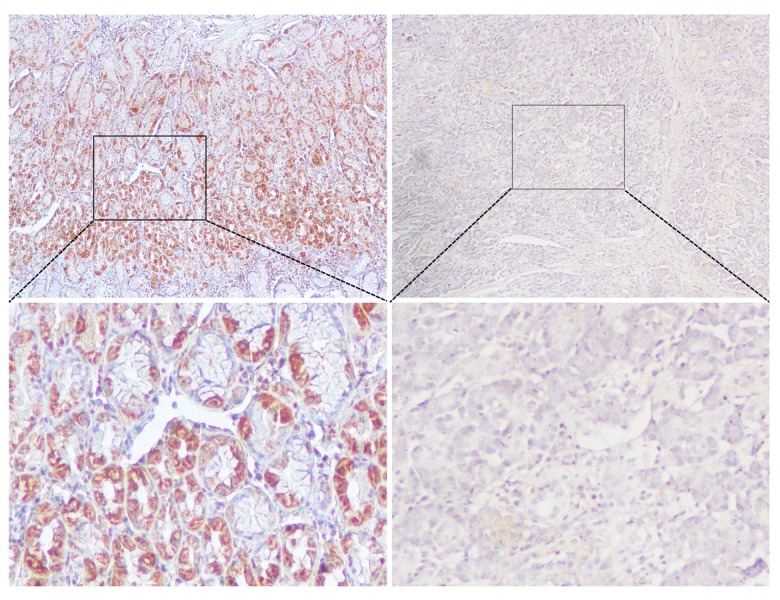
In determining the expression of LTBP2 in pancreatic cancer patients, it was quantified in the tissues. As shown in the immunohistochemical analyses in Figure 1, strongly immunoreactive LTBP-2 was observed in tumor tissue specimens and was absent in adjacent non-cancerous tissues with weak immunoreactivity. In addition, high expression of LTBP2 was observed in 61 of 111 PC tissues and 26 of 111 non-cancerous pancreatic tissues. LTBP2 expression in PC tissues was significantly higher than in the non-cancerous tissue samples (P<0.001, Table 1).
Figure 1.
Immunohistochemical staining for LTBP2 in PC and paracancerous normal tissues. Bar=50 um.
Table 1.
Comparison between LTBP2 protein expressions (immunohistochemical staining) in PC and paracancer pancreatic tissues.
| LTBP2 expression intensity | ||
|---|---|---|
| High (n) | Low (n) | |
| PC tissues | 61 | 50 |
| Paracancer tissues | 26 | 85 |
| χ2 | 23.155 | |
| P | 0.000 | |
Association of LTBP2 expression with PC patient clinicopathological parameters
To understand whether LTBP2 expression was connected with or related to patient prognosis, the relationship between LTBP2 expression and PC patient clinicopathological parameters, including sex, age, tumor size, location, differentiation, and TNM stage, was analyzed. As shown in Table 2, increased LTBP2 expression was significantly related to the differentiation (P=0.018) and TNM stage (P=0.036) but was not significantly related to sex, age, tumor size, or location.
Table 2.
Relationships between LTBP2 protein expressions (immunohistochemical staining) in PDAC and various clinicopathological variables.
| Variables | Total | LTBP2 expression | χ2 | P | |
|---|---|---|---|---|---|
| Low (n=50) | High (n=61) | ||||
| Gender | |||||
| Male | 80 | 33 | 47 | 1.667 | 0.197 |
| Female | 31 | 17 | 14 | ||
| Age (years) | |||||
| ≤60 | 57 | 25 | 32 | 0.067 | 0.796 |
| >60 | 54 | 25 | 29 | ||
| Size (cm) | |||||
| ≤4 | 57 | 24 | 33 | 0.409 | 0.522 |
| >4 | 54 | 26 | 28 | ||
| Tumor location | |||||
| Head and Neck | 70 | 34 | 36 | 0.952 | 0.329 |
| Body and Tail | 41 | 16 | 25 | ||
| Differentiation | |||||
| Well/moderate | 76 | 40 | 36 | 5.604 | 0.018 |
| Poor and not | 35 | 10 | 25 | ||
| T classification | |||||
| T1 + T2 | 79 | 41 | 38 | 5.200 | 0.023 |
| T3 + T4 | 32 | 9 | 23 | ||
| M classification | |||||
| M0 | 104 | 49 | 55 | 2.856 | 0.091 |
| M1 | 7 | 1 | 6 | ||
| N classification | |||||
| N0 | 87 | 44 | 43 | 4.970 | 0.026 |
| N1 | 24 | 6 | 18 | ||
| TNM stage | |||||
| I–II | 86 | 48 | 51 | 4.377 | 0.036 |
| III–IV | 12 | 2 | 10 | ||
Correlation of LTBP2 expression with PC patient prognosis
Kaplan-Meier survival analysis was plotted to compare the overall survival (OS) and disease-free survival (DFS) of PC patients according to their LTBP2 expressions (Figures 2, 3). Patients with high expression of LTBP2 had poorer prognosis compared to those with low LTBP2 expression (OS, P=0.001; DFS, P=0.001). Multivariate survival analysis further revealed that intra-tu-moral LTBP2 expression (OS, P=0.001; DFS, P=0.002) was an independent poor prognostic marker for OS and DFS (Tables 3, 4).
Figure 2.
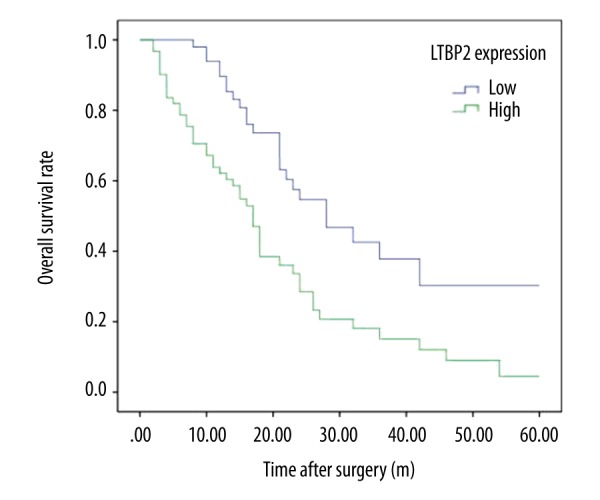
Kaplan-Meier analysis of overall survival (OS) of PC patients according to intra-tumoral LTBP2 expression.
Figure 3.
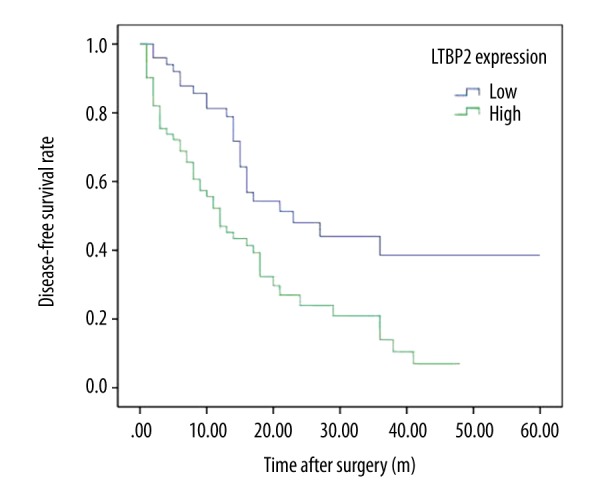
Kaplan-Meier analysis of disease-free survival (DFS) of PC patients according to intra-tumoral LTBP2 expression.
Table 3.
Univariate and multivariate analysis of the correlation between clinicopathological parameters and overall survival time of patients with PDAC.
| Variable | Univariate analysis | Multivariate analysis | ||||
|---|---|---|---|---|---|---|
| HR | 95% CI | P | HR | 95% CI | P | |
| Gender | ||||||
| Male | 0.801 | 0.480–1.337 | 0.395 | |||
| Female | ||||||
| Age (years) | ||||||
| ≤60 | 0.867 | 0.542–1.388 | 0.553 | |||
| >60 | ||||||
| Size (cm) | ||||||
| ≤4 | 1.166 | 0.730–1.863 | 0.520 | |||
| >4 | ||||||
| Differentiation | ||||||
| Well/moderate | 0.574 | 0.351–0.939 | 0.027* | |||
| Poor and not | ||||||
| Tumor location | ||||||
| Head and Neck | 0.918 | 0.556–1.514 | 0.737 | |||
| Body and Tail | ||||||
| T classification | ||||||
| T1 + T2 | 0.796 | 0.473–1.339 | 0.389 | |||
| T3 + T4 | ||||||
| N classification | ||||||
| N0 | 1.217 | 0.684–2.166 | 0.505 | |||
| N1 | ||||||
| M classification | ||||||
| M0 | 0.291 | 0.115–0.740 | 0.009* | |||
| M1 | ||||||
| TNM stage | ||||||
| I–II | 0.329 | 0.160–0.679 | 0.003* | 0.325 | 0.108–0.978 | 0.046* |
| III–IV | ||||||
| LTBP2 expression | ||||||
| Low | 0.428 | 0.261–0.701 | 0.001* | 0.388 | 0.224–0.674 | 0.001* |
| High | ||||||
Table 4.
Univariate and multivariate analysis of the correlation between clinicopathological parameters and disease-free survival time of patients with PDAC.
| Variable | Univariate analysis | Multivariate analysis | ||||
|---|---|---|---|---|---|---|
| HR | 95% CI | P | HR | 95% CI | P | |
| Gender | ||||||
| Male | 0.894 | 0.536–1.491 | 0.667 | |||
| Female | ||||||
| Age (years) | ||||||
| ≤60 | 0.971 | 0.609–1.548 | 0.902 | |||
| >60 | ||||||
| Size (cm) | ||||||
| ≤4 | 1.141 | 0.715–1.820 | 0.580 | |||
| >4 | ||||||
| Differentiation | ||||||
| Well/moderate | 0.567 | 0.347–0.925 | 0.023* | |||
| Poor and not | ||||||
| Tumor location | ||||||
| Head and Neck | 0.917 | 0.560–1.501 | 0.729 | |||
| Body and Tail | ||||||
| T classification | ||||||
| T1 + T2 | 0.933 | 0.556–1.568 | 0.795 | |||
| T3 + T4 | ||||||
| N classification | ||||||
| N0 | 1.173 | 0.661–2.082 | 0.586 | |||
| N1 | ||||||
| M classification | ||||||
| M0 | 0.302 | 0.120–0.764 | 0.011* | |||
| M1 | ||||||
| TNM stage | ||||||
| I–II | 0.311 | 0.151–0.640 | 0.001* | 0.244 | 0.079–0.753 | 0.014* |
| III–IV | ||||||
| LTBP2 expression | ||||||
| Low | 0.451 | 0.276–0.740 | 0.002* | 0.427 | 0.248–0.735 | 0.002* |
| High | ||||||
Relationship between serum level and diagnosis
To further demonstrate the relationship between LTBP2 and pancreatic cancer, the serological levels of LTBP2 in different pancreatic diseases were measured. As shown in Figure 4, the LTBP2 levels of PC patients were significantly higher than in BPD patients and healthy volunteers. The diagnostic performance of LTBP2 in detecting PC was analyzed using ROC curve analysis in a cohort of 31 PC patients, 21 BPD patients, and 21 healthy volunteers (Figure 5). The AUC was 0.846 (95% confidence intervals: 0.757–0.934) and the cut-off value was 19.12.
Figure 4.
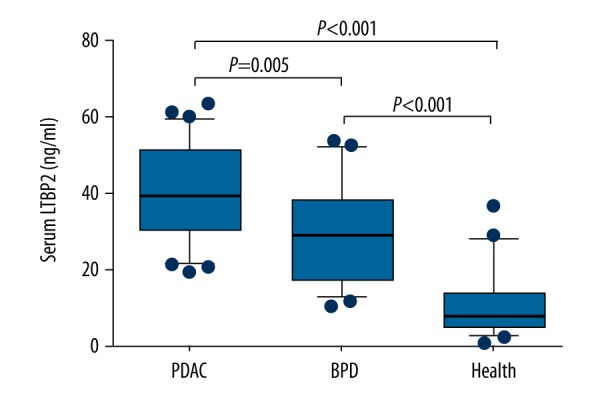
Serum LTBP2 level in PDAC, BPD patients, and healthy volunteers.
Figure 5.
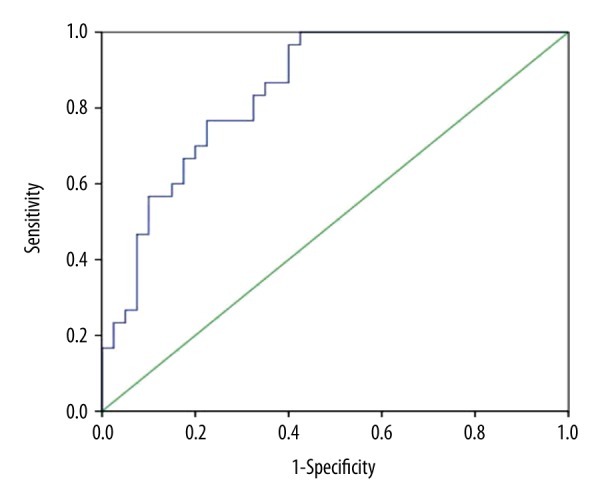
ROC curve analysis predicted the prognosis of pancreatic cancer which showed the different expression of LTBP2. LTBP-2 had an area under the curve (AUC) of 0.846 (95% confidence intervals: 0.757–0.934) and cut-off value of 19.12.
Discussion
In the present study, the prognostic and diagnostic values of LTBP2 in a random population of patients with PDAC was initially estimated. The results of the study suggested that LTBP2 protein levels were far higher in PDAC tissues than in para-carcinoma tissues. Overexpression of LTBP2 was related to poor differentiation and advanced TNM stages. High expression of LTBP2 predicted poor overall and disease-free survival in patients with PDAC. In particular, testing the serum protein levels of LTBP2 could contribute to the early diagnosis of PDAC.
LTBPs are a family of extracellular multidomain proteins which include 4 isoforms (LTBP1, 2, 3, and 4) associated with fibrillin microfibrils and TGF-β activities [11]. The function of LTBPs mainly focus on 3 different aspects. First, covalent bonding of LTBPs with SL-TGF-β is involved in assembly, secretion, and TGF-β activities [12]. Second, LTBPs bind fibrillin microfibrils in the extracellular matrix protein to promote TGF-β storage [12]. Third, LTBPs participate in the regulation of cell adhesion [13]. LTBP2 is expressed abundantly in the lungs [14] and small amounts of LTBP2 are expressed in the liver, heart, and embryo [15]. Experimental investigations have shown that LTBP2 is unique since it is the only LTBP isoform which does not bind to latent TGF-β, and therefore has functions that are independent of latent TGF-β storage and activation [6].
Recent research has noted the important role of LTPB2 in the initiation and development of several kinds of cancer. High LTPB2 expression in pancreatic cancer was detected by Turtoi et al. [16], in agreement with the findings of the present study. Moreover, serum LTBP2 could serve as a biomarker in HBV-related HCC diagnosis [9]. This study also evaluated the diagnostic value of serum LTBP2 in patients with PDAC. Interestingly, ELISA results showed that LTBP2 serum levels could be an effective biomarker for the diagnosis of PDAC. In esophageal squamous cell carcinoma [7], ovarian carcinoma [17], cervical adenocarcinoma [8], and head and neck squamous cell carcinoma [10], high protein levels of LTBP2 predicted poor survival. This conclusion is consistent with our findings. Previous research on the mechanism of LTBP2 in cancer progression suggest that it might play double roles in tumor onset and progression [18]. These contradictory roles can be partly explained by the correlation between LTBP2 and TGF-β. TGF-β functions as a tumor suppressor in the early stages of tumorigenesis, while it bolsters cancer development in advanced stages [19,20].
Conclusions
Our findings show that LTBP2 is overexpressed in PDAC tissues. High protein levels of LTBP2 are associated with poor differentiation and higher TNM stage, and might serve as an effective and reliable biomarker for early diagnosis and poor prognosis in patients with PDAC. However, the details of the molecular mechanism of LTBP2 in pancreatic carcinoma need to be further defined.
Footnotes
Source of support: Departmental sources
References
- 1.Siegel RL, Miller KD, Jemal A. Cancer Statistics, 2017. Cancer J Clin. 2017;67:7–30. doi: 10.3322/caac.21387. [DOI] [PubMed] [Google Scholar]
- 2.Chen W, Zheng R, Baade PD, et al. Cancer statistics in China, 2015. Cancer J Clin. 2016;66:115–32. doi: 10.3322/caac.21338. [DOI] [PubMed] [Google Scholar]
- 3.Jiang X, Sugaya S, Ren Q, et al. Prevention of pancreatic cancer. Pancreatic cancer – molecular mechanism and targets. InTech. 2011:1263–70. [Google Scholar]
- 4.Diwakarla C, Hannan K, Hein N, et al. Advanced pancreatic ductal adenocarcinoma – Complexities of treatment and emerging therapeutic options. World J Gastroenterol. 2017;23(13):2276–85. doi: 10.3748/wjg.v23.i13.2276. [DOI] [PMC free article] [PubMed] [Google Scholar]
- 5.Kota J, Hancock J, Kwon J, et al. Pancreatic cancer: Stroma and its current and emerging targeted therapies. Cancer Lett. 2017;391:38. doi: 10.1016/j.canlet.2016.12.035. [DOI] [PubMed] [Google Scholar]
- 6.Todorovic V, Jurukovski V, Chen Y, et al. Latent TGF-β binding proteins. Int J Biochem Cell Biol. 2005;37(1):38–41. doi: 10.1016/j.biocel.2004.03.011. [DOI] [PubMed] [Google Scholar]
- 7.Chan SHK, Ko JMY, Chan KW, et al. The ECM protein LTBP-2 is a suppressor of esophageal squamous cell carcinoma tumor formation but higher tumor expression associates with poor patient outcome. Int J Cancer. 2011;129(3):565–73. doi: 10.1002/ijc.25698. [DOI] [PubMed] [Google Scholar]
- 8.Ren Y, Lu H, Zhao D, et al. LTPB2 acts as a prognostic factor and promotes progression of cervical adenocarcinoma. Am J Transl Res. 2014;7(6):1095–105. [PMC free article] [PubMed] [Google Scholar]
- 9.Da CA, Plymoth A, Santos-Silva D, et al. Osteopontin and latent-TGF β binding-protein 2 as potential diagnostic markers for HBV-related hepatocellular carcinoma. Int J Cancer. 2015;136(1):172–81. doi: 10.1002/ijc.28953. [DOI] [PMC free article] [PubMed] [Google Scholar]
- 10.Han L, Tang MM, Xu X, et al. LTBP2 is a prognostic marker in head and neck squamous cell carcinoma. Oncotarget. 2016;7(29):45052. doi: 10.18632/oncotarget.8855. [DOI] [PMC free article] [PubMed] [Google Scholar]
- 11.Saharinen J, Keskioja J. Specific sequence Motif of 8-cys repeats of TGF-β binding proteins, LTBPs, creates a hydrophobic interaction surface for binding of small latent TGF-β. Mol Biol Cell. 2000;11(8):2691–704. doi: 10.1091/mbc.11.8.2691. [DOI] [PMC free article] [PubMed] [Google Scholar]
- 12.Hirai M, Horiguchi M, Ohbayashi T, et al. Latent TGF-beta-binding protein 2 binds to DANCE/fibulin-5 and regulates elastic fiber assembly. EMBO J. 2007;26(14):3283–95. doi: 10.1038/sj.emboj.7601768. [DOI] [PMC free article] [PubMed] [Google Scholar]
- 13.Vehvilainen P, Hyytiainen M, Keski-Oja J. Latent transforming growth factor-β-binding protein 2 is an adhesion protein for melanoma cells. J Biol Chem. 2003;278(27):24705–13. doi: 10.1074/jbc.M212953200. [DOI] [PubMed] [Google Scholar]
- 14.Breidthardt T, Vanpoucke G, Potocki M, et al. The novel marker LTBP2 predicts all-cause and pulmonary death in patients with acute dyspnea. Clin Sci. 2012;123(9):557–66. doi: 10.1042/CS20120058. [DOI] [PubMed] [Google Scholar]
- 15.Robertson IB, Horiguchi M, Zilberberg L, et al. Latent TGF-β-binding proteins. Matrix Biol. 2015;47:44–53. doi: 10.1016/j.matbio.2015.05.005. [DOI] [PMC free article] [PubMed] [Google Scholar]
- 16.Turtoi A, Musmeci D, Wang Y, et al. Identification of novel accessible proteins bearing diagnostic and therapeutic potential in human pancreatic ductal adenocarcinoma. J Proteome Res. 2011;10(9):4302–13. doi: 10.1021/pr200527z. [DOI] [PubMed] [Google Scholar]
- 17.Kosuke Y, Atsushi T, Dai K, et al. Gene expression profiling of advanced-stage serous ovarian cancers distinguishes novel subclasses and implicates ZEB2 in tumor progression and prognosis. Cancer Sci. 2009;100(8):1421–28. doi: 10.1111/j.1349-7006.2009.01204.x. [DOI] [PMC free article] [PubMed] [Google Scholar]
- 18.Chen H, Ko JM, Wong VC, et al. LTBP-2 confers pleiotropic suppression and promotes dormancy in a growth factor permissive microenvironment in nasopharyngeal carcinoma. Cancer Lett. 2012;325(1):89–98. doi: 10.1016/j.canlet.2012.06.005. [DOI] [PubMed] [Google Scholar]
- 19.Roberts AB, Wakefield LM. The two faces of transforming growth factor beta in carcinogenesis. Proc Natl Acad Sci USA. 2003;100:8621–23. doi: 10.1073/pnas.1633291100. [DOI] [PMC free article] [PubMed] [Google Scholar]
- 20.Akhurst RJ, Derynck R. Tgf-beta signaling in cancer – a double-edged sword. Trends Cell Biol. 2001;11:S44–51. doi: 10.1016/s0962-8924(01)02130-4. [DOI] [PubMed] [Google Scholar]


