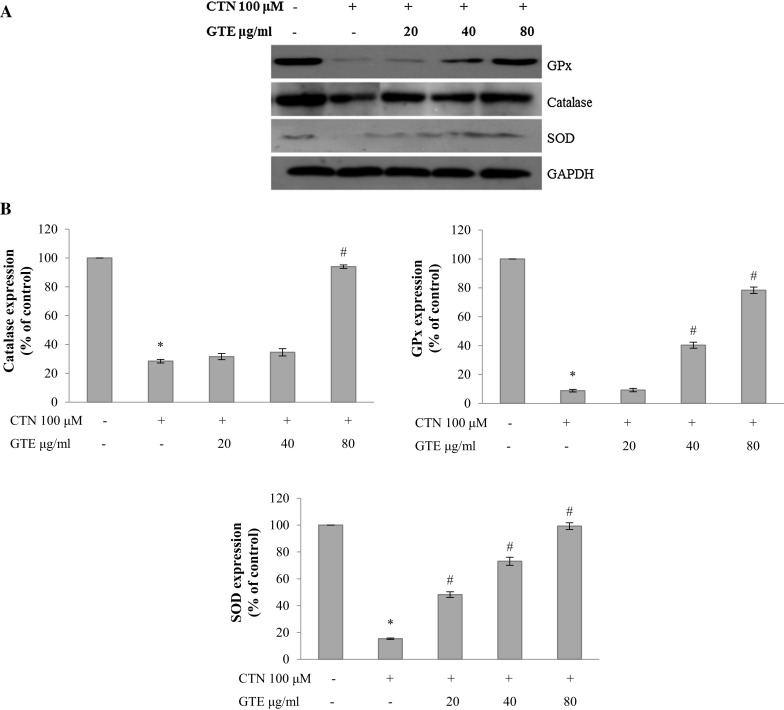
Fig. 10.

a Western blot analysis of oxidative stress marker proteins GPx, catalase and SOD, b densitometry analysis of GPx, catalase and SOD protein expression (% of control). Data are expressed as the mean ± standard deviation from three independent experiments. *p < 0.05 versus control cells, # p < 0.05 versus CTN treated cells
