

Abstract
We examined the patterns and variability of recovery post-stroke in multiple behavioral domains. A large cohort of first time stroke patients with heterogeneous lesions was studied prospectively and longitudinally at 1-2 weeks, 3 months and one year post-injury with structural MRI to measure lesion anatomy and in-depth neuropsychological assessment. Impairment was described at all timepoints by a few clusters of correlated deficits. The time course and magnitude of recovery was similar across domains, with change scores largely proportional to the initial deficit and most recovery occurring within the first three months. Damage to specific white matter tracts produced poorer recovery over several domains: attention and superior longitudinal fasciculus II/III, language and posterior arcuate fasciculus, motor and corticospinal tract. Finally, after accounting for the severity of the initial deficit, language and visual memory recovery/outcome was worse with lower education, while the occurrence of multiple deficits negatively impacted attention recovery.
Strokes cause behavioral deficits with different frequency: motor (80-85% of patients), somatosensory (40-50%), language or aphasia (20-25%), visual (15-20%), attention or neglect (25-30%), and memory (15-25%) 1-5. Stroke patients generally suffer from more than one deficit, and certain combinations of deficits occur more frequently than others, forming so called syndromes. Traditionally, dozens of syndromes have been reported, and the occurrence of correlated deficits is thought to reflect coupled damage by a vascular insult to cortical regions that are specialized for different domains, e.g. a left middle cerebral artery stroke causes a motor (Broca's) aphasia and right hemiparesis for concurrent damage of left inferior frontal cortex and precentral cortex.
However, behavioral work has shown that stroke deficits can be described at the population level by a few behavioral clusters of correlated deficits, with the underlying covariance structure suggesting impairment of distant cortical regions, often in different vascular distribution or even hemispheres 6-8. Behavioral deficits post-stroke are also associated with robust and consistent (both across subjects and brain regions) patterns of synchronization abnormalities, as measured by functional neuroimaging, that occur in networks of brain regions that are structurally spared by the stroke 9-14. Finally, the degree of damage to certain white matter tracts leads both to correlation of behavioral deficits 8 and to abnormal cortical synchronization 15,16. Therefore, this work indicates that the behavioral clusters of impairment measured acutely reflect the behavioral output of distributed brain networks that have been functionally affected by focal, stroke-induced structural damage.
In this study we examined the covariance of neurological deficits from acute to chronic stages of recovery in a large cohort of stroke patients to gain insight into the underlying mechanisms of dysfunction. If the correlation of behavioral deficits acutely reflects mainly local structural damage or vascular factors, e.g. edema or metabolic diaschisis, then as these non-neural factors improve in the weeks to months post-stroke, behavioral deficits should become less correlated. For example, a lesion in the dorsal white matter of the right hemisphere underneath the motor cortex may cause acutely both hemiparesis due to structural damage of the corticospinal tract, and hemispatial neglect secondary to edema of white matter fibers of passage. As the edema resolves, we would expect a faster and more significant recovery of neglect that resulting in a decrease in the correlation between motor and attention deficits. If, on the contrary, these clusters represent the behavioral output of a common, abnormal network state, then we expect a similar recovery over time of deficits in domains that belong to the same cluster. The identification of stable behavioral clusters that can be used for behavioral phenotyping would be highly significant for stroke studies of recovery, treatment, and genetics.
Recovery has most often been investigated in a single domain within selected patient groups with similar deficits or stroke topography. However, while the covariance of deficits during recovery has not been directly explored, some studies provide clues as to what might be found. For example, although most spontaneous recovery is thought to occur within the first three months post stroke irrespective of domain 17-21, several studies have reported that cognitive deficits continue to recover after 3 months post-stroke (eg aphasia: 22; neglect: 23). Large differences between sensory-motor and cognitive domains in the rate of recovery should lead to decreased correlation between sensory-motor and cognitive deficits as recovery proceeds.
Similarly the magnitude of recovery might differ greatly between domains, again leading to less correlated deficits and altering a patient's behavioral profile or phenotype. Recent work, however, has suggested a proportional rule according to which patients on average recover about 70% of their acute deficits, although this has been examined only in patients with motor or language deficits 24-29.
A second goal of this study was to examine which clinical or structural factors affect the degree of recovery or outcome, i.e. the final level of impairment. The influence of different variables on recovery is of considerable clinical interest in light of the growing need for accurate prognosis for treatment and resource planning in an ever more challenging health environment. Current prognostic criteria include level of acute impairment, age, and education. Moreover, some studies have found a correlation between outcome and damage to specific cortical or white matter regions (e.g. 28,30-32). However, no study has examined the influence of different variables on outcome across domains of function. Here we evaluated the influence of the following variables on recovery and outcome: 1) time post-stroke 17-20, 2) magnitude of acute deficit 33, 3) number of domains that showed impairment 34 4) demographic variables (e.g. education, age 22,35), 5) therapy 36, and 6) lesion volume and topography 37.
Results
Subjects (n = 172) with a first symptomatic stroke anywhere in the brain and clinical evidence of any neurological impairment were prospectively recruited, with n = 132 meeting post-enrollment inclusion. Subjects were tested approximately two weeks after their stroke (sub-acute, M=13.6 days, SD=4.8), and again at 3 months (M=112.0, SD=16.9) and 12 months (M=392.2, SD=52.4). A neurobehavioral battery and structural (T1/T2, Flair), functional (resting state), diffusion, and perfusion magnetic resonance imaging (MRI) scans were collected at each timepoint. Forty patients were excluded because of an inability to tolerate scans, excessive lacunae, artifacts, prior strokes or unidentifiable strokes. Of the final sample of 132 patients (mean age 54, standard deviation 11, range 19-83; 71 males; 68 left side lesions), 103 returned for a 3-month data point and 88 returned at 1 year (See figure S1 for enrollment information, Table S1 for demographics and clinical information).
Lesion volume varied greatly over patients (ranging from 0.03 cm3 to 82.97 cm3, with a mean volume of 10.15 cm3, standard deviation 13.94_cm3). Figure 1 shows the overlap of lesion topography across patients, with the highest overlap found in white matter and subcortical regions.
Figure 1.
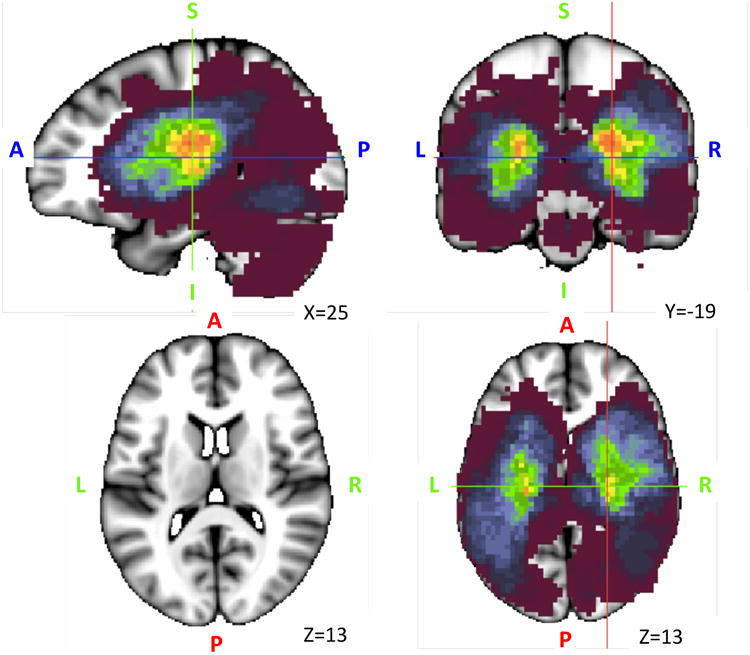
Lesion Anatomy. Lesion overlap of the sample of 132 stroke patients. The maximum overlap is 28 lesions and can be seen in sub-cortical white matter and basal ganglia regions.
Behavioral clusters in recovery
We first examined the pattern of correlation across deficits at each time point (2 weeks, 3 months, and 12 months) by running a principal component analysis (PCA). At 2 weeks, a 3-component solution accounted for 69% of the variance (Table 1): with the first component loading on language and spatial/verbal memory impairment; the second component loading on left motor impairment, left visuospatial attention, bilateral non-spatial (i.e. overall accuracy/reaction times) attention, and spatial memory consistent with right hemisphere damage; and, the third component loading on right motor impairment and attention shifting consistent with left hemisphere damage. When the same analysis was run at 3 months and 12 months we obtained the same 3-component structure, which accounted for similar degrees of behavioral variance (65% at 3 months; 62% at 12 months)(Table 1).
Table 1.
Higher order PCAs for the different measurement timepoints.
| 2 weeks | Variance expl: 69% | 3 Months | Variance expl: 65% | 1 year | Variance expl: 62% | ||||||
|---|---|---|---|---|---|---|---|---|---|---|---|
| Rotated component matrix | Rotated component matrix | Rotated component matrix | |||||||||
| Component | Component | Component | |||||||||
| 1 | 2 | 3 | 1 | 2 | 3 | 1 | 2 | 3 | |||
| Language | .880 | Language | .901 | Language | .897 | ||||||
| Memory: verbal | .892 | Memory: verbal | .859 | Memory: verbal | .559 | .505 | |||||
| Memory: spatial | .583 | .528 | Memory: spatial | .697 | Memory: spatial | .768 | |||||
| Motor: left limb | .773 | Motor: left limb | .825 | Motor: left limb | .726 | ||||||
| Motor: right limb | .849 | Motor: right limb | .855 | Motor: right limb | .722 | ||||||
| Attention: visual field | .841 | Attention: visual field | .743 | Attention: visual field | .648 | ||||||
| Attention: shifting | .693 | Attention: shifting | -.326 | .456 | Attention: shifting | .700 | |||||
| Attention: average | .636 | .308 | Attention: average | .644 | .490 | Attention: average | .745 | -.326 | |||
Figure 2 displays the correlations between deficits in different domains at 2-weeks and 3-months, with attention and motor deficits coded as contralateral and ipsilateral to the lesion. Initially two clusters are evident: one related to motor and attention impairments, and one related to language and memory impairments. The degree of correlation between language and spatial/verbal memory impairment is similar at the three time points. Interestingly, spatial memory is acutely correlated with both attention and motor impairments, but no longer at 3 or 12 months. At 12 months post stroke the initial cluster that showed correlations between spatial memory, motor and attention is no longer significantly present, suggesting a weakened relationship (Figure 2, see also Table 1).
Figure 2.
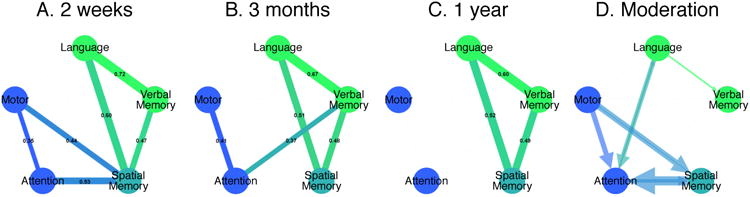
Behavioral clusters. The correlations between the domains at 2 weeks (A), 3 months (B) and 1 year (C) and the moderation of an 2 week deficit on the outcome of another at 3 months (D). P<0.05, Bonferroni corrected.
While the results at 2-weeks have been published 8, the new PCA results at 3 and 12 months confirm the presence of a few clusters of correlated behavioral deficits that account for the majority of variability (60-70%). Interestingly, while the presence of a left hemisphere and right hemisphere cluster of impairment had been previously reported by a similar data-driven correlation analysis of the NIHSS 6,7, a widely used impairment scale used in stroke care, the presence of a cognitive cluster that includes language and memory impairment is novel, and suggests that current assessments of impairment with the NIHSS should be integrated with more in-depth examination of language and memory, especially since this seems to be the most consistent over time.
Recovery of behavioral deficits across domains
Next, we examined the magnitude and time course of recovery for different deficits. In order to study these recovery variables more precisely we used individual component scores for each domain (motor, language, spatial attention, verbal and spatial memory). In previous work, we have shown that within each domain different deficits are strongly correlated so that one component accounts for the great majority of variability in each domain (60-80%).
Similarly to previous studies, we found that the severity of acute impairment was highly predictive of the degree of behavioral recovery. Patients with more severe acute impairment recovered the most in relative terms, although typically not achieving full recovery. In each domain, the correlation between acute impairment and the change in impairment (chronic minus acute) was high (r∼0.5-0.9) and strongly significant (Figure 3A). In order to study the degree of recovery net of acute impairment, we used a recovery ratio index formed by [improvement (chronic-acute scores)/acute impairment](Figure 3B), similarly to 26. The average recovery ratio was similar for language, spatial memory, and attention (0.62, 0.70, 0.70 respectively). Motor recovery was lower, 0.51 (0.58 if the 8 patients with complete hemiparesis were removed) and verbal memory showed even less recovery (0.38) (Figure 3C). None of the differences between domains were significant (F(4,75)=0.316, ns), but this null result may have reflected the variability of a ratio-based measure. When the magnitude of recovery was quantified by the percentage of patients who ended up within a normal range (2 SD of healthy controls), the motor domain showed significantly less recovery than spatial memory and attention (χ2(1)=15.73 and χ2(1)=9.88 respectively, p<.05, Bonferroni-corrected for ten comparisons (Figure 2D)).
Figure 3.
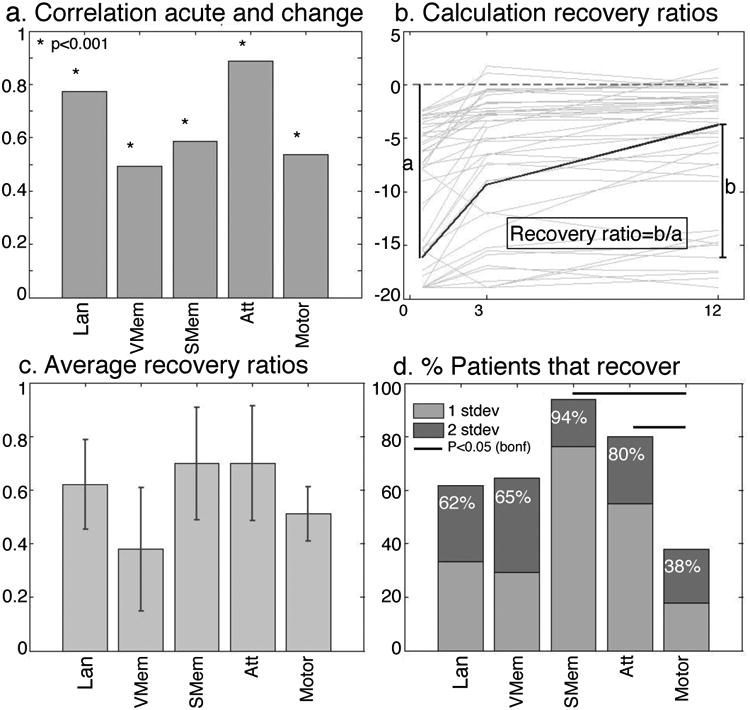
Magnitude of recovery. The correlations between acute and change scores (A) are high. The recovery ratio is calculated as change/total possible recovery (B) for each subject and averaged (C). A different measure of recovery is the number of patients with a deficit that recover to normal levels by 1 year (D). Lan: Language (N=96), V Mem: Verbal Memory(N=76), S Mem: Spatial Memory(N=76), Att: Attention (N=79), Motor (N=89).
The timecourse of recovery was also similar across domains. To study the time course of recovery in each domain, we divided the sample into patients with or without deficits based on a 2 SD cut-off in healthy subjects. For each domain there was a significant interaction between patients with and without a deficit over time, due to an increase in the performance of the deficit patients within the first three months towards the level of the no-deficit patients (Figure 4). Between 3 mo and 1 yr, only patients with language and motor deficits showed significant improvements, but the magnitude of the improvement was small. The differences between the deficit and no deficit groups remained significant for each of the domains at 1 year post stroke (Figure 4).
Figure 4.
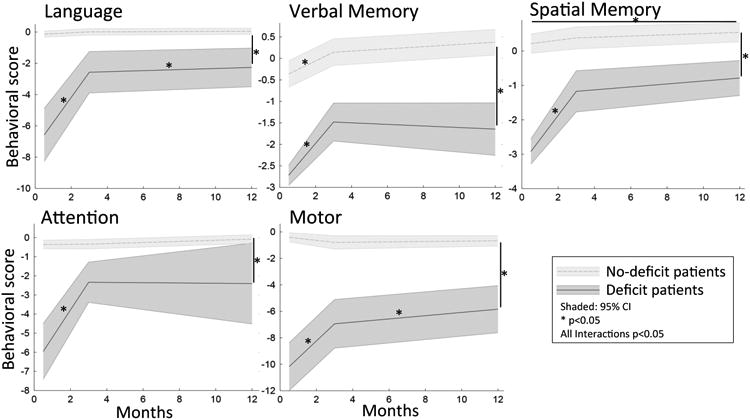
Time course of recovery. The recovery over the three timepoints is depicted for patients that did and did not have a deficit 2 weeks post stroke. Interactions between the two groups over time are significant for each domain (Lan: N=82, Mem: N=61, Att: N=66, Motor: N=69).
The similarity of the recovery curves across behavioral domains was statistically supported by a repeated measures ANOVA on the behavioral factor scores with time (sub-acute, 3 mo, 1 yr) and behavioral domain (language, verbal memory, spatial memory, attention, motor) as factors. The ANOVA identified a main effect of time (p<0.001), but no interaction between the different domains, indicating that the timecourse and extent of recovery was similar across the whole patient group for the different domains.
Overall these findings show that the rule of proportional recovery identified in motor and language domains in prior work 25-27,38 generalizes to all domains of function. Not only the magnitude but also the time course of recovery is similar across domains, notably for domains that are traditionally considered to improve at different rates, e.g. motor faster than language. Finally, consistent with the overall higher incidence of motor deficits, complete recovery is less common for motor than attention or spatial memory, even though verbal memory may show the least recovery across domains.
Prediction of behavioral outcome by clinical variables
Analyses were conducted to identify variables that predicted chronic behavior scores. Importantly, all analyses took into account the severity of the sub-acute deficit. For each behavioral domain a regression analysis was conducted in which the dependent measure was the 3 mo behavioral score, and the predictors were lesion size, age, education, therapy and the sub-acute behavioral score (see Table S4 for the relationships between behavioral variables and demographics). Each domain model was significant (p<0.001) and explained between 40 and 70%of the variance of the 3 mo scores (Table 2, see Table S3 for 1 year prediction). The sub-acute score was by far the most consistent and strongest predictor in each model (p<0.001). Additionally, lesion size and education were significant predictors of chronic language scores and lesion size of spatial memory score. Interestingly, age and hours of therapy were not significant in any of the models.
Table 2.
Prediction of 3 month scores using demographics and the acute score.
| Prediction of 3 Months Standardized β | |||||
|---|---|---|---|---|---|
|
| |||||
| Model 1 | Language | Verbal Mem | Spatial Mem | Motor | Attention |
|
|
|||||
| Lesion size | -0.196** | 0.033 | 0.232* | 0.036 | -0.061 |
| Age | -0.023 | -0.139 | -0.055 | -0.044 | -0.159 |
| Education (years) | 0.182** | 0.084 | 0.157 | 0.041 | -0.009 |
| Therapy (hours) | -0.074 | -0.114 | 0.010 | -0.049 | -0.081 |
| Sub-Acute score | 0.614** | 0.710** | 0.687** | 0.856** | 0.580** |
| Adjusted R² | 0.689** | 0.637** | 0.457** | 0.767** | 0.417** |
|
| |||||
| Model 2 | |||||
|
|
|||||
| Lesion size | 0.020 | 0.053 | -0.205 | -0.128 | 0.260 |
| Age | 0.007 | -0.122 | -0.059 | -0.037 | -0.076 |
| Education (years) | 0.168** | 0.141 | 0.203* | 0.026 | -0.057 |
| Therapy (hours) | -0.061 | -0.170 | -0.087 | -0.163 | -0.096 |
| Sub-Acute score | 0.425** | 0.689** | 0.665** | 0.773** | 0.579** |
| Lesion PC 1 | 0.087 | 0.163* | 0.710 | 0.085 | -0.397 |
| Lesion PC 2 | -0.257 | -0.062 | 0.485 | 0.055 | -0.250 |
| Lesion PC 3 | -0.314** | -0.213 | 0.002 | 0.093 | 0.091 |
| Lesion PC 4 | 0.066 | 0.043* | 0.475 | 0.063 | -0.250* |
| Lesion PC 5 | -0.075 | 0.077 | -0.119 | 0.059 | -0.072 |
| Lesion PC 6 | -0.027 | -0.164 | -0.138 | 0.030 | -0.060 |
| Lesion PC 7 | 0.109* | 0.062 | -0.186 | -0.064 | 0.103 |
| Lesion PC 8 | 0.098 | 0.074 | 0.280 | -0.195** | 0.142 |
| Lesion PC 9 | 0.021 | -0.084 | -0.010 | ||
| Lesion PC 10 | -0.012 | 0.191 | -0.199 | ||
| Lesion PC 11 | 0.058 | 0.299* | 0.286 | ||
| R² Change | 0.133** | 0.072 | 0.098 | 0.040* | 0.135* |
P<0.05
P<0.005
In a second model we examined the effect on outcome of having more than one deficit, and whether the outcome (after correcting for the acute deficit) of one domain was influenced by deficits in the other domains. About 1/3 of our patients had deficits in only one domain, while more than half had deficits in multiple domains (Figure S2). The effects of education, age, hours of therapy and lesion size (which correlates with number of deficits, r=0.22, p=0.012) were added as covariates of interest. For each patient, we entered the number of deficits as a moderator variable in a regression analysis that used the sub-acute scores to predict the 3 mo scores. The number of deficits showed a significant negative interaction with attention (t(46)=-2.76, p=0.008) and a marginal negative interaction with spatial memory (t(48)=-1.71, p=0.094), indicating that having multiple deficits negatively influenced the recovery of these functions. There was also a significant main effect of the number of deficits on language (t(48)=-2.52, p=0.015), indicating that the number of deficits negatively influenced the magnitude of the acute and chronic language deficit, but not the recovery of the language deficit. Interestingly, the presence of multiple deficits only affected the cognitive domains. No interaction effects were seen for motor deficits.
A moderation analysis was also done to specifically investigate the interactions of one deficit on the recovery of another. For example, when looking at language recovery by using the sub-acute deficit to predict 3-month outcome, the moderator attention influences the amount of recovery, indicating that lower sub-acute attention scores lead to worse recovery. This analysis shows that there are interactions between language and attention, spatial memory and attention as well as spatial memory and motor (p<0.05) in both directions i.e. sub-acute language moderates the recovery of attention and sub-acute attention moderates the recovery of language (Figure 2D). Furthermore, language deficits influence the recovery of verbal memory and motor deficits influence the recovery of attention, yet the reverse is not the case (Figure 2D). The cluster of motor, attention and spatial memory deficits that show strong correlations early on (Figure 2A) have moderation effects on each other's recovery, slightly changing these relationships over time. The cognitive cluster (language, spatial and verbal memory), does not show these moderation effects on outcome, and stay constant over time (Figure 2).
In summary, across all domains the magnitude of the initial deficit was the best predictor of chronic scores, but education level, number of deficits, and lesion size predicted chronic scores in specific cognitive domains (language, attention, spatial memory). The relationship with years of education in relation to language and spatial memory supports the idea that education can increase the capacity/efficiency of language and working memory networks, resulting in a greater ‘reserve’ in the face of injury 39-42.
Prediction of behavioral outcome by lesion topography
We separately examined the influence of lesion topography on prediction of chronic scores, with sub-acute score, lesion size, age, education, and hours of therapy as covariates. Therefore, the analysis identified the unique contribution of lesion topography to the prediction of chronic behavior. To reduce the dimensionality of the topography variable, a PCA was conducted on lesion locations across all subjects (Figure S3). Eleven lesion components explained more than 60% of the variance across all lesions in their original orientation, eight components when all lesions were flipped to the left hemisphere (Figure S3). The flipped components were used to predict motor and attention scores, which were coded independently of lesion side as contralesional/ipsilesional. (Figure S3).
Prediction of language recovery improved significantly using the ‘unflipped’ components (P<0.001, 13% variance explained), with a significant β for components three and seven (Table 3 and Figure S3). The regression weights (the β values) were used to create a weighted average of the lesions. The weighted lesion image (Figure 5) shows that better outcomes were predicted with left frontal lesions and worse outcomes with left temporo-parietal-occipital white matter and subcortical lesions. Subcortical lesions 43,44 as well as damage to the temporal cortex and underlying white matter [Dronkers, 2004] have previously been linked to worse aphasia. These locations have also been associated with language deficits in classic lesion work on 45. An analysis of the overlap of the lesion with the topography of atlas-based white matter tract shows poor language outcome for damage of the posterior and long segment of the arcuate fasciculus, SLF2, and inferior longitudinal fasciculus, posteriorly (Figure 5A-B).
Figure 5.
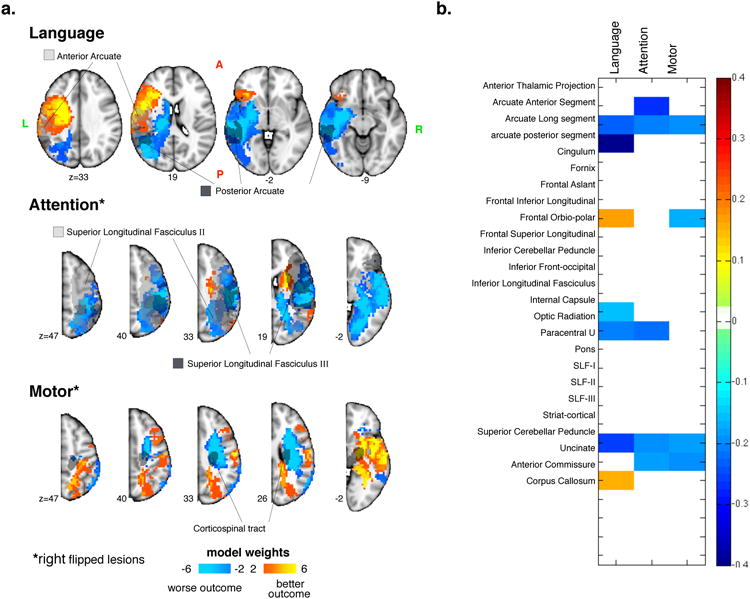
Behavior prediction based on lesion topography. Weighted maps of the top 60% lesion PC maps that significantly improve the prediction of chronic behavior above and beyond using age, lesion size, therapy, education and the acute score (a). The overlap of white matter tracts with the components (b).
The models using the flipped lesions significantly improved prediction of motor (P<0.05 4% variance explained) and attention scores (P<0.05, 14% variance explained). For motor deficits a significant β was found for the 8th component, with the weighted lesions predicting worse outcomes for patients with damage to the dorsal CST (Figure 5). The white matter pathway analysis showed weaker association with SLF3 and arcuate long segment. Interestingly, isolated damage to cortical motor and sensory regions was associated with good outcome.
For attention deficits a significant β was found for component 4 with the weighted lesions predicting worse recovery for patients with temporo-parietal 46-48 and occipital white matter 47,, but also superior temporal cortex 49 and inferior frontal gyrus 47,50. The white matter analysis shows overlap with SLF2 and 3 51-53 as well as arcuate 14,51.
For memory, no predictive effect of lesion topography on outcome was found, consistent with the poor predictive power of lesion topography on acute memory impairment 8.
Across domains this analysis reveals that classic lesion locations identified in prior lesion-symptom mapping studies do explain behavioral variance at the chronic stage. However the percentage of variance accounted for is relatively small as compared to that explained by the degree of acute impairment. It remains to be seen if functional patterns of abnormal synchronization found at the acute stage 14-16,54,55 that normalize chronically 56 can additionally contribute to outcome prediction.
A particularly novel and important result is the positive association between white matter damage and poor outcomes for language, attention, and motor (Figures 5A-B). In conjunction with the reported association between white matter damage and presence of multiple acute deficits 8, these findings highlight the importance of white matter damage in brain-behavior relationships, a point that has been ignored both in human work and animal models because of the emphasis on cortical lesions. This is consistent with the findings of Herbet and colleagues 57, who find that plasticity is high after cortical damage, but not after damage to white matter tracts.
Discussion
The starting point for this study was the discovery that the majority of variability in stroke deficits across several domains of function can be summarized by a few robust behavioral clusters8. Here we confirm this result, but more importantly show that these clusters represent robust phenotypes during the course of recovery from stroke, especially strongly present for the cognitive components. The description of these clusters, obtained by measuring behavior with an extensive neuropsychological battery designed to capture many of the dissociations reported in single or small case series is of interest to clinical researchers who often use coarser measures of impairment to describe recovery or outcome. We propose that a simplified version of our battery could be used as a sensitive and robust measure of individualized impairment in future population studies of genetics, recovery, and intervention in stroke.
From a theoretical standpoint, maintenance of a simple cluster structure of behavioral deficits all the way to 12 months post-stroke eliminates the possibility that these correlation are related to acute structural or vascular variables related to the ischemia or pressure caused by edema. The proportional recovery and similar time course between language and memory recovery, loading on the first component, and attention and motor recovery, loading on the second and third components, indicates that these clusters represent the behavioral output of a damaged neural system. Surprisingly, despite heterogeneity in lesion location and size, there remains a high degree of similarity in behavioral output across subjects. Previous work has shown that this cluster structure is independent of lesion size and location, but does relate to damage of regions of the white matter that contain multiple fiber tracts8. This damage causes cortical functional disconnection patterns that manifest as network-wide abnormalities of synchronization. Interestingly, focal lesions lead to a low dimensional simplification of neural synchronization patterns with a loss of inter-hemispheric correlation as well as a loss of intra-hemispheric modularity. The normalization of these patterns correlates with recovery of the behavioral deficits 56. These patterns of abnormal synchronization shortly after a stroke are associated with a loss of spatial entropy, i.e. the ability to generate many different neural states 15. Therefore focal lesions induce a simplification of neural states that corresponds to a low dimensionality of behavior.
The similar patterns of recovery across domains indicate the importance of common underlying biological mechanisms irrespective of cognitive domain. A number of different mechanisms have been identified including genetic activation, formation of new synapses and local connections, angiogenesis, synaptic re-weighting, and shifts in cortical maps 57. At the systems level the normalization of abnormal patterns of synchronization in brain networks also has been associated with recovery of function56. The critical period for this spontaneous recovery ends in humans around 90 days, and in rodents around 2 weeks post-stroke 58,59. This spontaneous recovery likely drives a large portion of initial recovery, with a relatively smaller effect of rehabilitation. However, enriched environments, intensive training, and experience may increase neural plasticity and network normalization during these first few months 60,61. Pharmacological therapeutics such as amphetamines or SSRIs may potentially improve or extend the duration of neuroplasticity 62,63. Finally, targeted neurostimulation, through TMS and tDCS, could influence local and distributed mechanisms of recovery 64,65.
In contrast to these common local and systems level mechanisms that account for the similar curves of recovery across domains, we found very specific interactions between behavioral deficits and recovery. For instance, the level of acute visuospatial attention impairment moderates the recovery of language, and vice versa. This indicates some hierarchical relationships between impairments that must be related to their normal or abnormal interactions in terms of brain functional and structural connectivity. It will be quite interesting to further examine these interactions in terms of the underlying brain organization or use these interactions to test the efficacy of rehabilitation methods, e.g. train attention to improve language.
Another important result of this study was the further demonstration of the importance of white matter damage in the pathogenesis of stroke. We recently reported that the most common distribution of stroke damage in a clinically relevant population involves the white matter and basal ganglia 8. We also found that white matter damage, through anatomical disconnection and common patterns of abnormal cortical synchrony 16, correlate with behavioral deficits in a few clusters that are relatively independent of lesion location. Here we show that white matter damage accounts for a significant amount of variance in explaining behavioral recovery of language, attention, and motor impairment. In contrast, damage of specific cortical locations accounts for much less variance. However, the importance of lesion data should not be overestimated. Relatively high accuracy of prediction (∼40-70%) is obtained based on clinical variables alone, among which acute impairment stands out. Notable also is the lack of effect of therapy (measured coarsely as number of hours received both inpatient and outpatient), and the presence of the effect of education on language and spatial memory recovery.
This study has also several limitations. Importantly, we are not tracking either perfusion or functional MRI data that could clarify other possible mechanisms of recovery. We have shown in work previously published 56,66 that cortical regions located in the same vascular distribution of a stroke can show hemodynamic lags in about 30% of patients sub-acutely. Interestingly these lags correlate with decreased blood flow (measured with ASL) and behavior. However, these hemodynamic effects only partially account for recovery, which is much more strongly related to normalization of cortical network synchronization that strongly correlates with decreased perfusion. Other biological processes could be influencing these effects as well as the thus far unexplained similarities and differences in behavioral recovery and future animal and human work is needed to identify and confirm these underlying mechanisms.
Another limitation is that the behavioral battery was a trade-off between completeness and feasibility. Some domains are either coarsely sampled (e.g executive function), while others are not measured at all (e.g. social cognition, emotions, theory of mind). We are currently enrolling a new cohort in which we plan to more accurately test these other domains to allow for a more complete evaluation of recovery within and between the different behavioral domains.
Finally, the current sample, though enrolled in an unselected manner, was younger than the general stroke population. This could influence the amount and speed of recovery, as older patients have been shown to recovery better and faster 18,19, but in our sample we do not fine a relationship between recovery and age. Importantly, we did not assess in this cohort the effect of genetic variants that could well account for possible differences in the degree of recovery, but would not likely affect the structure of behavioral deficits.
In conclusion, we show that a few clusters account for the majority of behavioral deficit variability in stroke, not only acutely but also in the course of recovery. These clusters should be used as phenotypes for behavioral characterization in large-scale studies of stroke. The severity of deficit remains the strongest predictor of behavioral recovery, but damage to specific white matter tracts and lower levels of education decrease recovery in a domain specific manner.
Methods
Subjects
Subjects (n = 172) were prospectively recruited, of whom 132 met post-enrollment inclusion criteria and 103 and 88 subjects returned for the subsequent measurements. Figure S1 shows the diagram of enrollment (CONSORT) for this study. All studies were approved by the Washington University Institutional Review Board. This cohort was used in a previous study on sub-acute deficits, not including any longitudinal data 8.
Inclusion Criteria
(1) Age 18 or greater. No upper age limit. (2) First symptomatic stroke, ischemic or hemorrhagic. (3) Up to two lacunes, clinically silent, less than 15 mm in size on CT scan. (4) Clinical evidence of motor, language, attention, visual, or memory deficits based on neurological examination. (5) Time of enrollment: < 2 weeks from stroke onset. (6) Awake, alert, and capable of participating in research.
Exclusion criteria
(1) Previous stroke based on clinical imaging. (2) Multifocal strokes. (3) Inability to maintain wakefulness in the course of testing. (4) Presence of other neurological, psychiatric or medical conditions that preclude active participation in research and/or may alter the interpretation of the behavioral/imaging studies (e.g., dementia, schizophrenia), or limit life expectancy to less than 1 year (e.g., cancer or congestive heart failure class IV). (5) Report of claustrophobia or metal object in body.
A healthy control group (n = 31) was matched with the study sample for age, gender, and years of education. A larger control group (n = 1,209) was selected from a clinical database (n = 6,260) using the same inclusion/exclusion criteria. Stroke patients and controls provided informed consent according to procedures approved by the Washington University Institutional Review Board.
Behavioral assessment
Subjects were tested approximately two weeks after their stroke, and again at 3 months and 12 months post stroke. These time points were selected based on previous observations that most deficits recover within 3 months, while some studies suggest additional recovery up to 1 year. Data was collected twice in the healthy controls, 3 months apart.
A comprehensive battery of 44 behavioral tests across four behavioral domains, language, memory, motor and attention as well as visual perimetry information were collected (table S2, and 8). These domains were chosen to represent a wide range of the most commonly identified deficits in people after a stroke. Within each domain a range of measures was chosen to represent the different components of that domain, e.g. auditory comprehension, speech production, reading both at single word and sentence level for language; proximal/distal upper and lower extremity measures of strength, coordination, dexterity, function for motor including, for instance, separate tests for reaching or grasping; spatial as well as verbal memory, including short- and long-term, encoding, recognition, and retrieval; and, spatial and non-spatial aspects of visual attention. The animal naming and backward spatial span measures also measure aspects of executive functioning.
Lesions
Lesions were manually segmented using Analyze biomedical imaging software (wwww.mayo.edu) by inspecting all structural images (MP-RAGE, T2 and FLAIR) in atlas space and distinguishing the lesion from healthy tissue, CSF and surrounding vasogenic edema. Each lesion segmentation was independently checked by two neurologists (Alex Carter, MD and MC), and was manually classified as subcortical, cortical, cortical & subcortical, brainstem or cerebellar.
Analysis
Behavioral data reduction
A principal component analysis (PCA) with oblique rotation was applied to the 2 week behavioral data collected in the stroke patients within each of the domains in order to reduce the number of variables to a smaller number of meaningful components 8. Oblique rotation was used, because we did not want to force these components to be orthogonal. Components had to satisfy two criteria: (1) the eigenvalues had to be > 1; (2) the percentage of variance accounted for had to be > 10%. This procedure resulted in one component for language, one for motor and two for memory (verbal, spatial). The structure within the attention domain was less clear. After inspection of different results, a three-component solution was chosen. The first component, which included visual field and general attention measures, which encompasses both general attention as well as visuospatial lateralized attention, was used as our attention measure. Therefore, the behavioral recovery analysis was based on five factors: Language, Motor (independent of side), Verbal Memory, Spatial Memory, and Attention.
For motor, a separate PCA analysis was also done in which behavior was coded by left and right limb rather than ipsilesional and contralesional limb, resulting in a two component solution with one factor for left limb deficits and one for right limb deficits. This two factor solution was only used in the following higher order PCA analysis. A higher-order principal component analysis was conducted on the components that resulted from the within-domain analyses, language, verbal memory, spatial memory, the 3 attention components and the left and right limb motor components. Since the correlations between the resulting components were low, and the results were similar for oblique and orthogonal rotations, we choose to use orthogonal rotations, which are easier to interpret.
The distributions of some of the variables were not normal and could not be made normal through transformation. To ensure this is not influencing our results we compared the correlations between the variables using a Pearson's correlation and a rank order correlation (Spearman's Rho) and we replicated the within domain principal component analyses using rank-order correlation (Spearman's Rho), resulting in similar components.
To ensure comparability, the component scores for subsequent time points and for the age matched controls were generated by normalizing these scores based on the sub-acute values and then re-creating the component scores using the weights generated by the principal component analysis on the 2 week scores. Each of the components, at each of the time-points, was z-scored based on the first measurement of the healthy control group. This made the scores meaningful with 0 being healthy (the mean of the controls) and the measured values being in standard deviations away from this mean. This procedure allowed for comparisons across timepoints and behavioral domains.
Recovery analyses
The amount of recovery depends on the initial deficit. To take this into account a recovery ratio was calculated for each patient for each behavioral domain. The recovery ration is calculated by dividing the total recovery (chronic score – acute score) by the maximum recovery possible (control average – acute deficit) (Figure 2B). These values were averaged the ratio across patients to determine the recovery ratio for each of the behavioral domains.
Patients with a score 2 standard deviations below the mean of controls were identified as having a deficit, while patients with “no deficit” had scores within 2 standard deviations of healthy controls. For each behavioral factor, we conducted an ANOVA across the three timepoints comparing patients that did vs. did not have a deficit at the sub-acute stage. If the interaction was significant, post-hoc testing was used to test contrasts involving particular timepoints and groups. This analysis tested the hypothesis that recovery in different domains has a similar or different time course, i.e. specifically whether cognitive deficits recover more slowly than sensory motor deficits.
An ANOVA was conducted on the behavior scores in all patients, with the three timepoints and five behavioral domains as independent variables to test our hypothesis that the timecourse of recovery was similar for each of the different behavioral factors. To confirm that the relationship between the different behavioral deficits stayed the same over time, the correlations between the domains for both the acute and 3 month scores as well as change scores were calculated. To further investigate the similarity over time of the relationships between domains, we conducted the higher order principal component analysis on the 3 and 12 months post stroke measurements as well as on the acute timepoint.
Prediction of chronic behavior
Chronic scores were predicted using lesion size, age, education and hours of therapy. A linear regression model with lesion size, age, education and hours of rehabilitation (including physical, occupational, speech) as independent variables was used to predict the 3 or 12 month scores of each of the 5 domains (language, attention, motor, verbal memory and spatial memory). Each patients' 2 week score for the domain was also included in the model since acute scores have been shown to be excellent predictors of recovery. For each of these predictors the beta weight and its significance in the model was determined to test our hypothesis that different predictors are important for different behavioral variables.
Effects of multiple deficits
We hypothesized that the presence of multiple deficits would negatively influence a patient's recovery. To test this hypothesis, a moderation analysis was used to investigate if (after controlling for age, lesion size and education) the presence of more deficits interacted with the amount of recovery. In a moderation analysis the hypothesis that a variable (the moderator) changes the effect of a predictor(s) on outcome is tested as in an interaction. If the moderator effect is significant (i.e. interaction), then the moderator variable affects the amount of recovery between the 2 week and chronic time-point. In patients that had a behavioral score for each of the domains (language, spatial memory, verbal memory, visual field attention and motor; N=43), the number of deficits was added as a moderator variable in the regression analysis, allowing us to test the hypothesis that having multiple deficits decreases the amount of recovery.
Lesion analysis
To provide low-dimensional information about lesion location for deficit recovery models we conducted a PCA on lesion locations across all subjects 8. This was done for all lesions in their respective hemisphere for the prediction of behavioral domains that are scored independent of lesionside (aphasia, verbal and spatial memory) and for all lesions flipped to the left for the behavioral measures that were scored based on lesion side (attention and motor). The loadings on each of the included components for each subject were added to the prediction model that included age, lesionsize, education, therapy and the 2 week score. The number of components was limited to the number of components that explained more than 60% of the variance. If the addition of these components to the model was significant, this suggests that the lesion location is important in the prediction of the outcome for that behavioral domain. For the domains in which the addition was significant the beta values for each lesion component were used to create a weighted image of the components to visualize the lesion locations of importance.
Data availability
The data that support the findings of this study are available from the corresponding author upon reasonable request.
Supplementary Material
Acknowledgments
The authors received funding from the following grants: R01 HD061117-05 and R01 NS095741 (M.C)
Footnotes
Author Contributions: Study concept and design by M.C., G.S., L.R. and C.L. Data acquisition was done by L.R and J.S. Analysis was done by L.R., J.S. and M.S. The manuscript was written by L.R., M.C. and G.S.
Competing Financial Interests: The authors declare no competing financial interests.
References
- 1.Ringman JM, Saver JL, Woolson RF, Clarke WR, Adams HP. Frequency, risk factors, anatomy, and course of unilateral neglect in an acute stroke cohort. Neurology. 2004;63:468–474. doi: 10.1212/01.wnl.0000133011.10689.ce. [DOI] [PubMed] [Google Scholar]
- 2.Nys GMS, et al. Cognitive disorders in acute stroke: prevalence and clinical determinants. Cerebrovasc Dis. 2007;23:408–416. doi: 10.1159/000101464. [DOI] [PubMed] [Google Scholar]
- 3.Appelros P, Karlsson GM, Seiger A, Nydevik I. Neglect and anosognosia after first-ever stroke: incidence and relationship to disability. Acta Derm Venereol. 2002;34:215–220. doi: 10.1080/165019702760279206. [DOI] [PubMed] [Google Scholar]
- 4.Buxbaum LJ, et al. Hemispatial neglect: Subtypes, neuroanatomy, and disability. Neurology. 2004;62:749–756. doi: 10.1212/01.wnl.0000113730.73031.f4. [DOI] [PubMed] [Google Scholar]
- 5.Rathore SS, Hinn AR, Cooper LS, Tyroler HA, Rosamond WD. Characterization of incident stroke signs and symptoms: findings from the atherosclerosis risk in communities study. Stroke. 2002;33:2718–2721. doi: 10.1161/01.str.0000035286.87503.31. [DOI] [PubMed] [Google Scholar]
- 6.Zandieh A, et al. The Underlying Factor Structure of National Institutes of Health Stroke Scale: An Exploratory Factor Analysis. International Journal of Neuroscience. 2011;122:140–144. doi: 10.3109/00207454.2011.633721. [DOI] [PubMed] [Google Scholar]
- 7.Lyden P, Claesson L, Havstad S, Ashwood T, Lu M. Factor analysis of the National Institutes of Health Stroke Scale in patients with large strokes. Arch Neurol. 2004;61:1677–1680. doi: 10.1001/archneur.61.11.1677. [DOI] [PubMed] [Google Scholar]
- 8.Corbetta M, et al. Common behavioral clusters and subcortical anatomy in stroke. Neuron. 2015;85:927–941. doi: 10.1016/j.neuron.2015.02.027. [DOI] [PMC free article] [PubMed] [Google Scholar]
- 9.Carter AR, et al. Resting state inter-hemispheric fMRI connectivity predicts performance after stroke. Annals of neurology. 2009:NA–NA. doi: 10.1002/ana.21905. [DOI] [PMC free article] [PubMed] [Google Scholar]
- 10.Wang Y, Chen H, Gong Q, Shen S, Gao Q. Analysis of functional networks involved in motor execution and motorimagery using combined hierarchical clustering analysis andindependent component analysis. Magnetic resonance imaging. 2010;28:653–660. doi: 10.1016/j.mri.2010.02.008. [DOI] [PubMed] [Google Scholar]
- 11.Urbin MA, Hong X, Lang CE, Carter AR. Resting-State Functional Connectivity and Its Association With Multiple Domains of Upper-Extremity Function in Chronic Stroke. Neurorehabilitation and Neural Repair. 2014 doi: 10.1177/1545968314522349. [DOI] [PMC free article] [PubMed] [Google Scholar]
- 12.Ovadia-Caro S, et al. Longitudinal effects of lesions on functional networks after stroke. Journal of Cerebral Blood Flow & Metabolism. 2013 doi: 10.1038/jcbfm.2013.80. [DOI] [PMC free article] [PubMed] [Google Scholar]
- 13.van Meer MPA, et al. Recovery of Sensorimotor Function after Experimental Stroke Correlates with Restoration of Resting-State Interhemispheric Functional Connectivity. Journal of Neuroscience. 2010;30:3964–3972. doi: 10.1523/JNEUROSCI.5709-09.2010. [DOI] [PMC free article] [PubMed] [Google Scholar]
- 14.He BJ, et al. Breakdown of Functional Connectivity in Frontoparietal Networks Underlies Behavioral Deficits in Spatial Neglect. Neuron. 2007;53:905–918. doi: 10.1016/j.neuron.2007.02.013. [DOI] [PubMed] [Google Scholar]
- 15.Baldassarre A, et al. Large-scale changes in network interactions as a physiological signature of spatial neglect. Brain. 2014;137:3267–3283. doi: 10.1093/brain/awu297. [DOI] [PMC free article] [PubMed] [Google Scholar]
- 16.Siegel JS, et al. Disruptions of network connectivity predict impairment in multiple behavioral domains after stroke. Proc Natl Acad Sci USA. 2016 doi: 10.1073/pnas.1521083113. 201521083. [DOI] [PMC free article] [PubMed] [Google Scholar]
- 17.Skilbeck CE, Wade DT, Hewer RL, Wood VA. Recovery after stroke. Journal of neurology. 1983;46:5–8. doi: 10.1136/jnnp.46.1.5. [DOI] [PMC free article] [PubMed] [Google Scholar]
- 18.Kotila M, Waltimo O, Niemi ML, Laaksonen R, Lempinen M. The profile of recovery from stroke and factors influencing outcome. Stroke. 1984;15:1039–1044. doi: 10.1161/01.str.15.6.1039. [DOI] [PubMed] [Google Scholar]
- 19.Wade DT, Wood VA, Hewer RL. Recovery after stroke--the first 3 months. Journal of Neurology, Neurosurgery & Psychiatry. 1985;48:7–13. doi: 10.1136/jnnp.48.1.7. [DOI] [PMC free article] [PubMed] [Google Scholar]
- 20.Duncan PW, et al. Similar motor recovery of upper and lower extremities after stroke. Stroke. 1994;25:1181–1188. doi: 10.1161/01.str.25.6.1181. [DOI] [PubMed] [Google Scholar]
- 21.Stone SP, Patel P, Greenwood RJ, Halligan PW. Measuring visual neglect in acute stroke and predicting its recovery: the visual neglect recovery index. Journal of Neurology, Neurosurgery & Psychiatry. 1992;55:431–436. doi: 10.1136/jnnp.55.6.431. [DOI] [PMC free article] [PubMed] [Google Scholar]
- 22.Kertesz A, McCabe P. Recovery patterns and prognosis in aphasia. Brain. 1977;100 Pt 1:1–18. doi: 10.1093/brain/100.1.1. [DOI] [PubMed] [Google Scholar]
- 23.Levine DN, Warach JD, Benowitz L, Calvanio R. Left spatial neglect: effects of lesion size and premorbid brain atrophy on severity and recovery following right cerebral infarction. Neurology. 1986;36:362–366. doi: 10.1212/wnl.36.3.362. [DOI] [PubMed] [Google Scholar]
- 24.Hendricks HT, van Limbeek J, Geurts AC, Zwarts MJ. Motor recovery after stroke: a systematic review of the literature. YAPMR. 2002;83:1629–1637. doi: 10.1053/apmr.2002.35473. [DOI] [PubMed] [Google Scholar]
- 25.Prabhakaran S, et al. Inter-individual Variability in the Capacity for Motor Recovery After Ischemic Stroke. Neurorehabilitation and Neural Repair. 2007;22:64–71. doi: 10.1177/1545968307305302. [DOI] [PubMed] [Google Scholar]
- 26.Lazar RM, et al. Improvement in Aphasia Scores After Stroke Is Well Predicted by Initial Severity. Stroke. 2010;41:1485–1488. doi: 10.1161/STROKEAHA.109.577338. [DOI] [PMC free article] [PubMed] [Google Scholar]
- 27.Coupar F, Pollock A, Rowe P, Weir C, Langhorne P. Predictors of upper limb recovery after stroke: a systematic review and meta-analysis. clin rehabil. 2012;26:291–313. doi: 10.1177/0269215511420305. [DOI] [PubMed] [Google Scholar]
- 28.Karnath HO, Rennig J, Johannsen L, Rorden C. The anatomy underlying acute versus chronic spatial neglect: a longitudinal study. Brain. 2011;134:903–912. doi: 10.1093/brain/awq355. [DOI] [PMC free article] [PubMed] [Google Scholar]
- 29.Rengachary J, He BJ, Shulman GL, Corbetta M. A behavioral analysis of spatial neglect and its recovery after stroke. Front Hum Neurosci. 2011;5:29. doi: 10.3389/fnhum.2011.00029. [DOI] [PMC free article] [PubMed] [Google Scholar]
- 30.Dronkers NF, Wilkins DP, Van Valin RD, Jr, Redfern BB, Jaeger JJ. Lesion analysis of the brain areas involved in language comprehension. Cognition. 2004;92:145–177. doi: 10.1016/j.cognition.2003.11.002. [DOI] [PubMed] [Google Scholar]
- 31.Lo R, Gitelman D, Levy R, Hulvershorn J, Parrish T. Identification of critical areas for motor function recovery in chronic stroke subjects using voxel-based lesion symptom mapping. NeuroImage. 2010;49:9–18. doi: 10.1016/j.neuroimage.2009.08.044. [DOI] [PubMed] [Google Scholar]
- 32.Schaechter JD, et al. Microstructural status of ipsilesional and contralesional corticospinal tract correlates with motor skill in chronic stroke patients. Human brain mapping. 2009;30:3461–3474. doi: 10.1002/hbm.20770. [DOI] [PMC free article] [PubMed] [Google Scholar]
- 33.Duncan PW, Goldstein LB, Matchar D, Divine GW, Feussner J. Measurement of motor recovery after stroke. Outcome assessment and sample size requirements. Stroke. 1992;23:1084–1089. doi: 10.1161/01.str.23.8.1084. [DOI] [PubMed] [Google Scholar]
- 34.Nijboer TCW, Kollen BJ, Kwakkel G. The Impact of Recovery of Visuo-Spatial Neglect on Motor Recovery of the Upper Paretic Limb after Stroke. PLoS ONE. 2014;9:e100584. doi: 10.1371/journal.pone.0100584. [DOI] [PMC free article] [PubMed] [Google Scholar]
- 35.Pedersen PM, Stig Jorgensen H, Nakayama H, Raaschou HO, Olsen TS. Aphasia in acute stroke: Incidence, determinants, and recovery. Annals of neurology. 1995;38:659–666. doi: 10.1002/ana.410380416. [DOI] [PubMed] [Google Scholar]
- 36.Sunderland A, et al. Enhanced physical therapy improves recovery of arm function after stroke. A randomised controlled trial. Journal of Neurology, Neurosurgery & Psychiatry. 1992;55:530–535. doi: 10.1136/jnnp.55.7.530. [DOI] [PMC free article] [PubMed] [Google Scholar]
- 37.Lövblad KO, et al. Ischemic lesion volumes in acute stroke by diffusion-weighted magnetic resonance imaging correlate with clinical outcome. Annals of neurology. 1997;42:164–170. doi: 10.1002/ana.410420206. [DOI] [PubMed] [Google Scholar]
- 38.Winters C, van Wegen EEH, Daffertshofer A, Kwakkel G. Generalizability of the Proportional Recovery Model for the Upper Extremity After an Ischemic Stroke. Neurorehabilitation and Neural Repair. 2015;29:614–622. doi: 10.1177/1545968314562115. [DOI] [PubMed] [Google Scholar]
- 39.Staff RT, Murray AD, Deary IJ, Whalley LJ. What provides cerebral reserve? Brain. 2004;127:1191–1199. doi: 10.1093/brain/awh144. [DOI] [PubMed] [Google Scholar]
- 40.Perneczky R, Diehl-Schmid J, Pohl C, Drzezga A, Kurz A. Non-fluent progressive aphasia: Cerebral metabolic patterns and brain reserve. Brain Res. 2007;1133:178–185. doi: 10.1016/j.brainres.2006.11.054. [DOI] [PubMed] [Google Scholar]
- 41.González-Fernández M, et al. Formal education, socioeconomic status, and the severity of aphasia after stroke. YAPMR. 2011;92:1809–1813. doi: 10.1016/j.apmr.2011.05.026. [DOI] [PMC free article] [PubMed] [Google Scholar]
- 42.Connor LT, Obler LK, Tocco M, Fitzpatrick PM, Albert ML. Effect of Socioeconomic Status on Aphasia Severity and Recovery. Brain and Language. 2001;78:254–257. doi: 10.1006/brln.2001.2459. [DOI] [PubMed] [Google Scholar]
- 43.Naeser MA, et al. Aphasia With Predominantly Subcortical Lesion Sites: Description of Three Capsular/Putaminal Aphasia Syndromes. Arch Neurol. 1982;39:2–14. doi: 10.1001/archneur.1982.00510130004002. [DOI] [PubMed] [Google Scholar]
- 44.Alexander MP, Naeser MA, PALUMBO CL. Correlations of subcorticalct lesion sites and aphasia profiles. Brain. 1987;110:961–988. doi: 10.1093/brain/110.4.961. [DOI] [PubMed] [Google Scholar]
- 45.Damasio AR, Damasio H. Brain and language. Sci Am. 1992;267:88–95. doi: 10.1038/scientificamerican0992-88. [DOI] [PubMed] [Google Scholar]
- 46.Ptak R, Schnider A. The attention network of the human brain: Relating structural damage associated with spatial neglect to functional imaging correlates of spatial attention. Neuropsychologia. 2011;49:3063–3070. doi: 10.1016/j.neuropsychologia.2011.07.008. [DOI] [PubMed] [Google Scholar]
- 47.Mort DJ, et al. The anatomy of visual neglect. Brain. 2003;126:1986–1997. doi: 10.1093/brain/awg200. [DOI] [PubMed] [Google Scholar]
- 48.Rorden C, Karnath HO. Using human brain lesions to infer function: a relic from a past era in the fMRI age? Nat Rev Neurosci. 2004;5:813–819. doi: 10.1038/nrn1521. [DOI] [PubMed] [Google Scholar]
- 49.Karnath HO, et al. Normalized perfusion MRI to identify common areas of dysfunction: patients with basal ganglia neglect. Brain. 2005;128:2462–2469. doi: 10.1093/brain/awh629. [DOI] [PubMed] [Google Scholar]
- 50.Husain M, Rorden C. Non-spatially lateralized mechanisms in hemispatial neglect. Nat Rev Neurosci. 2003;4:26–36. doi: 10.1038/nrn1005. [DOI] [PubMed] [Google Scholar]
- 51.De Schotten MT, et al. Damage to White Matter Pathways in Subacute and Chronic Spatial Neglect: A Group Study and 2 Single-Case Studies with Complete Virtual ‘In Vivo’ Tractography Dissection. Cerebral Cortex. 2014;24:691–706. doi: 10.1093/cercor/bhs351. [DOI] [PubMed] [Google Scholar]
- 52.Doricchi F, Thiebaut de Schotten M, Tomaiuolo F, Bartolomeo P. White matter (dis) connections and gray matter (dys) functions in visual neglect: gaining insights into the brain networks of spatial awareness. CORTEX. 2008;44:983–995. doi: 10.1016/j.cortex.2008.03.006. [DOI] [PubMed] [Google Scholar]
- 53.Bartolomeo P, Thiebaut de Schotten M, Doricchi F. Left Unilateral Neglect as a Disconnection Syndrome. Cerebral Cortex. 2007;17:2479–2490. doi: 10.1093/cercor/bhl181. [DOI] [PubMed] [Google Scholar]
- 54.Carter AR, et al. Resting interhemispheric functional magnetic resonance imaging connectivity predicts performance after stroke. Annals of neurology. 2010;67:365–375. doi: 10.1002/ana.21905. [DOI] [PMC free article] [PubMed] [Google Scholar]
- 55.Wang L, et al. Dynamic functional reorganization of the motor execution network after stroke. Brain. 2010;133:1224–1238. doi: 10.1093/brain/awq043. [DOI] [PubMed] [Google Scholar]
- 56.Ramsey LE, et al. Normalization of network connectivity in hemispatial neglect recovery. Annals of neurology. 2016;80:127–141. doi: 10.1002/ana.24690. [DOI] [PMC free article] [PubMed] [Google Scholar]
- 57.Kwakkel G, Kollen B, Twisk J. Impact of time on improvement of outcome after stroke. Stroke. 2006;37:2348–2353. doi: 10.1161/01.STR.0000238594.91938.1e. [DOI] [PubMed] [Google Scholar]
- 58.Murphy TH, Corbett D. Plasticity during stroke recovery: from synapse to behaviour. Nat Rev Neurosci. 2009 doi: 10.1038/nrn2735. [DOI] [PubMed] [Google Scholar]
- 59.Ge S, Yang CH, Hsu KS, Ming GL, Song H. A critical period for enhanced synaptic plasticity in newly generated neurons of the adult brain. Neuron. 2007;54:559–566. doi: 10.1016/j.neuron.2007.05.002. [DOI] [PMC free article] [PubMed] [Google Scholar]
- 60.Biernaskie J. Efficacy of Rehabilitative Experience Declines with Time after Focal Ischemic Brain Injury. Journal of Neuroscience. 2004;24:1245–1254. doi: 10.1523/JNEUROSCI.3834-03.2004. [DOI] [PMC free article] [PubMed] [Google Scholar]
- 61.Dromerick AW, et al. Critical periods after stroke study: translating animal stroke recovery experiments into a clinical trial. Front Hum Neurosci. 2015;9:1–13. doi: 10.3389/fnhum.2015.00231. [DOI] [PMC free article] [PubMed] [Google Scholar]
- 62.Chollet F, et al. Fluoxetine for motor recovery after acute ischaemic stroke (FLAME): a randomised placebo-controlled trial. The Lancet Neurology. 2011;10:123–130. doi: 10.1016/S1474-4422(10)70314-8. [DOI] [PubMed] [Google Scholar]
- 63.Ng KL, et al. Fluoxetine Maintains a State of Heightened Responsiveness to Motor Training Early After Stroke in a Mouse Model. Stroke. 2015;46:2951–2960. doi: 10.1161/STROKEAHA.115.010471. [DOI] [PMC free article] [PubMed] [Google Scholar]
- 64.Fox MD, Halko MA, Eldaief MC, Pascual-Leone A. Measuring and manipulating brain connectivity with resting state functional connectivity magnetic resonance imaging (fcMRI) and transcranial magnetic stimulation (TMS) NeuroImage. 2012;62:2232–2243. doi: 10.1016/j.neuroimage.2012.03.035. [DOI] [PMC free article] [PubMed] [Google Scholar]
- 65.Liew SL, Santarnecchi E, Buch ER, Cohen LG. Non-invasive brain stimulation in neurorehabilitation: local and distant effects for motor recovery. Front Hum Neurosci. 2014;8:378. doi: 10.3389/fnhum.2014.00378. [DOI] [PMC free article] [PubMed] [Google Scholar]
- 66.Siegel JS, Snyder AZ, Ramsey L, Shulman GL, Corbetta M. The effects of hemodynamic lag on functional connectivity and behavior after stroke. J Cereb Blood Flow Metab. 2015 doi: 10.1177/0271678×15614846. [DOI] [PMC free article] [PubMed] [Google Scholar]
Associated Data
This section collects any data citations, data availability statements, or supplementary materials included in this article.
Supplementary Materials
Data Availability Statement
The data that support the findings of this study are available from the corresponding author upon reasonable request.