

Abstract
Background
The Korean War GI Bill provided socio-economic benefits to veterans, however its association with health is unclear; we hypothesize GI Bill eligibility is associated with fewer depressive symptoms and smaller disparities.
Methods
Data from 246 Korean War GI Bill eligible veterans and 240 non-veterans from the Health and Retirement Study were matched on birth year, southern birth, race, height, and childhood health using coarsened exact matching. Number of depressive symptoms in 2010 (average age=78) were assessed using a modified, validated Center for Epidemiologic Studies-Depression Scale, dichotomized to reflect elevated depressive symptoms. Regression analyses were stratified into low (at least one parent < 8 years schooling / missing data, N=167) or high (both parents ≥ 8 years schooling, N=319) childhood socio-economic status (cSES) groups.
Results
Korean War GI Bill eligibility predicted fewer depressive symptoms among individuals from low cSES backgrounds [β=-0.64, 95% Confidence Interval (CI):(-1.18, -0.09), p=0.022]. Socio-economic disparities were smaller among veterans than non-veterans for number of depressive symptoms [β=-0.76, 95% (CI):(-1.33, -0.18), P = 0.010] and elevated depressive symptoms [β=-11.7, 95%CI:(-8.2, -22.6), P = 0.035].
Conclusions
Korean War GI Bill eligibility predicted smaller socio-economic disparities in depression markers.
Keywords: Depression, GI Bill, Health disparities, Korean War, Lifecourse, Socio-economic status, Veterans
PURPOSE
Each year the United States pays double the health care costs of other developed countries per capita ($8,745 vs. $3,484) [1]. Despite this huge contribution to the treatment of disease, socio-economic health disparities in the US remain the largest in the developed world [2] partially because medical care accounts for just 10% of the variability in health outcomes [3], while social and behavioral factors account for approximately 55% of the total variation in health [4]. Although the potential for social and behavioral interventions to affect health may be much larger than the impact of medical interventions, health evaluations of population-level social interventions are scarce [4]. This study investigates the association between a social policy, Korean War GI Bill eligibility (detailed in the text box), and markers for depression.
Text Box. The Korean War GI Bill.
The Korean War GI Bill, formally called “The Veterans’ Readjustment and Assistance Act of 1952”, assisted veterans who served during the Korean War era with readjustment to civilian life [18]. Benefits included an educational subsidy, a government-backed low-interest loan benefit, unemployment benefits ($26 per week for 26 weeks), and mustering out pay ($100 - $300 depending on length and location of service). The educational subsidy applied to all veterans who served 90(+) days and were discharged other than dishonorably. Veterans were allowed money for education and training for 1.5 times the duration of service for up to 36 months of schooling. The amount of benefit varied by enrollment status and number of dependents, with a maximum of $160 per month for full-time students with more than one dependent [18]. Depending on the university (public or private) and number of dependents, the educational subsidy cut college costs by 39 – 71% [5]. There were 5.5 million Korean War veterans, and the US government spent $30.8 billion (2008 dollars) to educate 2.4 million veterans [19].
Numerous economic studies found GI Bill benefits from World War II (WWII), the Korean War, and the Vietnam War increased aspects of socio-economic status (SES) such as education [5-8], income [9-11], occupational status [9,11], and homeownership [12]. Past work found men from disadvantaged backgrounds disproportionately benefit [8-11], while others argue most benefits accrued to men from advantaged backgrounds [5]. We hypothesized an association between Korean War GI Bill eligibility and higher adult SES, particularly among men from low SES backgrounds, resulting in smaller socio-economic disparities in markers for depression among veterans compared to non-veterans.
Understanding the association between policies that affect SES and depression prevalence is important; mental health and substance abuse disorders are a major cause of morbidity worldwide, accounting for 183.9 million disability-adjusted life years globally in 2010, with depressive disorders the largest contributor (40.5%) [13]. Additionally, many people with depression are not diagnosed or treated [14], and treatment options are not always effective [15], highlighting the importance of prevention on a population-level. Past work shows depression is highly socially patterned by lifecourse SES [16,17], and upward social mobility is associated with fewer depressive symptoms [17], suggesting depression may be prevented through policies that facilitate upward social mobility.
Our study investigates the association between Korean War GI Bill eligibility and socio-economic disparities in markers for depression. We advance the literature in three distinct ways: first, we examine markers for depression among Korean War GI Bill eligible (veteran) and GI Bill ineligible (non-veteran) older adults; this is important because studies on the health of veterans rarely use a non-veteran control group. Second, we rigorously control for selection into the military, a weakness in previous studies. Third, we examine effect modification by childhood SES (cSES) to determine if Korean War GI Bill eligibility had different affects in low and high cSES subpopulations.
METHODS
Sample
Data come from the Health and Retirement Study (HRS), a nationally representative sample of community-dwelling adults 50 and older. Analyses were restricted to US-born male Korean War veterans and non-veterans, who were alive in 2010 (N = 6,495); veterans from other time periods were excluded. An additional 1,223 men were excluded for missing data on number of depressive symptoms, yielding 5,272 (81.2%) eligible men; of these, 4,786 men were pruned while implementing the coarsened exact matching (CEM) procedure, detailed below, yielding a final analytic sample of 486 men: 167 in the low childhood socio-economic (cSES) group, and 319 in the high cSES group.
Exposure
Korean War GI Bill eligibility was military service from 1950 – 1954 [18,20]. Veterans from other time frames were removed from the analytic sample; all veterans included in this analysis are considered GI Bill eligible, and all non-veterans are considered GI Bill ineligible.
Outcomes
Depressive symptoms over the previous week were assessed with a modified 8-item Center for Epidemiologic Studies Depression (CESD) scale summing 6 “negative” items and two reverse-coded “positive” items (all coded yes / no); this scale is reliable among HRS participants (Cronbach’s alpha = 0.78) [21]. The negative items include questions such as feeling sad and depressed, everything is an effort, sleep is restless, feeling alone, and not able to get going, while the positive items asked if the respondent felt happy and enjoyed life; higher CESD scores indicated more depressive symptoms. The modified scale ranges from 0 to 8 and correlates with the original, 20-item scale [22]. An indicator for elevated depressive symptoms was created by dichotomizing the 8-item measure at the HRS recommended cutoff of ≥ 4 symptoms [22]; in this analytic sample, elevated depressive symptoms predicted doctor’s diagnosis of depression and regular use of prescription medication for depression and anxiety (both p < 0.0005).
Effect Modifier
Childhood socio-economic status (cSES) is evaluated as an effect modifier. Men whose parents both had ≥ 8 years of education were considered high cSES; men were considered low cSES if at least one parent had < 8 years of education, or there was missing data on parents’ education. Education was dichotomized at 8 years because most parents in this sample stopped formal education after 8 years. Individuals with missing information on parents’ education were thought to have a distinct family structure (e.g. grew up in a single-parent household [23]), and were therefore included in the low cSES group, similar to other HRS researches examining cSES [17].
Matching Variables
Korean War veterans were exactly matched to non-veterans on birth year [7], race / ethnicity (Non-Hispanic White, Non-Hispanic Black, Hispanic, Other Race)[24], southern birth (based on the US census divisions of south Atlantic, east south central, and west south central, because southern Black Americans were less likely to take advantage of GI Bill benefits) [6], and childhood and young adult health, discussed below, as healthy individuals were more likely to serve [24]. We also matched on self-reported height in 2010 (mean dichotomized) as an additional control for childhood social and nutritional circumstances.
Data on the most common reasons registrants were rejected for military service during World War II was used to account for selection into the military. White registrants were rejected for eye problems, mental diseases, musculoskeletal problems, cardiovascular problems, and ear problems, while Black registrants were additionally rejected for educational deficiencies, and syphilis [24]. HRS childhood health variables closest to the rejection factors were difficulty seeing (eye problems), learning difficulties (educational deficiencies), heart trouble (cardiovascular problems), ear problems (ear problems), psychiatric problems (mental disease), and depression (mental disease). We also matched on youth disability status, and self-reported childhood health (excellent, very good, good, fair, and poor).
Analysis
All analyses are run a) in the pooled population, b) stratified by cSES subgroup, and c) with a Korean War GI Bill eligible * cSES interaction term, using coarsened exact matching (CEM). CEM is a method of pre-processing data that matches treatment and control observations on pre-exposure covariates. Non-matched observations are pruned from the data set, and control units in the matched sample are weighed to create balance across stratum (i.e. treatment units are given a weight of one and control units are weighted to equal the number of treated units divided by the number of control units in the stratum, normalized to the total matched sample [25]). In the resultant analytic sample, the multivariate distribution of matching variables is balanced between the treatment and control groups, mimicking a randomized control trial on the observed variables. To facilitate matching, variables can be temporarily coarsened across substantively indistinguishable categories, and the uncoarsened variables are added to the regression model. In our analysis, height was coarsened into dichotomous categories for matching purposes, and continuous height was included in our regression models. CEM allows for matching on values and missing data [26]. Because both treatment and control units are pruned from the data set, CEM estimates are interpreted as the feasible sample average treatment effect among the treated. Quality of the analytic sample created by the CEM procedure is assessed with a multivariate imbalance measure, L1, which ranges from 0 (perfect covariate balance between treatment and control units) to 1 (no covariate overlap) [25].
Three models are presented for each outcome: Model 1 is unweighted and presented for comparison; Model 2 uses the CEM weights, and represents the model used in the interaction analyses; Model 3 uses CEM weights and adjusts for parents’ educational attainment (years) with a missing indicator to account for possible residual confounding by cSES. Interaction models were estimated to determine if GI Bill eligibility impacted disparities. All models adjust for continuous height. For number of depressive symptoms, an ordinary least square model was estimated; for elevated depressive symptoms a logistic regression model was used, and predicted probabilities were calculated. Analyses were also run using a covariate adjustment (CA) approach, and propensity score matching (PSM) for comparison (Tables A2 & A3); prior work indicates CEM has better internal validity than PSM [25,27], and is therefore our primary analysis technique. All data cleaning was performed in SAS, version 9.3, and analyses were performed in Stata, version 13.
RESULTS
Low cSES veterans and non-veterans (N = 167) were, on average, 79 years old, 69 inches tall, predominantly White (75%), one third were born in the south, and experienced excellent or very good self-rated childhood health. High cSES Korean War veterans and non-veterans (N = 319) were similar but more were White (97%), and fewer were born in the south (15%) (Table 1). The multivariate imbalance measure improved from 0.91 to 6.7*10-16 after data were pruned and weighted in the total population, with similar reductions in both cSES subgroups. Pruned individuals were younger, more were minorities, and had worse childhood health (Table A1).
Table 1.
Distribution of matching and outcome variables for Korean War veterans and matched non-veteran controls
| Low Childhood SES (N = 167) | High Childhood SES (N = 319) | |||||||
|---|---|---|---|---|---|---|---|---|
| Non-Veterans | Korean War Veterans | Non-Veterans | Korean War Veterans | |||||
| Covariate | N | (mean) | N | % | N | % | N | % |
| Age in years | 81 | (78.09) | 86 | (78.14) | 159 | (77.64) | 160 | (77.94) |
| Height in inches | 81 | (69.23) | 86 | (69.61) | 159 | (69.25) | 160 | (69.36) |
| Southern birth | 81 | 37.04 | 86 | 31.40 | 159 | 15.72 | 160 | 14.38 |
| Race | ||||||||
| Non-Hispanic White | 81 | 74.07 | 86 | 75.58 | 159 | 97.48 | 160 | 96.88 |
| Non-Hispanic Black | 81 | 24.69 | 86 | 22.09 | 159 | 2.52 | 160 | 3.13 |
| Hispanic | 81 | 1.23 | 86 | 2.33 | 159 | 0.00 | 160 | 0.00 |
| Other | 81 | 0.00 | 86 | 0.00 | 159 | 0.00 | 160 | 0.00 |
| Mother years education | 59 | (7.15) | 68 | (7.35) | 159 | 11.08 | 160 | 10.39 |
| Mother education missing | 81 | 27.16 | 86 | 20.93 | 159 | 0.00 | 160 | 0.00 |
| Father years education | 48 | (5.83) | 66 | (5.41) | 159 | 10.99 | 160 | 10.12 |
| Father education missing | 81 | 40.74 | 86 | 23.26 | 159 | 0.00 | 160 | 0.00 |
| Childhood Health | ||||||||
| Excellent | 81 | 49.38 | 86 | 54.65 | 159 | 76.10 | 160 | 68.13 |
| Very good | 81 | 32.10 | 86 | 31.40 | 159 | 18.87 | 160 | 23.75 |
| Good | 81 | 18.52 | 86 | 13.95 | 159 | 4.40 | 160 | 7.50 |
| Fair | 81 | 0.00 | 86 | 0.00 | 159 | 0.63 | 160 | 0.63 |
| Poor | 81 | 0.00 | 86 | 0.00 | 159 | 0.00 | 160 | 0.00 |
| Depression | 78 | 2.56 | 83 | 2.41 | 136 | 0.00 | 138 | 0.00 |
| Psychiatric Problems | 78 | 0.00 | 83 | 0.00 | 136 | 0.00 | 138 | 0.00 |
| Learning Problems | 81 | 0.00 | 86 | 0.00 | 159 | 0.63 | 160 | 0.63 |
| Ear Problems | 78 | 2.56 | 83 | 2.41 | 142 | 0.70 | 143 | 1.40 |
| Disability | 81 | 0.00 | 86 | 0.00 | 159 | 0.00 | 160 | 0.00 |
| Difficulty Seeing | 78 | 0.00 | 83 | 0.00 | 136 | 0.00 | 138 | 0.00 |
| Heart Problems | 78 | 0.00 | 83 | 0.00 | 142 | 0.00 | 143 | 0.00 |
| Outcome | ||||||||
| Number of Depressive Symptoms | 81 | (1.67) | 86 | (1.00) | 159 | (0.89) | 160 | (0.87) |
| Elevated Depressive Symptoms | 81 | 17.28 | 86 | 8.14 | 159 | 6.29 | 160 | 6.88 |
Distribution of matching variables and the outcome variables in the CEM analytic sample. Male Korean War era Veterans were exactly matched to non-veterans on all pre-exposure variables, with the exception of height which was dichotomized. The number of observations differs across the rows because the coarsened exact matching (CEM) procedure allows for matching on missing data, however complete information is required for the exposure and the outcome variables. Although individuals are exactly matched, the distribution of variables may vary within childhood SES strata, however all covariates are equally distributed in the analytic sample after the CEM weights are applied.
There was no difference between veterans and non-veterans for either depression marker in pooled analysis (Table 2). In unweighted analyses, low cSES veterans reported 0.65 fewer depressive symptoms than low cSES non-veterans, 95% Confidence Intervals (CI): (-1.19, -0.11), p = 0.018 (Model 1); this association remained after applying CEM weights [Model 2, β = -0.64, 95%CI: (-1.18, -0.09), p = 0.022], but attenuated after adjusting for parents’ education [Model 3, β = 0.53, [95% CI: (-1.08, 0.03), p = 0.062]. There was no difference between high cSES veterans and nonveterans for number of depressive symptoms (Table 3). Results were substantively similar in CA and PSM models, though results were not significant (Table A2).
Table 2.
Pooled results for depression markers among GI Bill eligible veterans compared to non-veterans in 2010
| Number of Depressive Symptoms | Prevalence of Elevated Depressive Symptoms | |||||||
|---|---|---|---|---|---|---|---|---|
| No. Symptoms in Non-Veterans | Difference in No. Symptoms for Veterans | 95% CI | p | Non-veteran Prevalence | Difference in Veteran Prevalence | 95% CI | p | |
|
|
||||||||
| Model 1 | 1.13 | -0.23 | (-0.52, 0.06) | 0.118 | 9.94 | -2.58 | (-7.58, 2.42) | 0.312 |
| Model 2 | 1.05 | -0.15 | (-0.43, 0.13) | 0.293 | 7.84 | -0.46 | (-5.17, 4.26) | 0.849 |
| Model 3 | 1.58 | -0.15 | (-0.43, 0.13) | 0.298 | 7.59 | 0.04 | (-4.64, 4.73) | 0.984 |
All Models are adjusted for continuous height.
Model 1: Regression analysis does not include CEM weights
Model 2: Regression analysis with CEM weights applied
Model 3: CEM weights applied and additional adjustment for mother’s years of education, father’s years of education, and missing indicators for both parent’s educational attainment.
Table 3.
Number of depressive symptoms in 2010 among GI Bill eligible veterans compared to non-veterans by childhood SES.
| Low Childhood SES (N = 167) | High Childhood SES (N = 319) | |||||||
|---|---|---|---|---|---|---|---|---|
| No. Symptoms in Non-Veterans | Difference in No. Symptoms for Veterans | (95% CI) | p | No. Symptoms in Non-Veterans | Difference in No. Symptoms for Veterans | (95% CI) | p | |
|
|
||||||||
| Model 1 | 1.63 | -0.65 | (-1.19, -0.11) | 0.018 | 0.87 | -0.02 | (-0.35, 0.32) | 0.925 |
| Model 2 | 1.62 | -0.64 | (-1.18, -0.09) | 0.022 | 0.74 | 0.11 | (-0.20, 0.42) | 0.474 |
| Model 3 | 1.87 | -0.53 | (-1.08, 0.03) | 0.062 | 1.26 | 0.06 | (-0.25, 0.38) | 0.692 |
All Models are adjusted for continuous height.
Model 1: Regression analysis does not include CEM weights
Model 2: Regression analysis with CEM weights applied
Model 3: CEM weights applied and additional adjustment for mother’s years of education, father’s years of education, and missing indicators for both parents’ educational attainment.
After unmatched observations are removed, CEM Weights range from 0.31 to 2.83 in the low cSES group and 0.14 to 4.97 in the high cSES group.
The socio-economic disparity in depressive symptoms was 0.88 symptoms for non-veterans and 0.12 symptoms for veterans; low cSES veterans reported 0.76 fewer depressive symptoms than high cSES veterans, [95%CI: (-1.33, -0.18), p = 0.010] (Figure 1).
Figure 1. Korean War GI Bill eligibility is associated with smaller socio-economic disparities in number of depressive symptoms.
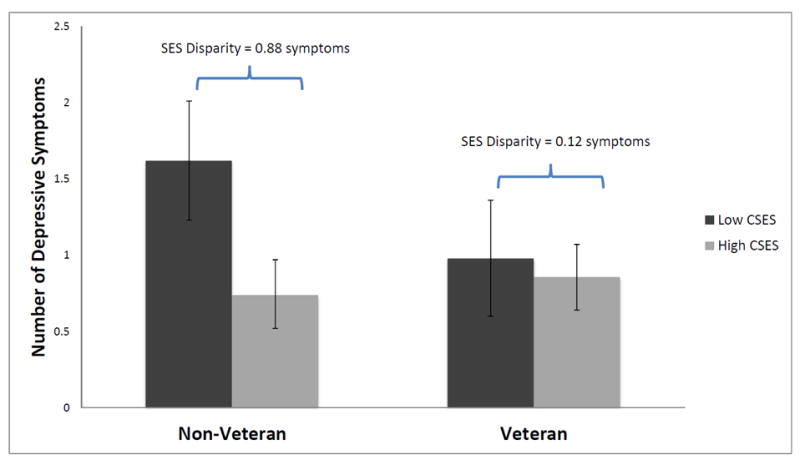
Among non-veterans, the socio-economic disparity in number of depressive symptoms between individuals who had a high SES childhood and a low SES childhood is 0.88 symptoms; among veterans the socio-economic disparity is 0.12 depressive symptoms. The additional difference in socio-economic disparities for veterans compared to non-veterans is 0.76 depressive symptoms [95%CI: (-1.33, -0.18), p = 0.010].
Point estimates for high SES and low SES veterans and non-veterans come from stratified models, displayed in Model 2 in Table 2, while the point estimate and p-value for the additional difference in disparities comes from an interaction model. The point estimates for number of depressive symptoms in the interaction model are slightly different than the stratified results as follows: the number of depressive symptoms among low childhood SES veterans is 0.99 and 1.63 among non-veterans; the number of depressive symptoms among high childhood SES veterans is 0.85, and 0.73 among non-veterans.
Veterans and non-veterans had equal prevalence of elevated depressive symptoms in both cSES subgroups (Table 4); CA and PSM models produced similar results (Table A3). The socio-economic disparity in elevated depressive symptom prevalence was 13.0% for non-veterans and 1.2% for veterans; socio-economic disparities in prevalence of elevated depressive symptoms were 11.7% smaller [95% CI: (-8.2, -22.6), p = 0.035] for veterans compared to non-veterans (Figure 2).
Table 4.
Prevalence of elevated depressive symptoms in 2010 among veterans compared to non-veterans by childhood SES.
| Low Childhood SES (N = 167) | High Childhood SES (N = 319) | |||||||
|---|---|---|---|---|---|---|---|---|
| Non-veteran Prevalence | Difference in Veteran Prevalence | (95% CI) | p | Non-veteran Prevalence | Difference in Veteran Prevalence | (95% CI) | p | |
| Model 1 | 16.9 | -8.6 | (-18.6, 1.4) | 0.092 | 6.3 | 0.6 | (-4.9, 6.0) | 0.836 |
| Model 2 | 16.2 | -8.0 | (-17.8, 1.9) | 0.112 | 3.3 | 3.6 | (-1.3, 8.4) | 0.149 |
| Model 3 | 15.0 | -6.1 | (-15.9, 3.8) | 0.226 | 3.6 | 2.9 | (-2.0, 7.8) | 0.247 |
All Models are adjusted continuous for height.
Model 1: Regression analysis does not include CEM weights
Model 2: Regression analysis with CEM weights applied
Model 3: CEM weights applied and additional adjustment for mother’s years of education, father’s years of education, and missing indicators for both parents’ educational attainment.
Figure 2. Korean War GI Bill eligibility is associated with smaller socio-economic disparities in elevated depressive symptoms.
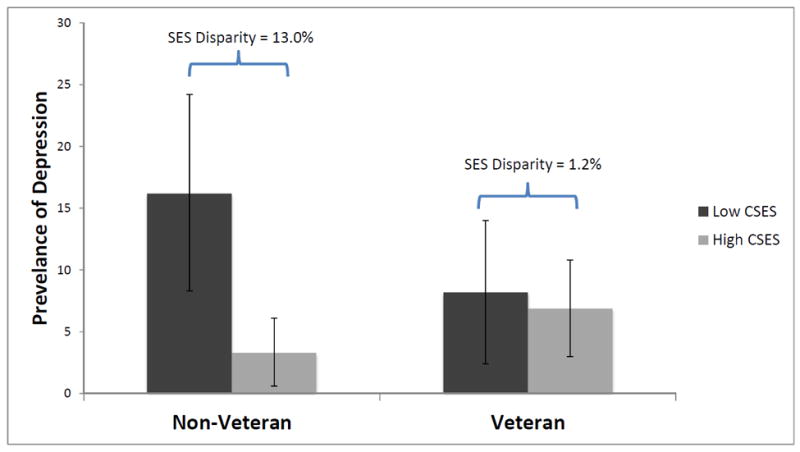
Among non-veterans, the socio-economic disparity in prevalence of depression between individuals who had a high SES childhood and a low SES childhood is 13.0%; among veterans the socio-economic disparity in prevalence is 1.2% The additional difference in socio-economic disparities in prevalence of depression for veterans compared to non-veterans is 11.7% [95%CI: -8.2, -22.6), p = 0.035].
Point estimates for high SES and low SES veterans and non-veterans come from stratified models, displayed in Model 2 in Table 3, while the p-value for the additional difference in disparities comes from an interaction model. The point estimates for indicated depression in the interaction model are slightly different than the stratified results as follows: prevalence of depression among low childhood SES non-veterans is 7.0; the prevalence of depression among low SES non-veterans is 16.3, and the additional difference in socio-economic disparities is 11.7%.
CONCLUSIONS
There was no relationship between Korean War GI Bill eligibility and markers of depression in pooled analysis or among high cSES veterans. Veterans from low socio-economic backgrounds, however, reported fewer depressive symptoms than low cSES non-veterans. The differential association of GI Bill eligibility among low and high cSES veterans resulted in smaller socio-economic disparities in number of depressive symptoms and elevated depressive symptoms prevalence for veterans compared to non-veterans.
While the HRS data are uniquely suited to answer lifecourse health questions, some important limitations must be acknowledged. First, similar to an intention-to-treat analysis, we studied Korean War GI Bill eligibility, not receipt of benefits. Some individuals classified as GI Bill eligible may not have utilized these benefits, biasing our results towards the null. Second, individuals need to survive until 2010 to be included in these analyses, however there is evidence that Vietnam War veterans had higher death rates than non-veterans [28,29]. If depressed Korean War veterans died before 2010, remaining veterans would be disproportionately healthy, biasing the results away from null. Additionally, if low cSES veterans were more susceptible to death than the high cSES veterans, the observed difference in socio-economic disparities may be due to selective survival. Third, HRS provides information on number of depressive symptoms and a recommended dichotomization point, but there is no clinical diagnosis of depression and important factors such as duration and intensity were not assessed. Fourth, these data are all self-reported, and the majority are retrospective, however prior work shows self-reported retrospective data on childhood conditions are accurate and do not vary by SES [30]. Fifth, this is an observational study, and residual confounding is a possibility. Finally, the CEM point estimate is the feasible sample average treatment effect among the treated, meaning these findings can only be generalized to Korean War veterans with similar baseline characteristics as those in the analytic sample, however CA and PSM results are applicable to a wider population (Tables A2 and A3). Despite these limitations, this study represents the only work, to our knowledge, on the long-term association between Korean War GI Bill eligibility and depression, and therefore is an important contribution to the field.
There are three hypothesized mechanisms from military service to higher socio-economic status: 1) military service functioning as a bridging environment, where disadvantaged populations acquire skills and experience in navigating bureaucracies [10]; 2) a screening device where military service signals more dedicated workers and / or students [31]; or 3) GI Bill benefits for qualifying veterans, increasing the SES of beneficiaries in adulthood. Any, or all, of these mechanisms may explain the results of this study, and we are unable to differentiate mechanisms with these data. Auxiliary results show that GI Bill eligibility predicted more years of education for low cSES veterans than non-veterans, indicating education rather than income or wealth as a mediating variable (Table A4).
Our findings compare well with the previous literature on Vietnam veterans and depression. Studies showing no effect of military service on depression [32,33] (similar to our findings in the pooled analysis) and lower depression prevalence among veterans [34] (similar to our findings in the low cSES population) are supported by these results. Previous analyses showing higher depression risk for veterans compared to non-veterans [35] were not supported in these data. Our results underscore the importance of investigating distinct SES subgroups, particularly when studying conditions that are strongly socially patterned.
Our findings add to a growing body of literature suggesting social policies that expand access to resources are associated with better health. Even when health is not the primary target, social policies can have spill-over effects on health due to the close relationship between health and social conditions [36]. Research on the Civil Rights Act of 1964 provides evidence of a decrease in disparities in wage and life expectancy for Black women, compared to White women [37], and a dramatic reduction in racial disparities in infant mortality [38]. Further, there is evidence of intergenerational effects for the Civil Rights Act [39] and the GI Bill [40], implying that social policies may impact the health of future generations.
Social policies also have the ability to impact population health. Most work on preventing depression focuses on individual-level interventions, however, macro-level interventions can affect health on a population-level [41]. Rather than doctor consultations, which can be time-consuming, expensive, and have limited effects on other health conditions, interventions that promote social mobility can potentially change an individual’s socio-economic trajectory, and thereby all diseases that are patterned by SES.
Prevention of depression is important at both the individual and societal levels. At the individual level, depression is associated both with poor quality of life [42], and premature death [43]. At a societal level, $26.1 billion is paid annually to treat depression in the US [44], even though less than half of depressed individuals receive treatment [14], and treatment only reduces the burden of disease by 10 – 20% [15]. Depression also has economic costs, including lost earnings for depressed individuals [45], reduced work performance costing employers $31 billion per year [46], and in extreme cases, can push people onto support services such as food stamps, subsidized housing, and collecting disability income [47].
Similar to the group that benefited from Korean War GI Bill eligibility, today’s service members are drawn disproportionately from low and middle SES groups [48], however, the current GI Bill is not as generous as the Korean War GI Bill [49]. If the current GI Bill was amended to provide more support for education and training, our results suggest the veterans from disadvantaged backgrounds may benefit substantially. While our results cannot be directly generalized to current service members, if these results are confirmed among contemporary beneficiaries, the potential benefits in disease reduction, increased productivity, and reduced medical costs could be substantial.
This study expands on prior work by examining the long-term association of Korean War GI Bill eligibility on socio-economic disparities in depression markers. Where the data are available, studies should replicate these analyses and examine other health conditions. Future research elucidating mechanistic pathways and formal testing of mediation is warranted. Our findings suggest providing low-income individuals pathways to upward social mobility may reduce socio-economic disparities in depression and improve population health.
Acknowledgments
FUNDING: This work was supported by the Mitchell L. and Robin LaFoley Dong Scholarship and the Harvey V. Fineberg Fellowship in Cancer Prevention.
Appendix
Table A1.
Distribution of covariates among the sample eligible, eligible but unmatched, and analyzed
| Eligible Sample (N = 5272) | Eligible but Unmatched Sample (N = 4786) | Analytic Sample (N = 486) | |||||||||
|---|---|---|---|---|---|---|---|---|---|---|---|
| Variable | N | Mean | SD | p (vs. CEM sample) | N | Mean | SD | p (vs. CEM sample) | N | Mean | SD |
| Korean War Veteran | 5272 | 0.11 | 0.32 | 0.000 | 4786 | 0.07 | 0.26 | 0.000 | 486 | 0.51 | 0.50 |
| Mothers Years of Education | 4727 | 10.56 | 3.60 | <0.0005 | 4281 | 10.65 | 3.62 | <0.0005 | 446 | 9.74 | 3.26 |
| Mother’s Years of Education Missing | 5272 | 0.10 | 0.30 | 0.110 | 4786 | 0.11 | 0.31 | 0.080 | 486 | 0.08 | 0.28 |
| Fathers Years of Education | 4444 | 10.00 | 4.12 | <0.0005 | 4011 | 10.08 | 4.16 | <0.0005 | 433 | 9.25 | 3.64 |
| Father’s Years of Education Missing | 5272 | 0.16 | 0.36 | 0.002 | 4786 | 0.16 | 0.37 | 0.001 | 486 | 0.11 | 0.31 |
| Age in 2010 | 5272 | 65.25 | 10.99 | <0.0005 | 4786 | 63.96 | 10.68 | <0.0005 | 486 | 77.90 | 3.22 |
| Height in 2010 (in) | 5272 | 69.98 | 2.90 | <0.0005 | 4786 | 70.04 | 2.90 | <0.0005 | 486 | 69.35 | 2.87 |
| southern birth | 5264 | 0.39 | 0.49 | <0.0005 | 4778 | 0.41 | 0.49 | <0.0005 | 486 | 0.22 | 0.41 |
| Non-Hispanic White | 5268 | 0.74 | 0.44 | <0.0005 | 4782 | 0.73 | 0.45 | <0.0005 | 486 | 0.90 | 0.31 |
| Non-Hispanic Black | 5268 | 0.18 | 0.38 | <0.0005 | 4782 | 0.19 | 0.39 | <0.0005 | 486 | 0.10 | 0.30 |
| Hispanic | 5268 | 0.06 | 0.24 | <0.0005 | 4782 | 0.07 | 0.25 | <0.0005 | 486 | 0.01 | 0.08 |
| Other Race | 5268 | 0.02 | 0.13 | <0.0005 | 4782 | 0.02 | 0.14 | <0.0005 | 486 | 0.00 | 0.00 |
| Childhood Health | |||||||||||
| Excellent | 5269 | 0.53 | 0.50 | <0.0005 | 4783 | 0.52 | 0.50 | <0.0005 | 486 | 0.65 | 0.48 |
| Very good | 5269 | 0.26 | 0.44 | 0.585 | 4783 | 0.26 | 0.44 | 0.549 | 486 | 0.25 | 0.43 |
| Good | 5269 | 0.15 | 0.36 | <0.0005 | 4783 | 0.16 | 0.36 | <0.0005 | 486 | 0.09 | 0.29 |
| Fair | 5269 | 0.04 | 0.21 | <0.0005 | 4783 | 0.05 | 0.22 | <0.0005 | 486 | 0.00 | 0.06 |
| Poor | 5269 | 0.01 | 0.10 | <0.0005 | 4783 | 0.01 | 0.11 | <0.0005 | 486 | 0.00 | 0.00 |
| Depression | 4360 | 0.03 | 0.17 | <0.0005 | 3925 | 0.03 | 0.18 | <0.0005 | 435 | 0.01 | 0.10 |
| Psychiatric Problems | 4252 | 0.02 | 0.14 | <0.0005 | 3817 | 0.02 | 0.15 | <0.0005 | 435 | 0.00 | 0.00 |
| Learning Problems | 5197 | 0.06 | 0.24 | <0.0005 | 4711 | 0.07 | 0.25 | <0.0005 | 486 | 0.00 | 0.06 |
| Ear Problems | 4554 | 0.08 | 0.27 | <0.0005 | 4108 | 0.08 | 0.28 | <0.0005 | 446 | 0.02 | 0.12 |
| Disability | 5196 | 0.04 | 0.21 | <0.0005 | 4710 | 0.05 | 0.22 | <0.0005 | 486 | 0.00 | 0.00 |
| Difficulty Seeing | 4360 | 0.06 | 0.24 | <0.0005 | 3925 | 0.07 | 0.25 | <0.0005 | 435 | 0.00 | 0.00 |
| Heart Problems | 4556 | 0.02 | 0.15 | <0.0005 | 4110 | 0.02 | 0.15 | <0.0005 | 446 | 0.00 | 0.00 |
| Number of Depressive Symptoms | 5272 | 1.30 | 1.84 | 0.001 | 4786 | 1.32 | 1.86 | <0.0005 | 486 | 1.03 | 1.62 |
| Elevated Depressive Symptoms | 5272 | 0.12 | 0.32 | 0.015 | 4786 | 0.12 | 0.33 | 0.008 | 486 | 0.09 | 0.28 |
The “eligible sample” represents all individuals who were eligible for this analysis (that is, US born males who were either Korean War era veterans or non-veterans). The “eligible but unmatched sample” represents individuals who were removed, or “pruned” during the CEM procedure due to lack of matches based on the multivariate distribution of the matching covariates. The “analytic sample” represents individuals who were used in the CEM analysis, that is, male Korean War era veterans and non-veterans for whom good matches existed based on the multivariate distribution of their baseline covariates.
Table A2.
Results from covariate adjustment, propensity score matching, and coarsened exact matching models for number of depressive symptoms in 2010 among Korean War era veterans and non-veterans
| Whole Population | Low Childhood SES | High Childhood SES | ||||||||||
|---|---|---|---|---|---|---|---|---|---|---|---|---|
| N | β | 95%CI | p | N | β | 95%CI | p | N | β | 95%CI | p | |
|
|
||||||||||||
| CA | 4,230 | -0.18 | (-0.38, 0.03) | 0.088 | 1720 | -0.23 | (-0.56, 0.10) | 0.174 | 2510 | -0.14 | (-0.40, 0.12) | 0.300 |
| PSM | 8901 | -0.05 | (-0.35, 0.26) | 0.762 | 3822 | -0.34 | (-0.92, 0.24) | 0.254 | 5083 | -0.02 | (-0.38, 0.34) | 0.912 |
| CEM | 486 | -0.15 | (-0.43, 0.13) | 0.293 | 167 | -0.64 | (-1.18, -0.09) | 0.022 | 319 | 0.11 | (-0.20, 0.42) | 0.474 |
CA models include age in 2010 (centered at 65; linear, quadratic, cubic, quartic and quintic terms), race (Non-Hispanic White, Non-Hispanic Black, Hispanic, and Other Race), southern birth, height in 2010 (centered at 66 inches; linear, and quadratic terms), childhood self-rated health (excellent, very good, good, fair, poor), and the following childhood health conditions: heart problems, ear problems, difficulty seeing, depression, psychiatric problems, learning problems, and childhood disability, and, in the pooled model, childhood SES.
PSM models include the same variables as the CA models with the following exceptions: 1) individuals with childhood psychiatric problems were removed from the low cSES analysis because there were no veterans who reported childhood psychiatric problems in this subgroup; 2) individuals with poor childhood health or who reported “Other Race” were removed from the high cSES analysis because there were no veterans who had these characteristics and high cSES. The PSM models were run using nearest-neighbor 1-to-1 matching with replacement and a 0.05 caliper; the propensity for exposure was estimated using a logit model.
698 individuals were weighted to 890 for this model due to the frequency weights for the control group, which ranged from 0.25 – 11; there are fractional weights to due ties in the propensity for exposure.
298 individuals were weighted to 382 for this model due to the frequency weights for the control group, which ranged from 0.5 – 8.0.
387 individuals were weighted to 508 for this model due to the frequency weights for the control group, which ranged 0.33 – 10.0.
Table A3.
Results from covariate adjustment , propensity score matching, and coarsened exact matching models for elevated depressive symptoms in 2010 among Korean War veterans and non-veterans
| Whole Population | Low Childhood SES | High Childhood SES | ||||||||||
|---|---|---|---|---|---|---|---|---|---|---|---|---|
| N | β | 95%CI | p | N | β | 95%CI | p | N | β | 95%CI | p | |
|
|
||||||||||||
| CA | 4230 | -0.02 | (-0.06, 0.02) | 0.320 | 1720 | -0.03 | (-0.09, 0.03) | 0.368 | 2510 | -0.01 | (-0.06, 0.04) | 0.717 |
| PSM | 8901 | 0.01 | (-0.03, 0.06) | 0.578 | 3822 | -0.05 | (-0.16, 0.05) | 0.289 | 5083 | 0.03 | (-0.03, 0.09) | 0.303 |
| CEM | 486 | -0.005 | (-0.05, 0.04) | 0.841 | 167 | -0.08 | (-0.18, 0.02) | 0.107 | 319 | 0.04 | (-0.01, 0.08) | 0.152 |
Results come from linear probability models for all three methodological techniques.
CA models include age in 2010 (centered at 65; linear, quadratic, cubic, quartic and quintic terms), race (Non-Hispanic White, Non-Hispanic Black, Hispanic, and Other Race), southern birth, height in 2010 (centered at 66 inches; linear, and quadratic terms), childhood self-rated health (excellent, very good, good, fair, poor), and the following childhood health conditions: heart problems, ear problems, difficulty seeing, depression, psychiatric problems, learning problems, and childhood disability, and, in the pooled model, childhood SES.
PSM models include the same variables as the CA models with the following exceptions: 1) individuals with childhood psychiatric problems were removed from the low cSES analysis because there were no veterans who reported childhood psychiatric problems in this subgroup; 2) individuals with poor childhood health or who reported “Other Race” were removed from the high cSES analysis because there were no veterans who had these characteristics and high cSES. The PSM models were run using nearest-neighbor 1-to-1 matching with replacement and a 0.05 caliper; the propensity for exposure was estimated using a logit model.
698 individuals were weighted to 890 for this model due to the frequency weights for the control group, which ranged from 0.25 – 11; there are fractional weights to due ties in the propensity for exposure.
298 individuals were weighted to 382 for this model due to the frequency weights for the control group, which ranged from 0.5 – 8.0.
387 individuals were weighted to 508 for this model due to the frequency weights for the control group, which ranged 0.33 – 10.0.
Table A4.
Educational attainment among Korean War veterans compared to non-veterans
| Years of Education | High School Degree | Years of Post High School Education | College Degree | ||||||||||
|---|---|---|---|---|---|---|---|---|---|---|---|---|---|
| Beta | (95% CI) | p | OR | (95% CI) | p | Beta | (95% CI) | p | OR | (95% CI) | p | ||
|
|
|||||||||||||
| Whole Population | |||||||||||||
| Model 1 | 0.42 | (-0.07, 0.92) | 0.091 | 1.40 | (0.93, 2.11) | 0.109 | 0.07 | (-0.27, 0.40) | 0.698 | 0.96 | (0.62, 1.47) | 0.834 | |
| Model 2 | 0.49 | (0.00, 0.98) | 0.052 | 1.28 | (0.84, 1.93) | 0.245 | 0.15 | (-0.18, 0.48) | 0.371 | 1.02 | (0.66, 1.57) | 0.927 | |
| Model 3 | 0.77 | (0.33, 0.21) | 0.001 | 1.45 | (0.93, 2.27) | 0.105 | 0.32 | (0.02, 0.62) | 0.038 | 1.41 | (0.86, 2.31) | 0.168 | |
| Low cSES Population | |||||||||||||
| Model 1 | 1.17 | (0.31, 2.04) | 0.008 | 1.61 | (0.86, 3.02) | 0.137 | 0.40 | (-0.04, 0.85) | 0.075 | 1.55 | (0.57, 4.23) | 0.391 | |
| Model 2 | 1.26 | (0.41, 2.10) | 0.004 | 1.37 | (0.73, 2.57) | 0.332 | 0.53 | (0.11, 0.96) | 0.015 | 1.86 | (0.65, 5.30) | 0.247 | |
| Model 3 | 1.30 | (0.46, 2.14) | 0.003 | 1.31 | (0.67, 2.57) | 0.423 | 0.48 | (0.06, 0.91) | 0.027 | 1.55 | (0.51, 4.65) | 0.439 | |
| High cSES Population | |||||||||||||
| Model 1 | 0.07 | (-0.49, 0.63) | 0.811 | 1.34 | (0.75, 2.38) | 0.321 | -0.09 | (-0.52, 0.34) | 0.689 | 0.86 | (0.53, 1.41) | 0.552 | |
| Model 2 | 0.05 | (-0.51, 0.60) | 0.867 | 1.23 | (0.69, 2.21) | 0.476 | -0.07 | (-0.50, 0.36) | 0.739 | 0.87 | (0.53, 1.43) | 0.576 | |
| Model 3 | 0.61 | (0.10, 1.12) | 0.019 | 1.65 | (0.89, 3.05) | 0.110 | 0.35 | (-0.04, 0.75) | 0.079 | 1.52 | (0.86, 2.70) | 0.154 | |
Model 1: No CEM weights
Model 2: CEM weights applied
Model 3: Additional adjustment for parents’ educational attainment and missing education
Table A5.
Income and wealth in 2010 among Korean War veterans compared to non-veterans
| Income in 2010 | Wealth in 2010 | |||||
|---|---|---|---|---|---|---|
| Beta | (95% CI) | p | Beta | (95% CI) | p | |
| Whole Population | ||||||
| Model 1 | -2,085 | (-8,480, 4,309) | 0.522 | -211,944 | (-368,387, -55,502) | 0.008 |
| Model 2 | -846 | (-6,946, 5,253) | 0.785 | -238,404 | (-395,033, -81,774) | 0.003 |
| Model 3 | 404 | (-5,730, 6,537) | 0.897 | -227,185 | (-384,257, -70,114) | 0.005 |
| Low cSES Population | ||||||
| Model 1 | 6,465 | (-2,318, 15,247) | 0.148 | -8,312 | (-131,067, 114,444) | 0.894 |
| Model 2 | 6,474 | (-2,117, 15,064) | 0.139 | -32,429 | (-149,997, 85,139) | 0.587 |
| Model 3 | 6,923 | (-1,934, 15,780) | 0.125 | -49,802 | (-169,535, 69,930) | 0.413 |
| High cSES Population | ||||||
| Model 1 | -6,291 | (-14,764, 2,182) | 0.145 | -309,185 | (-533,657, -84,712) | 0.007 |
| Model 2 | -4,902 | (-12,961, 3,158) | 0.232 | -355,282 | (-582,117, -128,447) | 0.002 |
| Model 3 | -2,967 | (-11,240, 5,306) | 0.481 | -346,004 | (-579,408, -112,600) | 0.004 |
Model 1: No CEM weights
Model 2: CEM weights applied
Model 3: Additional adjustment for parents’ educational attainment and missing educations
Footnotes
FINANCIAL DISCLOSUERS: No Disclosures to Report. All authors had access to the data and a role in writing the manuscript.
Publisher's Disclaimer: This is a PDF file of an unedited manuscript that has been accepted for publication. As a service to our customers we are providing this early version of the manuscript. The manuscript will undergo copyediting, typesetting, and review of the resulting proof before it is published in its final citable form. Please note that during the production process errors may be discovered which could affect the content, and all legal disclaimers that apply to the journal pertain.
References
- 1.Peter G. Peterson Foundation. [November 25, 14AD];Americans spend over twice as much per capita on healthcare as the average developed country does - 2014-09-10. 2014 :1–1. http://pgpf.org/Chart-Archive/0006_health-care-oecd.
- 2.Institute of Medicine. US Health in International Perspective. National Academies Press; 2013. Practice BOPHAPH, National Research Council, Countries POUC-NHDAH-I, Population CO, Education DOBASSA. [Google Scholar]
- 3.Schroeder SA. We Can Do Better — Improving the Health of the American People. New England Journal of Medicine. 2007;357:1221–8. doi: 10.1056/NEJMsa073350. [DOI] [PubMed] [Google Scholar]
- 4.Kaplan RM. Behavior change and reducing health disparities. Prev Med. 2014 doi: 10.1016/j.ypmed.2014.04.014. [DOI] [PubMed] [Google Scholar]
- 5.Stanley M. College Education and the Midcentury GI Bills. Quarterly Journal of Economics. 2003;118:671–708. [Google Scholar]
- 6.Turner SE, Bound J. Closing the Gap or Widening the Divide: The Effects of the G.I. Bill and World War II on the Educational Outcomes of Black Americans. The Journal of Economic History. 2003;63:145–77. [Google Scholar]
- 7.Bound J, Turner SE. Going to War and Going to College: Did the World War II and the G.I. Bill Increase Educational Attainment for Returning Veterans? Journal of Labor Economics. 2002;20:784–815. [Google Scholar]
- 8.Xie Y. The Socioeconomic Status of Young Male Veternas, 1964 - 1984. Social Science Quarterly. 1992;73:379–96. [Google Scholar]
- 9.Teachman J, Tedrow LM. Wages, earnings, and occupational status: did World War II veterans receive a premium? Social Science Research. 2004;33:581–605. [Google Scholar]
- 10.Browning HL, Lopreato SC, Poston DL. Income and Veteran Status: Variations Among Mexican Americans, Blacks and Anglos. American Sociological Review. 1973;38:74–85. [Google Scholar]
- 11.Sampson RJ, Laub JH. Socioeconomic Achievement in the Life Course of Disadvantaged Men: Military Service as a Turning Point, Circa 1940-1965. American Sociological Review. 1996;61:347–67. [Google Scholar]
- 12.Fetter DK. How Do Mortgage Subsidies Affect Home Ownership? Evidence from the Mid-Century GI Bills. American Economic Journal: Economic Policy. 2013;5:111–47. [Google Scholar]
- 13.Whiteford HA, Degenhardt L, Rehm J, Baxter AJ, Ferrari AJ, Erskine HE, et al. Global burden of disease attributable to mental and substance use disorders: findings from the Global Burden of Disease Study 2010. The Lancet. 2013;382:1575–86. doi: 10.1016/S0140-6736(13)61611-6. [DOI] [PubMed] [Google Scholar]
- 14.Regier DA, Narrow WE, Rae DS, Manderschid RW, Locke BZ, Goodwin FK. The de Facto US Mental and Addictive Disorders Service System. Arch Gen Psychiatry. 1993;50:1–10. doi: 10.1001/archpsyc.1993.01820140007001. [DOI] [PubMed] [Google Scholar]
- 15.Chisholm D, Sanderson K, Ayuso-Mateos JL, Saxena S. Reducing the global burden of depression: population-level analysis of intervention cost-effectiveness in 14 world regions. The British Journal of Psychiatry. 2004;184:393–403. doi: 10.1192/bjp.184.5.393. [DOI] [PubMed] [Google Scholar]
- 16.Gilman SE, Kawachi I, Fitzmaurice GM, Buka SL. Socioeconomic status in childhood and the lifetime risk of major depression. International Journal of Epidemiology. 2002;31:359–67. [PubMed] [Google Scholar]
- 17.Luo Y, Waite LJ. The Impact of Childhood and Adult SES on Physical, Mental, and Cognitive Well-Being in Later Life. Journal of Gerontology Social Sciences. 2005;60B:S93–S101. doi: 10.1093/geronb/60.2.s93. [DOI] [PMC free article] [PubMed] [Google Scholar]
- 18.Public Law 550. Veterans Readjustment Assistance Act of 1952. HR 7656 1952 Jul 16; [Google Scholar]
- 19.Dortch C. Educational Assistance Programs Administered by the U.S. Department of Veterans Affairs. 2011:1–73. [Google Scholar]
- 20.Public Law 84 - 7. Veterans Educational Benefits. HR 587 1955 Feb 15; [Google Scholar]
- 21.Turvey CL, Wallace RB, Herzog AR. A Revised CES-D Measure of Depressive Symptoms and a DSM-Based Measure of Major Depressive Episodes in the Elderly. International Psychogeriatrics. 1999;11:139–48. doi: 10.1017/s1041610299005694. [DOI] [PubMed] [Google Scholar]
- 22.Steffick DE, Wallace RB, Herzog AR, Ofstedal MB, Fonda S, Langa K. Documentation of Affective Functioning Measures in the Health and Retirement Study. Ann Arbor, MI: 2000. [Google Scholar]
- 23.Glymour MM, Avendano M, Haas S, Berkman LF. Lifecourse Social Conditions and Racial Disparities in Incidence of First Stroke. Annals of Epidemiology. 2008;18:904–12. doi: 10.1016/j.annepidem.2008.09.010. [DOI] [PMC free article] [PubMed] [Google Scholar]
- 24.Rowntree LG, McGill KH, Edwards TI. Causes of Rejection and the Incidence of Defects among 18 and 19 year old selective service registrants. The Journal of the American Medical Association. 1943;123:1–5. [Google Scholar]
- 25.King G, Nielsen R, Coberley C, Pope JE, Wells A. Comparative Effectiveness of Matching Methods for Causal Inference. 2011:1–27. [Google Scholar]
- 26.Iacus SM, King G, Porro G. Causal Inference without Balance Checking: Coarsened Exact Matching. Political Analysis. 2012;20:1–24. doi: 10.1093/pan/mpr013. [DOI] [Google Scholar]
- 27.King G, Zeng L. The Dangers of Extreme Counterfactuals. Political Analysis. 2006;14:131–59. [Google Scholar]
- 28.Hearst N, Newman T, Hulley SB. Delayed Effects of the military Draft on Mortality: A Randomized Natural Experiment. New England Journal of Medicine. 1986;314:620–4. doi: 10.1056/NEJM198603063141005. [DOI] [PubMed] [Google Scholar]
- 29.Boehmer TK, Flanders WD, McGeehin MA, Boyle C, Barrett DH. Postservice Mortality in Vietnam Veterans. Arch Intern Med. 2004:1908–16. doi: 10.1001/archinte.164.17.1908. [DOI] [PubMed] [Google Scholar]
- 30.Krieger N, Williams DR, Moss NE. Measuring Social Class in US Public Helath Research: Concepts, Methodologies, and Guidelines. Annu Rev Public Health. 1997;18:341–78. doi: 10.1146/annurev.publhealth.18.1.341. [DOI] [PubMed] [Google Scholar]
- 31.De Tray D. Veteran Status as a Screening Device. The American Economic Review. 1982;72:133–42. [Google Scholar]
- 32.Anderson KH, Mitchell JM. Effects of Military Experience on Mental Health Problems and Work Behavior. Medical Care. 1992;30:554–63. doi: 10.1097/00005650-199206000-00008. [DOI] [PubMed] [Google Scholar]
- 33.Norquist GS, Hough RL, Golding JM, Escobar JI. Psychiatric Disorder in Male Veterans and Nonveterans. The Journal of Nervous and Mental Disease. 1990;178:328–35. doi: 10.1097/00005053-199005000-00009. [DOI] [PubMed] [Google Scholar]
- 34.Helzer JE, Robins LN, Wish E, Hesselbrock M. Depression in Vietnam veterans and civilian controls. Am J Psychiatry. 1979 [PubMed] [Google Scholar]
- 35.Jordan BK, Schlenger WE, Hough RL, Kulka RA, Weiss D, Fairbank JA, et al. Lifetime and Current Prevalence of Specific Psychiatric Disorders Among Vietnam Veterans and Controls. Arch Gen Psychiatry. 1991;48:207–15. doi: 10.1001/archpsyc.1991.01810270019002. [DOI] [PubMed] [Google Scholar]
- 36.House JS, Schoeni RF, Kaplan GA, Pollack H. The health effects of social and economic policy: the promise and challenge for research and policy. Making Americans Healthier Social and Economic Policy a Health Policy, New York. 2008 [Google Scholar]
- 37.Kaplan GA, Ranjit N, Burgard S. Lifting gates, lengthening lives: did Civil Rights policies improve the health of African-American women in the 1960s and 1970s? Making Americans Healthier Social and Economic Policy a Health Policy, New York. 2008 [Google Scholar]
- 38.Almond D, Chay KY, Greenstone M. Civil Rights, the War on Poverty, and Black-White Convergence in Infant Mortality in the Rural South and Mississippi. NBER Working Paper Series. 2006:1–36. [Google Scholar]
- 39.Almond D, Chay KY. The Long-Run and Intergenerational Impact of Poor Infant Health: Evidence from Cohorts Born During the Civil Rights Era. NBER Working Paper Series. 2006:1–67. [Google Scholar]
- 40.Page M. Father“s education and children”s human capital: evidence from the World War II GI Bill. Working Papers University of California, Department of Economics. 2006 [Google Scholar]
- 41.Rose G. Sick individuals and sick populations. International Journal of Epidemiology. 2001;30:427–32. doi: 10.1093/ije/30.3.427. [DOI] [PubMed] [Google Scholar]
- 42.Spitzer RL, Kroenke K, Sahn SR, Williams JB, deGruy FV, Brody D, et al. Health-Related Quality of Life in Primary Care Patients with Mental Disorders. Jama. 1995;274:1511–7. [PubMed] [Google Scholar]
- 43.Schulz R, Beach SR, Ives DG, Martire LM, Ariyo AA, Kop WJ. Association Between Depression and Mortality in Older Adults. Arch Intern Med. 2000;160:1761–8. doi: 10.1001/archinte.160.12.1761. [DOI] [PubMed] [Google Scholar]
- 44.Greenberg PE, Kessler RC, Birnbaum HG, Leong SA, Lowe SW, Berglund PA, et al. The Economic Burden of Depression in the United States: How Did It Change Between 1990 and 2000? J Clin Psychiatry. 2003;64:1465–75. doi: 10.4088/jcp.v64n1211. [DOI] [PubMed] [Google Scholar]
- 45.Kessler RC, Herringa S, Lakoma MD, Petukhova M, Rupp AE, Schoenbaum M, et al. Individual and Societal Effects of Mental Disorders on Earnings in the United States: Results From the National Comorbidity Survey Replication. Am J Psychiatry. 2008:703–11. doi: 10.1176/appi.ajp.2008.08010126. [DOI] [PMC free article] [PubMed] [Google Scholar]
- 46.Stewart WF, Ricci JA, Chee E, Hahn SR, Morganstein D. Cost of lost productive work time among US workers with depression. Jama. 2003;289:3135–44. doi: 10.1001/jama.289.23.3135. [DOI] [PubMed] [Google Scholar]
- 47.Rampell C. The Half-Trillion-Dollar Depression. The New York Times. 2013 Jul 2; [Google Scholar]
- 48.Rostker Bernard D. I Want You! The Evolution of the All-Volunteer Force. Santa Monica, CA: RAND Corporation; 2006. [Google Scholar]
- 49.Altschuler GC. Today’s vets get shortchanged on GI Bill. CNN. 2014 Jun 28; [Google Scholar]