

Abstract
We employed whole genome RNA-sequencing to profile mRNAs and both annotated and novel long noncoding RNAs (lncRNAs) in human naïve, central memory and effector memory CD4+ T cells. Loci transcribing both lineage-specific annotated and novel are adjacent to lineage-specific protein-coding genes in the genome. Lineage-specific novel lncRNA loci are transcribed from lineage specific typical- and super-transcriptional enhancers and are not multi-exonic, thus are more similar to enhancers RNAs. Novel enhancer associated lncRNAs transcribed from the IFNG locus bind the transcription factor NF-κB and enhance binding of NF-κB to the IFNG genomic locus. Depletion of the annotated lncRNA, IFNG-AS1, or one IFNG enhancer-associated lncRNA abrogates IFNG expression by memory T cells indicating these lncRNAs have biologic function.
Keywords: typical and super enhancers, long non-coding RNA, naïve and memory T cells
Introduction
Immunologic memory is a critical feature of the adaptive immune response conferring long-lasting protective immunity to the host. Memory T cells (CD4+ or CD8+) can be broadly divided into central (TCM) and effector memory (1, 2). TCM cells are CD45RO+, constitutively express CCR7 and CD62L, recirculate through lymphoid organs, express high levels of IL-2 after restimulation, proliferate vigorously compared to TEM cells, express low levels of IFN-γ and have limited effector function (3–5). TEM cells are also CD45RO+, but express low levels of CCR7 and expression of CD62L is heterogeneous. TEM cells preferentially reside in non-lymphoid tissues and rapidly produce effector cytokines in response to antigen stimulation (6). Despite our clear understanding of the critical importance of memory T cells to the adaptive immune system, our understanding of mechanisms driving differentiation into TEM and TCM lineages and maintaining these phenotypes is incomplete (3, 7).
The vast majority of genomic sequence is transcribed into either protein coding RNAs or non-coding RNAs (ncRNAs) (8). Long ncRNAs (>200 bp to distinguish them from short RNAs such as micro-RNAs or tRNAs) can be subdivided into long non-coding RNAs (lncRNAs), enhancer RNAs (eRNAs) and other species. Certain lncRNAs exhibit many features of mRNAs and are 5’ capped, spliced, and polyadenylated but exhibit little if any coding potential (9–12). About 20,000 lncRNA genes have been identified in vertebrate genomes; similar to the number of protein-coding genes. A growing array of regulatory functions has been ascribed to this new class of RNAs (9, 10, 13). The eRNAs, so named because they are transcribed near transcriptional enhancer elements and lack promoters in the classic sense, are divided into two classes, termed 1d-eRNAs and 2d-eRNAs (14–17). The 2d-eRNAs are transcribed in both sense and antisense orientations, tend to be relatively short (500–2,000 bp), are relatively unstable, and are not polyadenylated. The 1d-eRNAs are transcribed in one direction only, are polyadenylated, and are relatively stable. Thus, if strand-specific information is available, it is relatively straightforward to distinguish 2d-eRNAs from 1d-eRNAs. At this point, a clear set of rules has not emerged to distinguish lncRNAs from 1d-eRNAs, although types of epigenetic modifications and cellular locations may aid classification. In contrast to lncRNAs, biologic functions of 1d- and 2d-eRNAs are less well understood and it has been argued that enhancer transcription may simply represent transcriptional ‘noise’ without true biologic function ascribed to the transcribed RNA (18, 19).
DNA enhancer elements are defined by their ability to direct cell type specific gene expression programs determining cell identity. Stretch-enhancers, also referred to as super enhancers (SE), are a subset of enhancers exhibiting proximity to certain protein-coding genes that drive cell identity (20, 21). SEs differ from typical enhancers (TE) in size, transcription factor density, and ability to activate transcription. Both are marked by histone acetyltransferases, p300 and CBP, and H3K27-Acetylation (H3K27Ac) (22, 23). Bromodomain containing proteins (BRD), such as BRD2, BRD3, BRD4 and BRDT, are recruited to TE and SE H3K27Ac ‘marks’ to facilitate recruitment of RNA pol2 and activate transcription (24). Genes with SE structures are also enriched near single nucleotide polymorphisms linked to autoimmune disorders, including rheumatoid arthritis (RA), and expression of risk genes is modulated by the Janus kinase (JAK) inhibitor, tofacitnib, used to manage RA (22).
In our present study, we sought to identify mRNAs, and annotated and novel lncRNAs preferentially expressed in TN, TCM, and TEM cells. Our results support the idea that lineage-specific mRNAs, known lncRNAs and novel lncRNAs are co-expressed and these loci are co-localized in the genome with SEs and TEs. Further, inhibition of SE or TE function abrogates expression of annotated and novel lncRNAs and mRNAs at key gene loci required for lineage-specific cell phenotypes. One mechanism by which these novel lncRNAs act is to bind the transcription factor, NF-κB, and reinforce binding of NF-κB to chromatin. We also show that depletion of either the annotated lncRNA, IFNG-AS1, or one of the IFNG- associated novel lncRNAs abrogates IFNG transcription by TM cells, a critical function of the adaptive immune response.
Materials and Methods
Cell Isolation and Culture
Human PBMC were isolated from healthy control subjects with no chronic or acute conditions using Ficoll-hypaque centrifugation. All subjects included in the study, both initial RNA-sequencing and follow-up analyses, were male of Caucasian descent between ages of 25–32. TN, TCM, and TEM cells used for RNA-sequencing studies were isolated using the BD Pharmingen Human Naïve/Memory T cell panel (BD 561438) according to the manufacturer’s supplied protocol followed by fluorescence activated cell sorting. Relative purity of cell populations was assessed prior to RNA sequencing. For certain studies as described in the text, TN and total TM (TCM + TEM) were also isolated from total PBMC using the EasySep Naïve CD4+ T cell isolation kit (Stemcell Technologies 19555) or the EasySep Memory CD4+ T cell enrichment kit (Stemcell Technologies 19157) using the provided protocol. Tissue culture experiments were conducted in RPMI 1640 medium supplemented with 10% FBS, penn/strep, and L-glutamine. I-BET was obtained from EMD Chemicals (cat no. 401010; Calbiochem) and (+/−)-JQ1 (SML0974) was obtained from Sigma-Aldrich. The study was approved by the institutional review board at Vanderbilt University Medical Center. Written informed consent was obtained at the time of blood sample collection.
Chromatin Immunoprecipitation (ChIP)
ChIP procedures were followed as described using anti-H3K27-Ac antibody (ab6002; Abcam), anti-RNA polymerase II (ab24759; Abcam), anti-NF-κB, p65 subunit (ab47423), anti-T-bet (ab91103; Abcam), or anti-mouse IgG (10µg; sc-2025; Santa Cruz Biotechnology) (25, 26). Quantitative real-time PCR with SYBR green was used to measure DNA after ChIP and DNA purification. Primers used to amplify DNA are listed in Supplemental Tables 1 and 2). Quantitative ChIP assays were performed in triplicate and results from three or more independent experiments were averaged. We also performed a modified ChIP assay. Cells were solubilized in non-ionic detergents to isolate chromatin. Chromatin was treated with RNase for 10 min., fixed with formaldehyde, sonicated, and processed for ChIP assay using the same procedures described above.
RNA Isolation and QRT-PCR
Total RNA was isolated with TRI Reagent (MRC) and purified with the RNeasy MinElute Cleanup kit (Qiagen) using an on-column DNAse treatment to ensure absence of genomic DNA contamination. cDNA was synthesized from total RNA using the SuperScript III First-Strand Synthesis Kit (Life Technologies) using oligo-dT primers and purified using the Qiagen QiaQuick PCR purification kit. Transcript levels were measured in duplicate by qRT-PCR using TaqMan assays (ABI 7300 Real Time PCR System; Life Technologies) or using SYBR green (PowerUp SYBY Green; ABI 7300; Life Technologies). Expression levels were calculated relative to GAPDH using the ΔΔCT method. Primer pairs used in SYBR green reactions are listed in Supplemental Table 2.
Immunoprecipitations
Immunoprecipitations were performed as previously described (27, 28).
Cell Transfections
Flow cytometry experiments involving fluorescence-activated cell sorting and/or intracellular cytokine measurements siRNA transfection were performed as described previously (26).
RNA-seq Sample Preparation and Data Analysis
RNA was isolated using Tri-Reagent. Library preparation was performed using the Illumina Tru-Seq Stranded Total RNA kit. Whole genome RNA sequencing was performed by the Vanderbilt Technologies for Advanced Genomics (VANTAGE). An Illumina HiSeq2500 instrument was used to generate 100bp paired-end reads. A quality control step was performed at all stages of sequencing analysis including raw data, alignment and expression quantification using tools such as QC3 and MultiRankSeq (29–31). The RNA data were aligned with TopHat 2 and gene expression levels were quantified using Cufflinks (32–34). Differentially expressed genes measured using Cufflinks/Cuffdiff were expressed as FPKM (fragments per kilobase per million reads) and a cutoff of 0.5 FPKM and 1.0 FPKM was employed for lncRNA and mRNA measurements, respectively. Gene definition lists and results using the GRCh37/hg19 and GRCh38/hg38 were compared and generated similar results. Results from the GRCh37/hg19 builds are presented to permit a more direct comparison to previously described TE and SE locations (35), which were also derived from the GRCh37/hg19 build. False discovery rate (FDR < 0.05) was used to correct for multiple testing. De novo transcriptome assembly was performed on whole genome RNA-sequencing data from Illumina Tru-Seq Stranded Total RNA libraries using TopHat 2 and Cufflinks using upper quartile normalization (36) and fragment bias correction (37). Novel transcripts were assembled from reads prealigned to human genome 19 (GRCh37/hg19) using TopHat. Identification of novel lincRNA transcripts was accomplished using established methodologies (8, 38). Summarized pipelines for discovery of novel lincRNAs and prediction of transcripts with protein-coding potential were reported previously (26).
For example, to identify TN-specific lncRNAs, we calculated lineage-specific lncRNAs using the equation: (FPKM in TN) / [FPKM in (TCM + TEM) / 2] and so on for TCM- and TEM-specific memory lncRNAs. We required that each lncRNA exhibit a > 5-fold difference between groups. Relative lncRNA expression levels are shown for a portion of these lncRNAs using a heatmap with each column representing an individual lncRNA and each row representing expression levels of each of three replicate TN, TCM, or TEM samples (Fig 1B). Expression of these lncRNAs clustered according to cell type with TEM cells expressing the greatest number of cell-type specific lncRNAs followed by TN cells and TCM.
FIGURE 1.
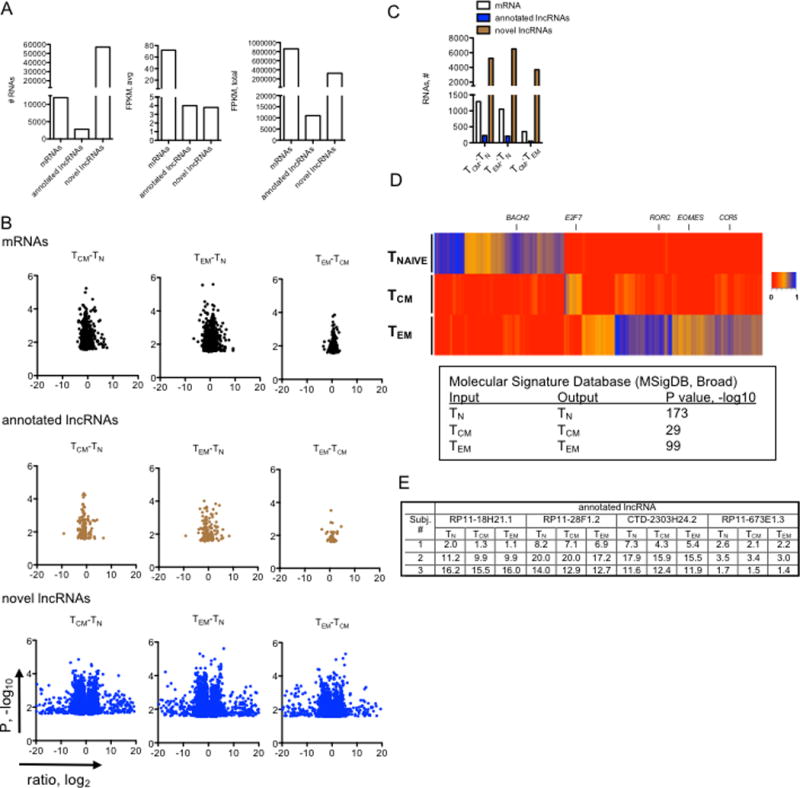
Cell-type specific expression of mRNAs and lncRNAs. (A) Left panel, total numbers of mRNAs (GRCh38 release, total protein-coding genes=19950), annotated lncRNAs (GRCh38 release, long non-coding genes=15767) and novel lncRNAs detected here by de novo assembly with average FPKM > 1 in at least one cell lineage; middle panel, average expression levels of the different RNA classes in TN, TCM and TEM cells; right panel, total expression levels of the indicated RNA classes in TN, TCM and TEM cells (N=3). (B) Volcano plots identifying lineage specific RNA classes after FDR correction, P < 0.05. X-axis represents the indicated expression ratios, log2, and the Y-axis is P value, -log10. (C) Total numbers of mRNAs, annotated lncRNAs and novel lncRNAs that show lineage specific expression (from (B). (D) Hierarchical clustering showing expression levels of mRNAs expressed by human CD4+ T cells determined by whole genome RNA-seq aligned to hg38 (N=3). A scale bar is adjacent to the heat map. MSigDB analysis of lineage-specific mRNAs (identified in the heatmap) as input, outputs from the MSigDB analysis are shown with corresponding P-values. (E) Individual variation in lncRNA expression. Expression levels in FPKM of four annotated lncRNAs are shown in TN, TCM and TEM subsets isolated from three individual subjects.
Genomic locations of total CD4+, naïve CD4, and memory CD4 super enhancers and typical enhancers were previously reported (20).
Statistical Analysis
Unless otherwise indicated, data are expressed as the mean ± S.D. of three or more independent experiments. Unless otherwise noted, significance was determined by Student’s t-test using GraphPad Prism Software (La Jolla, CA). P values < 0.05 were considered significant. χ2 analysis was performed using GraphPad Prism Software (La Jolla, CA). Fisher’s exact test was performed with excel, see http://udel.edu/~mcdonald/statfishers.html
Data Availability
The RNA-sequencing data generated by this study are accessible through NCBI’s Gene Expression Omnibus using the accession code GSE85294 (https://www.ncbi.nlm.nih.gov/geo).
Results
Lineage specific annotated lncRNAs in naïve and memory CD4 T cells
To initiate our studies, we isolated TN, TCM and TEM cells from age and gender matched healthy donors. We performed whole-genome RNA sequencing (RNA-seq) to identify lineage-specific RNAs. We found that ~12,000 of ~20,000 mRNAs, ~2,800 of ~20,000 annotated lncRNAs and ~57,000 novel lncRNAs were expressed with means >1 FPKM in at least one T cell lineage (Fig. 1A, left panel). Average expression levels of annotated and novel lncRNAs were comparable and substantially lower than mRNAs (Fig. 1A, middle panel). About 70%, 1%, and 30% of total RNA detected were represented by mRNA, annotated lncRNA, and novel lncRNA classes, respectively (Fig. 1A, right panel). We also analyzed differences in expression of individual RNA classes in TN, TCM and TEM lineages after false discovery rate (FDR) corrections. We found that lineage-specific quantitative differences in expression of novel lncRNAs were greater than lineage-specific differences in expression of either mRNAs or annotated lncRNAs (Fig. 1B). After FDR correction, we found that total numbers of lineage-specific novel lncRNAs were much greater than total numbers of lineage specific mRNAs or annotated lncRNAs (Fig. 1C). As an initial quality assessment, we further analyzed lineage-specific expression of mRNAs. The heatmap identifies mRNAs selectively expressed in TN, TCM and TEM lineages (Fig. 1D). As expected (39–41), BACH2 expression was highest in TN cells compared to TCM and TEM cells. In contrast to TN cells, both TCM and TEM cells expressed high levels of IFNG and CCR4. EOMES and genes that encode granzymes (GZMA, GZMH, and GZMK) were highly expressed by the TEM lineage. We identified only a small number of TCM-specific mRNAs compared to TN- and TEM-specific mRNAs. Next, we input our lineage-specific TN, TCM and TEM gene lists into the Molecular Signature Database (MSigDB, Broad) (42) and the outputs for these lists were TN, TCM and TEM, respectively. Thus, our isolated cells showed cell-type specific expression of genes encoding lineage-specific cytokines, transcriptional regulators and effector proteins.
Although the current study was not designed for this purpose, we performed a preliminary analysis to examine lncRNA profiles that may vary due to individual identity. We identified those lncRNAs whose expression varied most according to individual identity and not according to expression in a given TN, TCM, or TEM subset. We found that expression of certain lncRNAs seemed to vary more according to individual identity independent of expression in a specific T cell subset (Fig. 1E). Thus, individual identity also contributes to expression levels of certain lncRNAs in T cell subsets.
We assessed genomic relationships between genes encoding lineage-specific lncRNAs and genes encoding lineage-specific mRNAs as lncRNAs are known to regulate expression of neighboring protein-coding genes and lncRNA - protein-coding gene pairs exhibit cell-type specific co-expression (10). Examples include IFNG-AS1 and IFNG and TH2LCRR and IL4, IL5, and IL13 (26, 43, 44). We aligned positions of TN, TCM and TEM specific lncRNA genes with TN, TCM and TEM specific protein-coding genes across the genome. We used Pearson’s linear regression to determine if lncRNA:mRNA gene pairs were co-expressed in TN, TCM and TEM subsets (see Supplemental Table 3 for sample calculations). We next analyzed a window of up to 250kb from the transcription start site of each lncRNA gene to determine genomic distance between co-expressed lncRNA:mRNA gene pairs. For this window, we considered the absolute distance of each lncRNA gene from the nearby co-expressed mRNA gene. We found the highest proportion of lncRNA genes were intragenic with co-expressed mRNA genes (Fig. 2A). We also examined this relationship relative to the number of genes falling within this genomic window and obtained similar results (Fig. 2B). Many lncRNA genes were co-expressed with multiple lineage-specific protein-coding genes in the genome. We found that 51% and 49% of naïve- and memory-specific lncRNA genes were transcribed in antisense or sense directions relative to adjacent co-expressed protein coding genes, respectively (Fig. 2C). Thus, the majority of lineage-specific lncRNA genes were co-expressed with lineage-specific protein-coding genes.
FIGURE 2.
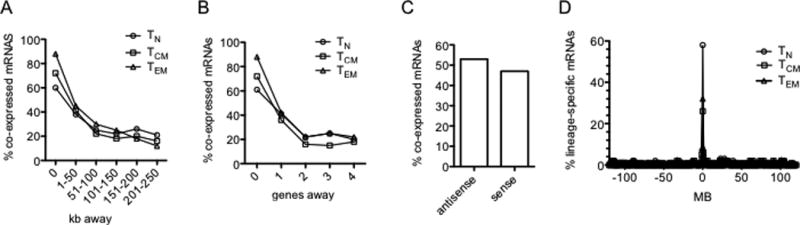
Relationships between genomic positions of co-expressed lineage specific protein-coding genes and annotated lncRNA genes. (A) Results are expressed as the % of lineage-specific mRNA genes (○, TN; □, TCM; Δ, TEM) co-expressed with lineage-specific annotated lncRNA genes relative to total mRNA genes within the indicated distance in kb from a lineage-specific annotated lncRNA gene. (B) As in (A) except results are expressed relative to the number of genes in the genome away from the lineage-specific annotated lncRNA gene. (C) Percentage of co-expressed lineage-specific mRNA genes transcribed in antisense or sense orientations relative to adjacent co-expressed lineage-specific annotated lncRNA genes. (D) Genes encoding lineage-specific mRNAs are enriched in the genome near lineage-specific annotated lncRNA genes. The y axis is the percent of total lineage-specific TN, TCM and TEM mRNAs (Fig 1, heatmaps). The x axis is the distance of the gene encoding a lineage-specific mRNA from the nearest gene encoding a lineage-specific annotated lncRNA. P values determined by c2 analyses, TN; P = 10−22, TCM; P=10−12, TEM; P=10−14.
We performed the opposite analysis by determining the frequency that lineage-specific protein-coding genes were near lineage-specific lncRNA genes in the genome to ask if lineage specific protein-coding genes were randomly distributed in the genome or were near lineage specific lncRNA genes. We found that 58%, 27%, and 33% of genes encoding TN, TCM or TEM specific mRNAs were within 300kb of a gene encoding a TN, TCM and TEM specific lncRNA, respectively (Fig. 2D). We conclude from these studies that lineage specific annotated lncRNA and mRNA genes are not randomly distributed across the genome but are co-localized in the genome (TN; P = 10−22, TCM; P=10−12, TEM; P=10−14, χ2 analysis).
Lineage specific novel lncRNAs, SEs, and TEs
We expanded our analysis to examine novel or non-annotated lncRNAs expressed in these cell types in a lineage specific fashion. These transcripts fulfilled criteria of lncRNAs (> 200 bp in length and lacked coding potential according to analysis using the coding potential assessment tool, CPAT, and PhyloCSF to estimate evolutionary coding potential). In contrast to the total number of annotated lncRNAs, de novo assembly of our RNA-seq datasets uncovered numerous TN-, TCM-, and TEM- lineage-specific lncRNAs as illustrated in the heatmap (Fig. 3A). We also evaluated the extent to which novel lncRNA genes were co-expressed with adjacent protein-coding genes. For comparison, we determined distances between mRNA genes selectively expressed in the different populations and found a broad distribution between lineage-specific protein coding genes in the genome (Fig. 3B, left panel). In contrast, when we examined genomic positions of lineage specific lncRNA loci and co-expressed lineage specific protein-coding genes, we found that ~50% of lineage- specific lncRNA loci were within 0–50 kb of a lineage-specific mRNA gene and another ~20% were within 50–100 kb of each other (Fig. 3B, right panel). Thus, as with annotated lncRNA loci, lineage specific novel lncRNA loci exhibited a nonrandom distribution in the genome positioned very near lineage-specific protein-coding genes. We also performed the opposite analysis by determining the frequency that lineage-specific protein-coding genes were near lineage-specific novel lncRNA genes in the genome to ask if lineage specific protein-coding genes were randomly distributed in the genome or were near lineage specific novel lncRNA genes. We found that 45%, 37%, and 57% of genes encoding TN, TCM, or TEM specific mRNAs were within 300kb of a gene encoding a TN, TCM, or TEM specific novel lncRNA, respectively (Fig. 3C). We conclude from these studies that lineage specific novel lncRNA and mRNA genes are not randomly distributed across the genome but are co-localized in the genome (P=10−18, 10−14, 10−19, TN, TCM and TEM, respectively, χ2 analysis).
FIGURE 3.
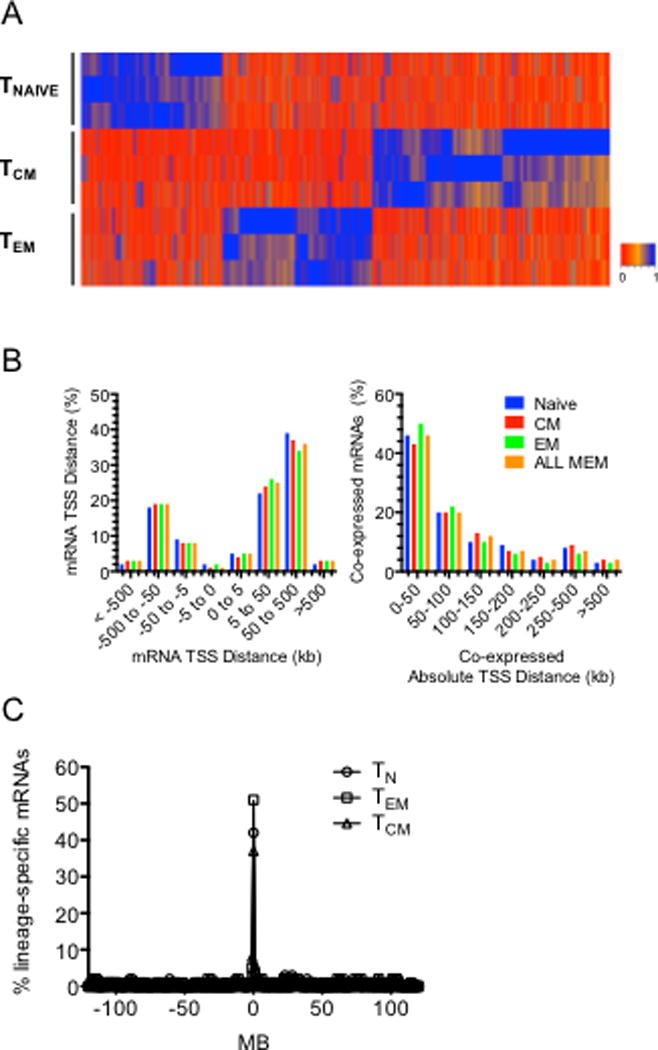
Discovery of lineage-specific novel lncRNAs. (A) Hierarchical clustering showing expression levels of novel lncRNAs expressed by human CD4+ TN, TCM and TEM cells determined by whole genome RNA-seq aligned to hg19 (N=3). (B) Co-localization of genes encoding lineage-specific mRNAs and novel lncRNAs in the genome. Left panel: % of lineage-specific protein-coding genes that are within the indicated distance in kb from another lineage-specific protein-coding gene, right panel: % of lineage-specific protein-coding genes that are within the indicated distance in kb from a co-expressed lineage-specific novel lncRNA-coding gene. (C) Genes encoding lineage-specific mRNAs are enriched in the genome near lineage-specific novel lncRNA loci. The y axis is the percent of total lineage-specific TN, TCM and TEM mRNAs (Fig 1, heatmaps). The x axis is the distance of the gene encoding a lineage-specific mRNA from the nearest loci encoding a lineage-specific novel lncRNA, P values determined by c2 analyses, TN, P = 10−21; TCM, P=10−14; and TEM P=10−19.
Relationship between novel lncRNAs and transcriptional enhancers
Transcriptional enhancers are known to express RNAs. We performed genome-wide analyses to further explore the relationship among protein-coding gene loci marked by high levels of lineage-specific novel lncRNAs and lineage-specific transcriptional super-enhancers (45) and typical-enhancers (TEs) identified by levels of H3K27-acetylation marks (20) shown in the Circos plot (Fig. 4A). We employed the following scheme: a) chromosomes with banding patterns and length in megabases in the outer ring, b) positions of CD4 TN and TM TEs and SEs and c) positions of TN, TCM and TEM lineage specific novel lncRNAs depicted in that order by the three inner rings as a function of expression levels. Although somewhat obscure in the Circos plot, we found a large overlap between genomic positions of SEs and TEs present in the different lineages, lineage-specific novel lncRNA loci, and lineage-specific mRNAs. We next ranked lineage-specific mRNAs according to total number of associated lineage-specific novel lncRNAs (Fig 4B, see also Supplemental Table 4), SEs according to total number of associated lineage-specific lncRNAs (Fig. 4C) and TEs according to total number of associated lineage-specific lncRNAs (Fig. 4D). Lineage-specific mRNA genes and lineage-specific SEs and TEs had the highest abundances of associated lineage-specific novel lncRNA loci (linear regression analysis, R2 > 0.9, P < 0.0001). Genes with a high abundance of lineage-specific lncRNA loci and associated SE and TE density encoded key lineage-specific transcriptional regulators (BACH2, KLF12, RORA, GATA3, ATXN1, LEF1), cytokines (IFNG) and receptors (ICAM2, EMB).
FIGURE 4.
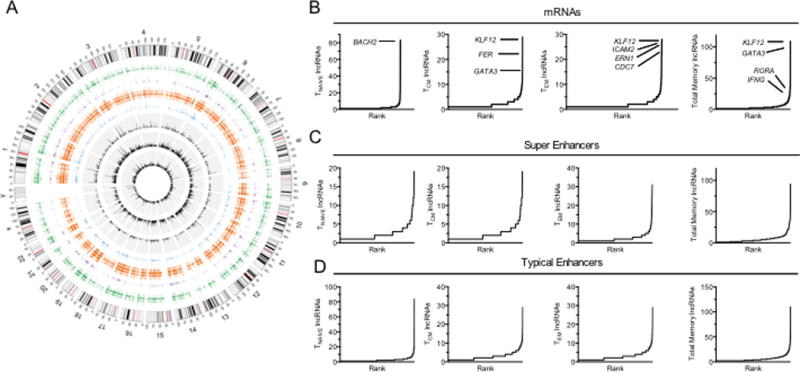
Relationships among lineage-specific lncRNAs and transcriptional enhancers. (A) Circosplot depicting genome-wide positions of CD4 naïve typical enhancers and super enhancers (purple) along with CD4 memory typical enhancers (orange) and super enhancers (blue) in the outer rings (from ref. 20). Bar graphs colored in black in the inner concentric circles show lineage specific novel lncRNAs in naïve (outermost), central memory, and effector memory (innermost) cells (B) Lineage specific mRNAs ranked by number of lineage-specific novel lncRNAs per gene loci. Ranks of certain gene loci are noted in the graphs. (C) Lineage-specific SE are ranked by number of novel lncRNAs per genomic locus. (D) Lineage-specific TEs are ranked by number of novel lncRNAs per genomic locus.
We next determined the distances between expressed novel lncRNA loci in the genome. We found that ~50% of novel lncRNA loci were within 1000 bp of another novel lncRNA loci and >90% were within 10,000 bp of another novel lncRNA genomic loci suggesting that novel lncRNA loci are clustered in the genome (Fig 5A). We refer to these small genomic loci that transcribe dense numbers of novel lncRNAs as ‘bins’ (Fig 5B). We found that the vast majority of lineage specific novel lncRNAs were transcribed from these bins that had an average size of <30 kb. Distances between ‘bins’ were much greater averaging ~ 600 kb indicating the nonrandom distribution of lncRNA loci in the genome. In large part, expression of all the lncRNAs transcribed from an individual bin exhibited lineage-specific expression patterns. Examples include a ‘bin’ with TN specific activity (Fig. 5C), TCM specific activity (Fig. 5D) and TEM specific activity Fig. 5E).
FIGURE 5.
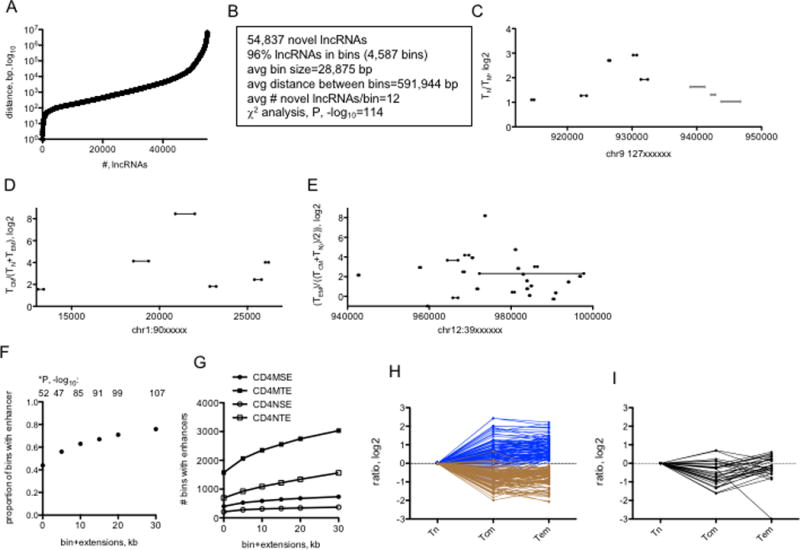
Genomic distributions of novel lncRNAs. (A) Distances between genomic loci transcribing unique novel lncRNAs. The X-axis ranks novel lncRNA loci according to distance to the next novel lncRNA loci and the Y-axis shows the actual distance in bp between neighboring lncRNA loci. (B) Characteristics of genomic ‘bins’ transcribing multiple novel lncRNAs. (C, D, & E) Examples of genomic bins selectively transcribing multiple novel lncRNAs in (C) TN relative to TM, D) TCM relative to TN and TEM, and (E) TEM relative to TN and TCM. X-axes show genomic positions from which novel lncRNAs are transcribed; lines illustrate sizes of the transcribed novel lncRNA. Y-axes are mean expression ratios, log2, between the indicated T cell lineages. (F) Genomic bins transcribing novel lncRNAs co-localize with TN and TM typical and super transcriptional enhancers (from ref. 20). We considered that the genomic bins may not exactly overlap with enhancers so we performed the analysis to include the proportion of bins that co-localize with an enhancer (0), and the proportion of bins that co-localized with enhancers if we extended bin size by 5, 10, 15, 20 or 30 kb in both 5’ and 3’ directions, X-axis. The Y-axis is the proportion of total bins with a TN or TM enhancer. P values, -log10, were determined by c2 analysis. (G) Number of bins within TM SE or TE (CD4MSE, CD4MTE) structures or TN SE or TE structures. X-axis is as in (F), Y axis is the number of bins with enhancers. (H&I) Re-analysis of RNA-seq data using ‘bins’ as definition lists. (H) After FDR correction, bins were identified that were over-expressed (blue lines) or under-expressed (brown lines) in TCM and TEM cells compared to TN cells. (I) Expression levels of bins differentially expressed in TCM relative to TN and TEM after FDR correction. Y-axes are expression ratios, log2, X-axes identify ratios; Tn=TN/TN, Tcm=TCM/TN, Tem=TEM/TN.
Given these data, we further analyzed the relationship between genomic positions of TN and TM enhancers and TN and TM bins and determined the proportion of lineage-specific ‘bins’ that contained lineage-specific enhancers. We found that lineage-specific ‘bins’ were highly enriched in the lineage specific SE and TE portion of the genome (Fig. 5F & 5G). In fact, almost 50% of ‘bins’ contained at least one lineage-specific SE or TE. Considering that ‘bin’ loci may not exactly overlap with TE and SE loci, we asked if expanding ‘bin’ size in either 5’ or 3’ directions increased the fraction of ‘bins’ with TEs or SEs and found that increasing ‘bin’ size by 20–30 kb increased the proportion of ‘bins’ with TEs and SEs to ~80%, which was also highly significant. We conclude that positions of lineage-specific bin loci in the genome overlap lineage-specific TE and SE loci.
We re-analyzed the RNA-seq data using bin loci as definition lists and determined total FPKM expressed from a given bin in TN, TCM and TEM lineages to determine if bin loci expressed in selective lineages. After FDR correction, we found that bins could be divided into three categories (Fig. 5H, I). About half the bins were highly expressed in TN lineages compared to TCM and TEM lineages and about half were highly expressed in TCM and TEM lineages compared to the TN lineage. We identified a small number of bins that were differentially expressed in the TCM compared to TN and TEM lineages. We conclude that lncRNAs expressed from these bins also exhibit lineage-specific activity.
IFNG-associated known and novel lncRNAs
We selected two genes for more detailed investigation: IFNG because it is not only selectively expressed by effector Th1 cells and silenced by effector Th2 and Th17 cells but is also expressed by TEM cells after TCR stimulation, and BACH2 because it is selectively expressed in TN cells and silenced after T cell activation. We found that the IFNG gene locus expressed a high density of novel lncRNAs in TEM and TCM cells (Fig. 6A). For IFNG, we examined RNA-seq tracks (~300 kb) not only in TN, TCM and TEM cells but also in primary and effector Th1, Th2 and Th17 cells (primary = 3d culture under respective polarizing conditions, effector = 5-7d culture under respective polarizing conditions followed by restimulation with anti-CD3 and additional 2d culture). Similar to TN cells, we found a paucity of lncRNAs transcribed by this region in Th2 and Th17 cells (Fig. 6A). In contrast, lncRNAs were highly transcribed from this region by Th1 cells as was IFNG with levels of lncRNAs somewhat higher in effector than primary Th1 cells. LncRNAs transcribed from the IFNG locus were similarly elevated in TCM and TEM cells being somewhat higher in TEM than TCM cells even though IFNG was not actively transcribed by resting TEM and TCM cells. Our de novo assembly also identified lncRNAs with defined sizes and genomic locations and these lncRNAs and genomic positions are identified below the RNA-seq tracks. Positions of TEs and SEs based on levels of H3K27-Ac modification in TM cells are also shown. We confirmed by RT-PCR that these novel lncRNAs were selectively expressed in TCM and TEM cells relative to TN cells (Fig. 6B). Each lncRNA transcribed from the IFNG locus was named relative to the IFNG transcriptional start site in the human genome. For example, for IFNG-R-163, the R is for RNA and -163 means it is transcribed from a position 163 kb from IFNG in the direction of the p-terminus. RT-PCR was performed using oligo-dT for cDNA synthesis so our conclusion is that these IFNG-R-lncRNAs are poly-adenylated.
FIGURE 6.
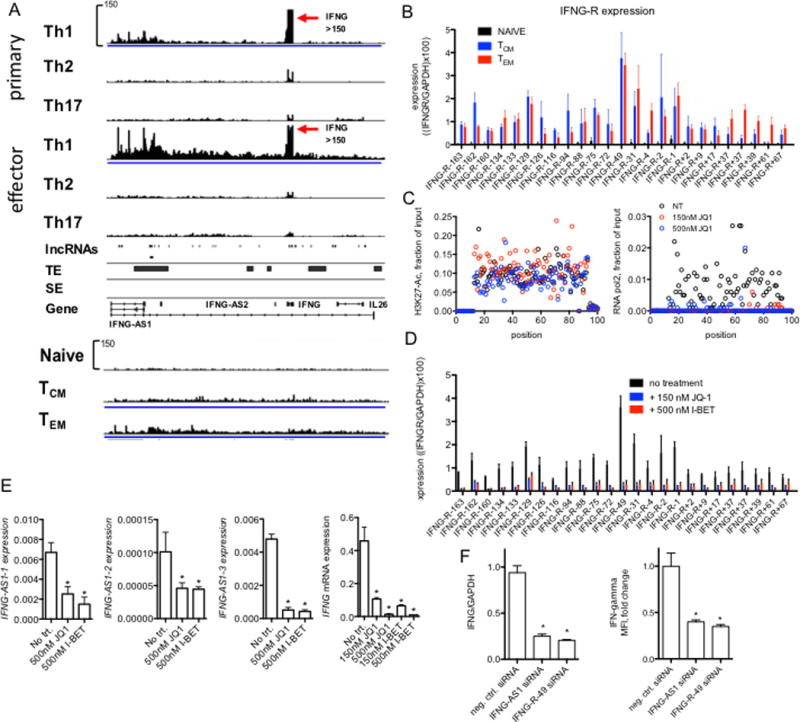
Novel lncRNAs at the IFNG locus. (A) RNA-seq tracks spanning ~300 kb from IFNG-AS1 past IL26 in primary and effector Th1, Th2 and Th17 cells, naïve CD4+ T cells and TCM and TEM cells. Below are positions of genomic loci encoding novel lncRNAs determined by de novo assembly, genomic positions of typical and super enhancers (TE & SE, respectively) identified in total CD4+ TM cells are also shown (from ref. 20). (B) PCR validation of RNA-seq results normalized to GAPDH. Each novel lncRNA is named relative to the IFNG transcriptional start site, - indicates toward the p-terminus, + toward the q-terminus, differences between either TCM and TN or TEM and TN were statistically significant, N=4, P < 0.05. (C) JQ1 treatment of memory T cells abrogates RNA polymerase II binding but not H3K27Ac across the IFNG locus. Indicated concentrations of JQ1 were added to memory T cells cultures. Cells were stimulated with plate-bound anti-CD3 for 24 hours and levels of H3K27-Ac (left panel) and RNA polymerase II (right panel) were determined by ChIP. For this analysis, we designed a tiling array. 100 PCR primer pairs were designed at ~3 kb intervals to span the 300-kb IFNG locus. Data are expressed as mean fraction of input (n=3) P < 0.05, ANOVA. (D) Total memory CD4+ T cells were cultured for 24 hr with JQ1 or I-BET to displace BRD-containing proteins from genomic loci. RNA was purified and levels of the indicated IFNG locus novel lncRNAs, IFNG-R-#, determined by PCR. Results are expressed relative to levels of GAPDH. P < 0.05, treated versus untreated (N=4). (E) JQ1 or I-BET inhibit IFNG-AS1 and IFNG expression. Total memory CD4+ T cells were treated with and without JQ1 or I-BET for 24 hr and stimulated with anti-CD3 for an additional 24 hr. Levels of three unique isoforms of IFNG-AS1 designated 1, 2, 3 (Fig. 6A), and IFNG were determined by PCR and normalized to levels of GAPDH, *=P < 0.05 (N=4). (F) Individual siRNAs targeting IFNG-AS1 or IFNG-R-49 were transfected into total memory CD4+ T cells prior to stimulation with anti-CD3 for 24 hours. Transfected cells were isolated by fluorescence activated cell sorting prior to mRNA analysis or to measure intracellular levels of IFN-g. P values were determined by unpaired T-test. Error bars are mean +/− S.D. * = p < 0.05.
TEs and SEs can be defined by levels of H3K27-acetylation (H3K27Ac). JQ1 and I-BET are cell permeable small molecules that displace BRD-containing proteins from acetylated lysine motifs and disrupt function of TEs and SEs but do not directly reverse H3K27Ac marks (46, 47) (37). We also found that the IFNG locus spanning about 300 kb (IFNG-AS1-IFNG-IL26) was marked by H3K27Ac in TM cells, which was not reversed by treatment with JQ1 (Fig. 6C, left panel). In contrast, RNA pol2 was also recruited to the IFNG locus in TM cells and RNA pol2 was displaced by treatment with JQ1 (Fig. 6C, right panel). To ask if lineage-specific novel lncRNA expression at these gene loci was linked to TE or SE function, we asked if displacement of BRD proteins by JQ1 or I-BET affected levels of novel lncRNAs transcribed from the IFNG locus. We found that both JQ1 and I-BET effectively inhibited expression of these lncRNAs in TM cells (Fig. 6D). Thus, these novel lncRNA transcripts are consistent with the definition of enhancer-associated RNAs or eRNAs.
Three unique isoforms of the known lncRNA, IFNG-AS1, exist in current human genome annotations. Levels of each of these transcripts were also reduced by treatment with JQ1 or I-BET (Fig. 6E). Although IFNG is expressed at low levels in resting TM cells, it is highly expressed after stimulation via the TCR. We also found that pre-treatment with JQ1 or I-BET abrogated induction of IFNG expression in TM cells (Fig. 6E). Transfection of an siRNA targeting either IFNG-AS1 or IFNG-R-49 led to marked reduction of both IFNG mRNA and protein expression (Fig. 6F). Taken together, these data demonstrate that both IFNG-AS1 and the enhancer-associated RNA, IFNG-R-49 are required for efficient induction of IFNG by TM cells.
NF-κB binds novel lncRNAs transcribed from the IFNG locus
Recent studies demonstrate that RNAs transcribed from enhancers bind the transcription factor, YY1, as well as the histone acetyltransferase, CBP, to enhance function of these proteins and stimulate transcription of target genes (48, 49). The pro-survival, pro-inflammatory transcription factor, NF-κB, as well as T-bet, have multiple binding sites across the IFNG locus and both are critical for IFNG expression (50). Thus, we asked if one function of the IFNG-R lncRNAs was to bind either T-bet or NF-κB. To explore this idea, we performed immunoprecipitations with either anti-T-bet or anti-NF-κB, p65 subunit, and measured IFNG-associated lncRNAs in the immunoprecipitates. We failed to detect IFNG-associated lncRNAs in the anti-T-bet immunoprecipitates but found that many IFNG-associated lncRNAs were detected in the anti-NF-κB immunoprecipitates indicating a portion of these enhancer-associated lncRNAs specifically associate with NF-κB (Fig. 7A & B). As a control experiment, we depleted cells of enhancer-associated lncRNAs by JQ1 treatment and found this treatment also resulted in loss of IFNG-associated lncRNAs from the anti-NF-κB immunoprecipitates (Fig. 7B). More importantly, using ChIP assays, we found that treatment of cells with JQ1 resulted in loss of NF-κB binding to chromatin across the IFNG locus (Fig. 7C). Next, we reasoned that if IFNG enhancer-associated lncRNAs contributed to affinity of NF-κB for IFNG locus genomic sites, then treatment of chromatin with RNase may reduce binding of NF-κB to IFNG genomic sites. To explore this possibility, we isolated chromatin without formaldehyde crosslinking, treated chromatin with RNase followed by formaldehyde cross-linking and processed chromatin for ChIP assays. We found that treatment of chromatin with RNase resulted in loss of NF-κB binding to IFNG genomic sites (Fig. 7D). We also treated isolated chromatin from TM cells with RNAse and found that this treatment resulted in release of substantial NF-κB protein from chromatin (Fig. 7E). Finally, we transfected cells with the siRNA specific for IFNG-R-49 or a scrambled control siRNA. Transfection of the siRNA specific for IFNG-R-49 reduced NF-κB binding to the IFNG-D-49 genomic DNA site but not several other sites across the IFNG locus (Fig. 7F). Our conclusion is that IFNG-enhancer associated lncRNAs contribute to maintaining binding of NF-κB to the IFNG locus and in general chromatin-associated RNAs contribute to localization of NF-κB to chromatin suggesting this notion may have general applicability.
FIGURE 7.
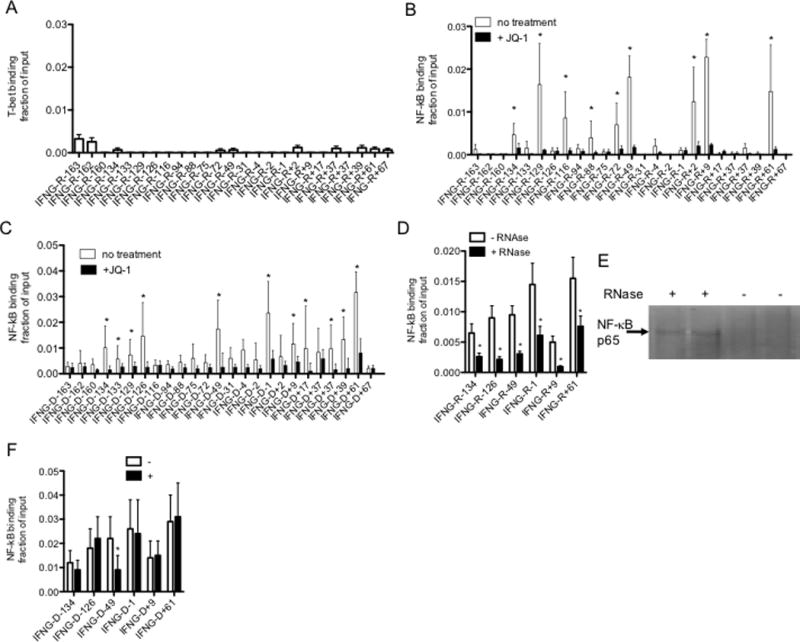
IFNG-associated lncRNAs bind NF-κB. (A&B) Cells were cultured with or without JQ1 (150 nM, 4 hr) and lysed. After lysis, (A) anti-T-bet and (B) anti-NF-κB, p65 subunit, immunoprecipitations (IP) were performed. Levels of each IFNG-R-lncRNA in the anti-T-bet, anti-NF-κB, p65 subunit, and isotype control immunoprecipitates were determined by PCR. Results are expressed as fraction of input of the indicated IFNG-associated novel lncRNAs relative to totals of each IFNG-R-lncRNA. Levels of IFNG-R-associated lncRNAs in the isotype control immunoprecipitates were negligible and therefore not included in the calculations. Error bars are S.D of 8 independent experiments, *=P < 0.05. (C) As in (B) except ChIP assays were performed to measure NF-κB, p65, binding to IFNG genomic locus sites. Results are expressed as fraction of input relative to an isotype control. Error bars are S.D of 5 independent experiments, *=P < 0.05. (D) Chromatin was isolated from TM cells by lysis in non-ionic detergents and treated with RNase, 10 min, RT. Chromatin was cross linked with formaldehyde and processed for ChIP assays. NF-κB, p65 binding is expressed as fraction of input, N=3, *=P < 0.05 comparing treated and untreated samples. (E) After RNAse treatment, chromatin was pelleted by centrifugation and supernatant fluids harvested and analyzed for NF-κB protein by western blotting. The arrow indicates the p65 subunit of NF-κB. (F) Cells were transfected with the siRNA targeting IFNG-R-49 (+) or a scrambled control siRNA (−) and cultured for 24 hr. Cultures were fixed with paraformaldehyde, harvested and processed for ChIP assays using an NF-κB, p65 subunit, antibody. The Y-axis shows NF-κB, p65 subunit, binding as fraction of input at the indicated IFNG genomic loci, X-axis.
Lineage specific novel lncRNAs at the BACH2 locus
We used a similar strategy to analyze novel lncRNAs transcribed from the BACH2 locus in TN and TM lineages. RNA-seq tracks identified high levels of transcripts across the BACH2 gene in TN cells that were very reduced in TCM and TEM cells (Fig. 8A). Our de novo assembly defined > 13 unique lncRNAs transcripts preferentially expressed in TN compared to TCM and TEM cells (Fig. 8B). As above, we confirmed these expression differences by PCR and obtained similar results (Fig. 8C). We treated TN cells with JQ1 and I-BET and found these inhibitors substantially lowered levels of BACH2 associated lncRNAs (Fig. 8D) and BACH2 mRNA (Fig. 8E). Thus, inhibitors that displace BRD-proteins from H3K27Ac motifs reduced levels of both BACH2 enhancer-associated novel lncRNAs and BACH2 mRNA. Overall, we find these results consistent with the notion that genomic loci surrounding lineage-specific protein-coding genes are enriched with lineage-specific TEs and SEs that transcribe cell type specific novel lncRNAs.
FIGURE 8.
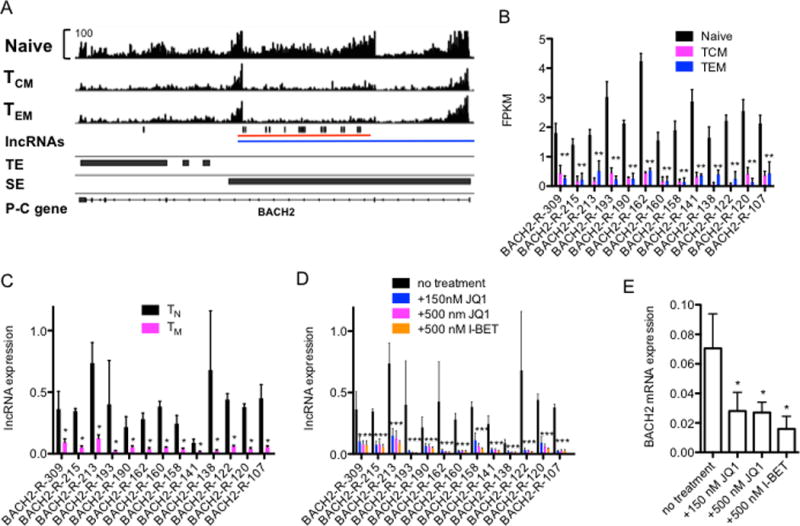
Novel lncRNAs at the BACH2 locus. (A) RNA sequencing tracks of the BACH2 gene in TN, TCM and TEM cells. Positions of known TEs and SEs in total CD4+ T cells are shown below the sequencing tracks (from ref. 20). Exon-intron structure of BACH2 is the bottom track. (B) Expression levels of the 13 BACH2-associated novel lncRNAs discovered by de novo assembly in TN, and TEM and TCM expressed as average FPKM, N=3, *=P < 0.05. (C) PCR verification of results in (B) expressed relative to GAPDH in TN and TM cells, N=4, *=P < 0.05. (D) TN cells were cultured for 24 hr with JQ1 or I-BET to displace BRD-containing proteins from genomic loci. RNA was purified and levels of 13 BACH2 associated novel lncRNAs were determined by PCR. Results are expressed relative to levels of GAPDH. N=4, *=P < 0.05. (E) As in (D), except levels of BACH2 mRNA were determined by PCR and are expressed relative to GAPDH. P values were determined using an unpaired T-test. Error bars are mean +/− S.D. * = p < 0.05
Discussion
Purposes of studies presented here were to (a) define differential expression patterns of mRNAs, annotated, and novel lncRNAs in human TN, TCM and TEM cells, (b) explore relationships among their expression patterns, and (c) among SEs, TEs and novel lncRNAs. We found that most lineage specific annotated lncRNAs are co-expressed with adjacent lineage-specific protein-coding genes in the genome suggesting these annotated lncRNAs contribute to regulation of lineage-specific protein-coding genes and help imprint these very specific cell phenotypes. Previous studies have also defined lineage specific expression patterns of both annotated and novel lncRNAs in T cells (26, 51, 52). Our de novo assembly identifies many more lineage-specific novel lncRNAs (~15000) compared to lineage-specific annotated lncRNAs (~200). Expression levels of annotated and novel lncRNAs are comparable and these novel lncRNA loci are also co-localized and co-expressed with lineage-specific protein-coding genes suggesting they also contribute to regulation of lineage-specific protein-coding genes and underlying cellular phenotypes. Many known lncRNA genes are composed of exons and introns and RNAs are spliced and polyadenylated to yield a mature lncRNA (10). Our de novo assembly reveals that most novel lncRNAs we discovered are polyadenylated but do not undergo splicing to yield mature lncRNAs. This probably explains why we uncovered many more novel lncRNAs compared to annotated lncRNAs described in previous reports (30, 38, 39). These novel lncRNAs are transcribed from enhancer regions found in hematopoietic cells, TEs and SEs, and inhibition of enhancer function abrogates novel lncRNA expression, suggesting they more closely resemble the class of 1d-eRNAs (17). Lineage-specific expression patterns indicate they are biologically regulated. Transcription of these novel lncRNAs is prevented by inhibition of enhancer function; as is transcription of adjacent lineage-specific protein-coding genes, IFNG and BACH2, further supporting the notion that their transcription is derived from active enhancers.
Additional roles and mechanisms of regulation of these novel lncRNAs are suggested by our studies. The IFNG genomic locus possesses enhancers specific for IFNG and for IFNG-AS1, which also regulates IFNG expression (50). Both groups of enhancers transcribe novel lncRNAs and are marked by high levels of H3K27Ac and RNA pol2. Both groups of novel lncRNAs are highly regulated during T helper cell differentiation in which IFNG is actively expressed or actively silenced. However, in resting TEM cells, where IFNG is not highly expressed, novel lncRNAs are still present at high levels as is the known lncRNA, IFNG-AS1. Our results also demonstrate that continued presence of IFNG-enhancer associated novel lncRNAs and IFNG-AS1 is necessary for rapid expression of IFNG by TEM cells in response to TCR stimulation. IFNG-AS1 is known to be required for efficient expression of IFNG by murine effector CD4+ and CD8+ lymphocytes so it may not seem unexpected that IFNG-AS1 is also required for efficient expression of IFNG by human TEM cells (44, 53). However, our results extend the function of IFNG-AS1 to TEM cells. On the other hand, it might seem somewhat unexpected that one novel lncRNA, IFNG-R-49, transcribed from the IFNG locus is required for efficient expression of IFNG by TEM cells when numerous novel lncRNAs are transcribed from this locus. However, it is worth noting that multiple transcriptional enhancers have been identified across this locus and several examples exist where deletion of a single 1 kb enhancer is sufficient to abrogate IFNG expression by Th1 effector cells and/or T memory cells (54–56). Novel IFNG-associated lncRNAs appear to act, in part, to increase binding of NF-κB to the IFNG genomic locus. In separate studies, enhancer-associated lncRNAs have been shown to bind the transcription factor YY1 and reinforce binding of YY1 to chromatin and bind the histone acetyltransferase, CBP to stimulate histone acetylation and transcription of target genes (48, 49). Thus, it would appear that one common mechanism by which these novel lncRNAs function at other genomic loci is to reinforce transcription factor and histone acetyltransferase binding to chromatin and function.
One question not completely addressed here is the functional relationship between IFNG-AS1 and enhancer-associated RNAs transcribed from the IFNG locus. Depletion of either IFNG-AS1 or IFNG-R-49 is sufficient to reduce IFNG transcription by TM cells. Depletion of IFNG-R-49 also reduces NF-κB binding at IFNG-D-49 but not other enhancer loci. Previous studies suggest that there are distinct NF-κB response enhancers required for IFNG-AS1 expression and distinct NF-κB response enhancers required for IFNG expression and both groups of enhancers contribute to expression of IFNG by targeting either IFNG-AS1 or IFNG genes (57, 58). Two alternate hypotheses that cannot be excluded are (1) that the major role of NF-κB is to drive IFNG-AS1 expression and IFNG-AS1, in turn, drives IFNG expression or (2) that the major role of IFNG-AS1 is to drive expression of the IFNG enhancer associated lncRNAs that, in turn reinforce NF-κB binding to IFNG enhancer elements and stimulate IFNG expression. Additional studies will be required to distinguish among these hypotheses.
Conversely, the transcriptional regulator, BACH2, is highly expressed in TN cells, represses effector Th programs, and is actively silenced in response to stimulation of T helper cell differentiation and silencing is sustained in TCM and TEM cells (40). The BACH2 gene locus transcribes a dense pattern of > 80 novel lncRNAs in TN cells and these novel lncRNAs are silenced in TCM and TEM cells. Inhibition of enhancer function in TN cells results in loss of BACH2 associated lncRNAs and BACH2 mRNA linking these novel lncRNAs to regulation of BACH2. Thus, enhancers via generation of these novel associated lncRNAs may positively regulate expression of protein-coding genes to allow commitment along various cell differentiation paths.
The general argument has been made that genes critically important for cell identity and function, such as BACH2 and IFNG are marked by SEs/TEs and, by extension, these novel enhancer-associated lncRNAs (35). The converse argument, that loci marked by high densities of SEs, TEs, and enhancer-associated lncRNAs may identify genes critical to maintain stability and function of a given cell lineage, such as TN, TCM, and TEM lineages, may also be correct. Therefore, it may be possible to identify new protein-coding genes critical for TN, TCM, and TEM stability and function by ranking them according to SE, TE, and novel lncRNA load as we have done here. For example, KLF12 is marked by high levels of lncRNAs and SEs and TEs in TM cells yet the role of this transcription factor in TM cell function and stability is poorly understood.
We understand a number of basic mechanisms that annotated lncRNAs employ to achieve their diverse regulatory functions. In contrast, our understanding of biologic functions of enhancer associated RNAs is more limited (17, 18, 59). One function of RNAs transcribed from TEs and SEs is that they bind the same transcription factors that bind the DNA elements from which the RNA is transcribed and these eRNAs help tether transcription factors to these regulatory DNA elements, which in turn stabilizes gene expression programs and reinforces cell phenotypes (48). Our studies are consistent with this type of mechanism. Other studies suggest that eRNAs may contribute to chromosome conformation and nuclear localization (60). Additional studies will be required to fully understand the diverse functions of this class of RNAs, not only in immunological memory, but also how they contribute to biologic complexity in general. Nevertheless, our results support the notion that both annotated lncRNAs and enhancer-associated lncRNAs play critical roles in maintaining identify of these key T cell lineages enabling these cells to carry out their unique adaptive immune functions
A major difference between TN and TM cells is that TN cells require TCR signaling and additional stimuli, such as cytokine receptor stimulation, to induce or activate a number of transcription factors that initiate differentiation paths making these cells competent to produce key inflammatory cytokines, chemokines, and other proteins required by the adaptive immune response while TM cells only require TCR signaling. This is also revealed by the transcription factor requirements to induce these genes. For example, Stat4, T-bet, NF-κB, and other transcription factors, play key roles in the induction of IFNG by developing Th1 cells while rapid IFNG expression by TM cells is relatively Stat4 and T-bet independent but still NF-κB dependent and TCR signaling alone is sufficient to activate NF-κB (6, 61). We propose that expression of enhancer-associated lncRNAs enables NF-κB recruitment to the IFNG locus by T-bet/Stat4 independent mechanisms driving rapid expression of IFNG by memory T cells thus reducing transcription factor requirements for expression of this key gene of the memory response. This underlying mechanism may also contribute to sustained and inducible expression of other key protein-coding genes allowing memory T cells to carry out their unique functions providing life-long immunity against pathogens, a key element of the adaptive immune response.
Supplementary Material
Supplemental Table 1. Primer sequences used to create a tiling array across the 300 kb IFNG locus for ChIP assays.
Supplemental Table 2. Primer sequences used to determine expression levels of the indicated genes and novel lncRNA loci.
Supplemental Table 3. Sample data and calculations used to construct figures 2 and 3
Supplemental Table 4. Indicated lineage-specific protein-coding genes ranked according to numbers of lineage-specific novel lncRNAs either intragenic or within 20kb of 5’ start site or 3’ end.
Acknowledgments
This work was supported by grants from the National Institutes of Health (R01 AI044924, DK007383, and DK20593) and the National Science Foundation (DGE0909667) and by CTSA award UL1TR000445. Vanderbilt’s VANTAGE core facility was supported in part by grants from the National Institutes of Health (P30 CA68485, P30 EY08126 and G20 RR030956).
Abbreviations
- lncRNAs
long noncoding RNAs
- eRNAs
enhancer RNAs
- ncRNAs
noncoding RNAs
- TCM
central memory T cells
- TEM
effector memory T cells
- TN
naïve T cells
- TE
typical enhancer
- SE
super enhancer
- H3K27Ac
H3K27-Acetylation
- BRD
Bromodomain containing proteins
- JAK
Janus kinase
- FACS
fluorescence activated cell sorting
- FPKM
fragments per kilobase per million reads
- RNA-seq
whole genome RNA sequencing
Footnotes
Author contributions
CFS and TMA designed research; CFS, GS, JTT, NC, JDH performed research; CFS, GS, JDH, YG, PSC, and TMA analyzed data; CFS and TMA wrote the paper; all authors reviewed, edited and approved the final version of the paper.
Disclosures
The authors declare no conflict of interest.
References
- 1.MacLeod MKL, Clambey ET, Kappler JW, Marrack P. CD4 memory T cells: What are they and what can they do? Semin Immunol. 2009;21:53–61. doi: 10.1016/j.smim.2009.02.006. [DOI] [PMC free article] [PubMed] [Google Scholar]
- 2.Marshall HD, Chandele A, Jung YW, Meng H, Poholek AC, Parish IA, Rutishauser R, Cui W, Kleinstein SH, Craft J, Kaech SM. Differential expression of Ly6C and T-bet distinguish effector and memory Th1 CD4(+) cell properties during viral infection. Immunity. 2011;35:633–646. doi: 10.1016/j.immuni.2011.08.016. [DOI] [PMC free article] [PubMed] [Google Scholar]
- 3.Pepper M, Jenkins MK. Origins of CD4(+) effector and central memory T cells. Nat Immunol. 2011;12:467–471. doi: 10.1038/ni.2038. [DOI] [PMC free article] [PubMed] [Google Scholar]
- 4.Sallusto F, Geginat J, Lanzavecchia A. Central memory and effector memory T cell subsets: function, generation, and maintenance. Annu Rev Immunol. 2004;22:745–763. doi: 10.1146/annurev.immunol.22.012703.104702. [DOI] [PubMed] [Google Scholar]
- 5.Sallusto F, Lenig D, Forster R, Lipp M, Lanzavecchia A. Two subsets of memory T lymphocytes with distinct homing potentials and effector functions. Nature. 1999;401:708–712. doi: 10.1038/44385. [DOI] [PubMed] [Google Scholar]
- 6.Zhu J, Yamane H, Paul WE. Differentiation of effector CD4 T cell populations (*) Annu Rev Immunol. 2010;28:445–489. doi: 10.1146/annurev-immunol-030409-101212. [DOI] [PMC free article] [PubMed] [Google Scholar]
- 7.Chang JT, Wherry EJ, Goldrath AW. Molecular regulation of effector and memory T cell differentiation. Nat Immunol. 2014;15:1104–1115. doi: 10.1038/ni.3031. [DOI] [PMC free article] [PubMed] [Google Scholar]
- 8.Hangauer MJ, Vaughn IW, McManus MT. Pervasive Transcription of the Human Genome Produces Thousands of Previously Unidentified Long Intergenic Noncoding RNAs. Plos Genetics. 2013;9 doi: 10.1371/journal.pgen.1003569. [DOI] [PMC free article] [PubMed] [Google Scholar]
- 9.Chang HY. Genome regulation by long noncoding RNAs. Cancer Res. 2013;73 doi: 10.1146/annurev-biochem-051410-092902. [DOI] [PMC free article] [PubMed] [Google Scholar]
- 10.Rinn JL, Chang HY. Genome Regulation by Long Noncoding RNAs. Annual Review of Biochemistry, Vol 81. 2012;81:145–166. doi: 10.1146/annurev-biochem-051410-092902. [DOI] [PMC free article] [PubMed] [Google Scholar]
- 11.Zambelli F, Pavesi G. RIP-Seq data analysis to determine RNA-protein associations. Methods Mol Biol. 2015;1269:293–303. doi: 10.1007/978-1-4939-2291-8_18. [DOI] [PubMed] [Google Scholar]
- 12.Liu G, Mattick JS, Taft RJ. A meta-analysis of the genomic and transcriptomic composition of complex life. Cell Cycle. 2013;12:2061–2072. doi: 10.4161/cc.25134. [DOI] [PMC free article] [PubMed] [Google Scholar]
- 13.Mousavi K, Zare H, Dell'orso S, Grontved L, Gutierrez-Cruz G, Derfoul A, Hager GL, Sartorelli V. eRNAs promote transcription by establishing chromatin accessibility at defined genomic loci. Mol Cell. 2013;51:606–617. doi: 10.1016/j.molcel.2013.07.022. [DOI] [PMC free article] [PubMed] [Google Scholar]
- 14.Lam MTY, Li WB, Rosenfeld MG, Glass CK. Enhancer RNAs and regulated transcriptional programs. Trends Biochem Sci. 2014;39:170–182. doi: 10.1016/j.tibs.2014.02.007. [DOI] [PMC free article] [PubMed] [Google Scholar]
- 15.Ren B. TRANSCRIPTION Enhancers make non-coding RNA. Nature. 2010;465:173–174. doi: 10.1038/465173a. [DOI] [PubMed] [Google Scholar]
- 16.Koch F, Fenouil R, Gut M, Cauchy P, Albert TK, Zacarias-Cabeza J, Spicuglia S, de la Chapelle AL, Heidemann M, Hintermair C, Eick D, Gut I, Ferrier P, Andrau JC. Transcription initiation platforms and GTF recruitment at tissue-specific enhancers and promoters. Nat Struct Mol Biol. 2011;18:956–963. doi: 10.1038/nsmb.2085. [DOI] [PubMed] [Google Scholar]
- 17.Natoli G, Andrau JC. Noncoding Transcription at Enhancers: General Principles and Functional Models. Annu Rev Genet. 2012;46:1–19. doi: 10.1146/annurev-genet-110711-155459. [DOI] [PubMed] [Google Scholar]
- 18.Li WB, Notani D, Rosenfeld MG. Enhancers as non-coding RNA transcription units: recent insights and future perspectives. Nature Reviews Genetics. 2016;17:207–223. doi: 10.1038/nrg.2016.4. [DOI] [PubMed] [Google Scholar]
- 19.Jacquier A. The complex eukaryotic transcriptome: unexpected pervasive transcription and novel small RNAs. Nat Rev Genet. 2009;10:833–844. doi: 10.1038/nrg2683. [DOI] [PubMed] [Google Scholar]
- 20.Hnisz D, Abraham BJ, Lee TI, Lau A, Saint-Andre V, Sigova AA, Hoke HA, Young RA. Super-enhancers in the control of cell identity and disease. Cell. 2013;155:934–947. doi: 10.1016/j.cell.2013.09.053. [DOI] [PMC free article] [PubMed] [Google Scholar]
- 21.Whyte WA, Orlando DA, Hnisz D, Abraham BJ, Lin CY, Kagey MH, Rahl PB, Lee TI, Young RA. Master transcription factors and mediator establish super-enhancers at key cell identity genes. Cell. 2013;153:307–319. doi: 10.1016/j.cell.2013.03.035. [DOI] [PMC free article] [PubMed] [Google Scholar]
- 22.Vahedi G, Kanno Y, Furumoto Y, Jiang K, Parker SC, Erdos MR, Davis SR, Roychoudhuri R, Restifo NP, Gadina M, Tang Z, Ruan Y, Collins FS, Sartorelli V, O'Shea JJ. Super-enhancers delineate disease-associated regulatory nodes in T cells. Nature. 2015;520:558–562. doi: 10.1038/nature14154. [DOI] [PMC free article] [PubMed] [Google Scholar]
- 23.Peeters JG, Vervoort SJ, Tan SC, Mijnheer G, de Roock S, Vastert SJ, Nieuwenhuis EE, van Wijk F, Prakken BJ, Creyghton MP, Coffer PJ, Mokry M, van Loosdregt J. Inhibition of Super-Enhancer Activity in Autoinflammatory Site-Derived T Cells Reduces Disease-Associated Gene Expression. Cell Rep. 2015;12:1986–1996. doi: 10.1016/j.celrep.2015.08.046. [DOI] [PubMed] [Google Scholar]
- 24.Chapuy B, McKeown MR, Lin CY, Monti S, Roemer MG, Qi J, Rahl PB, Sun HH, Yeda KT, Doench JG, Reichert E, Kung AL, Rodig SJ, Young RA, Shipp MA, Bradner JE. Discovery and characterization of super-enhancer-associated dependencies in diffuse large B cell lymphoma. Cancer Cell. 2013;24:777–790. doi: 10.1016/j.ccr.2013.11.003. [DOI] [PMC free article] [PubMed] [Google Scholar]
- 25.Chang SJ, Aune TM. Dynamic changes in histone-methylation 'marks' across the locus encoding interferon-gamma during the differentiation of T helper type 2 cells. Nat Immunol. 2007;8:723–731. doi: 10.1038/ni1473. [DOI] [PubMed] [Google Scholar]
- 26.Spurlock CF, Tossberg JT, Guo Y, Collier SP, Crooke PS, Aune TM. Expression and functions of long noncoding RNAs during human T helper cell differentiation. Nat Commun. 2015;6 doi: 10.1038/ncomms7932. [DOI] [PMC free article] [PubMed] [Google Scholar]
- 27.Spurlock CF, 3rd, Tossberg JT, Guo Y, Collier SP, Crooke PS, 3rd, Aune TM. Expression and functions of long noncoding RNAs during human T helper cell differentiation. Nat Commun. 2015;6:6932. doi: 10.1038/ncomms7932. [DOI] [PMC free article] [PubMed] [Google Scholar]
- 28.Spurlock CF, Tossberg JT, Matlock BK, Olsen NJ, Aune TM. Methotrexate Inhibits NF-kappa B Activity Via Long Intergenic (Noncoding) RNA-p21 Induction. Arthritis Rheumatol. 2014;66:2947–2957. doi: 10.1002/art.38805. [DOI] [PMC free article] [PubMed] [Google Scholar]
- 29.Guo Y, Ye F, Sheng QH, Clark T, Samuels DC. Three-stage quality control strategies for DNA re-sequencing data. Brief Bioinform. 2014;15:879–889. doi: 10.1093/bib/bbt069. [DOI] [PMC free article] [PubMed] [Google Scholar]
- 30.Guo Y, Zhao SL, Sheng QH, Ye F, Li J, Lehmann B, Pietenpol J, Samuels DC, Shyr Y. Multi-perspective quality control of Illumina exome sequencing data using QC3. Genomics. 2014;103:323–328. doi: 10.1016/j.ygeno.2014.03.006. [DOI] [PMC free article] [PubMed] [Google Scholar]
- 31.Guo Y, Zhao SL, Ye F, Sheng QH, Shyr Y. MultiRankSeq: Multiperspective Approach for RNAseq Differential Expression Analysis and Quality Control. Biomed Res Int. 2014 doi: 10.1155/2014/248090. [DOI] [PMC free article] [PubMed] [Google Scholar]
- 32.Kim D, Pertea G, Trapnell C, Pimentel H, Kelley R, Salzberg SL. TopHat2: accurate alignment of transcriptomes in the presence of insertions, deletions and gene fusions. Genome Biol. 2013;14:R36. doi: 10.1186/gb-2013-14-4-r36. [DOI] [PMC free article] [PubMed] [Google Scholar]
- 33.Trapnell C, Roberts A, Goff L, Pertea G, Kim D, Kelley DR, Pimentel H, Salzberg SL, Rinn JL, Pachter L. Differential gene and transcript expression analysis of RNA-seq experiments with TopHat and Cufflinks. Nat Protoc. 2012;7:562–578. doi: 10.1038/nprot.2012.016. [DOI] [PMC free article] [PubMed] [Google Scholar]
- 34.Trapnell C, Williams BA, Pertea G, Mortazavi A, Kwan G, van Baren MJ, Salzberg SL, Wold BJ, Pachter L. Transcript assembly and quantification by RNA-Seq reveals unannotated transcripts and isoform switching during cell differentiation. Nat Biotechnol. 2010;28:511–515. doi: 10.1038/nbt.1621. [DOI] [PMC free article] [PubMed] [Google Scholar]
- 35.Whyte WA, Orlando DA, Hnisz D, Abraham BJ, Lin CY, Kagey MH, Rahl PB, Lee TI, Young RA. Master Transcription Factors and Mediator Establish Super-Enhancers at Key Cell Identity Genes. Cell. 2013;153:307–319. doi: 10.1016/j.cell.2013.03.035. [DOI] [PMC free article] [PubMed] [Google Scholar]
- 36.Cervera R, Khamashta MA, Font J, Sebastiani GD, Gil A, Lavilla P, Mejia JC, Aydintug AO, Chwalinska-Sadowska H, de Ramon E, Fernandez-Nebro A, Galeazzi M, Valen M, Mathieu A, Houssiau F, Caro N, Alba P, Ramos-Casals M, Ingelmo M, Hughes GR E. European Working Party on Systemic Lupus. Morbidity and mortality in systemic lupus erythematosus during a 10-year period: a comparison of early and late manifestations in a cohort of 1,000 patients. Medicine (Baltimore) 2003;82:299–308. doi: 10.1097/01.md.0000091181.93122.55. [DOI] [PubMed] [Google Scholar]
- 37.Nagarajan S, Hossan T, Alawi M, Najafova Z, Indenbirken D, Bedi U, Taipaleenmaki H, Ben-Batalla I, Scheller M, Loges S, Knapp S, Hesse E, Chiang CM, Grundhoff A, Johnsen SA. Bromodomain protein BRD4 is required for estrogen receptor-dependent enhancer activation and gene transcription. Cell Rep. 2014;8:460–469. doi: 10.1016/j.celrep.2014.06.016. [DOI] [PMC free article] [PubMed] [Google Scholar]
- 38.Alvarez-Dominguez JR, Hu WQ, Yuan BB, Shi JH, Park SS, Gromatzky AA, van Oudenaarden A, Lodish HF. Global discovery of erythroid long noncoding RNAs reveals novel regulators of red cell maturation. Blood. 2014;123:570–581. doi: 10.1182/blood-2013-10-530683. [DOI] [PMC free article] [PubMed] [Google Scholar]
- 39.Tsukumo S, Unno M, Muto A, Takeuchi A, Kometani K, Kurosaki T, Igarashi K, Saito T. Bach2 maintains T cells in a naive state by suppressing effector memory-related genes. P Natl Acad Sci USA. 2013;110:10735–10740. doi: 10.1073/pnas.1306691110. [DOI] [PMC free article] [PubMed] [Google Scholar]
- 40.Roychoudhuri R, Hirahara K, Mousavi K, Clever D, Klebanoff CA, Bonelli M, Sciume G, Zare H, Vahedi G, Dema B, Yu ZY, Liu H, Takahashi H, Rao M, Muranski P, Crompton JG, Punkosdy G, Bedognetti D, Wang E, Hoffmann V, Rivera J, Marincola FM, Nakamura A, Sartorelli V, Kanno Y, Gattinoni L, Muto A, Igarashi K, O'Shea JJ, Restifo NP. BACH2 represses effector programs to stabilize T-reg-mediated immune homeostasis. Nature. 2013;498:506. doi: 10.1038/nature12199. + [DOI] [PMC free article] [PubMed] [Google Scholar]
- 41.Kuwahara M, Suzuki J, Tofukuji S, Yamada T, Kanoh M, Matsumoto A, Maruyama S, Kometani K, Kurosaki T, Ohara O, Nakayama T, Yamashita M. The Menin-Bach2 axis is critical for regulating CD4 T-cell senescence and cytokine homeostasis. Nat Commun. 2014;5 doi: 10.1038/ncomms4555. [DOI] [PMC free article] [PubMed] [Google Scholar]
- 42.Subramanian A, Tamayo P, Mootha VK, Mukherjee S, Ebert BL, Gillette MA, Paulovich A, Pomeroy SL, Golub TR, Lander ES, Mesirov JP. Gene set enrichment analysis: A knowledge-based approach for interpreting genome-wide expression profiles. P Natl Acad Sci USA. 2005;102:15545–15550. doi: 10.1073/pnas.0506580102. [DOI] [PMC free article] [PubMed] [Google Scholar]
- 43.Collier SP, Collins PL, Williams CL, Boothby MR, Aune TM. Cutting Edge: Influence of Tmevpg1, a Long Intergenic Noncoding RNA, on the Expression of Ifng by Th1 Cells. J Immunol. 2012;189:2084–2088. doi: 10.4049/jimmunol.1200774. [DOI] [PMC free article] [PubMed] [Google Scholar]
- 44.Gomez JA, Wapinski OL, Yang YW, Bureau JF, Gopinath S, Monack DM, Chang HY, Brahic M, Kirkegaard K. The NeST long ncRNA controls microbial susceptibility and epigenetic activation of the interferon-gamma locus. Cell. 2013;152:743–754. doi: 10.1016/j.cell.2013.01.015. [DOI] [PMC free article] [PubMed] [Google Scholar]
- 45.Koh JL, Chong YT, Friesen H, Moses A, Boone C, Andrews BJ, Moffat J. CYCLoPs: A Comprehensive Database Constructed from Automated Analysis of Protein Abundance and Subcellular Localization Patterns in Saccharomyces cerevisiae. G3(Bethesda) 2015;5:1223–1232. doi: 10.1534/g3.115.017830. [DOI] [PMC free article] [PubMed] [Google Scholar]
- 46.Delmore JE, Issa GC, Lemieux ME, Rahl PB, Shi J, Jacobs HM, Kastritis E, Gilpatrick T, Paranal RM, Qi J, Chesi M, Schinzel AC, McKeown MR, Heffernan TP, Vakoc CR, Bergsagel PL, Ghobrial IM, Richardson PG, Young RA, Hahn WC, Anderson KC, Kung AL, Bradner JE, Mitsiades CS. BET bromodomain inhibition as a therapeutic strategy to target c-Myc. Cell. 2011;146:904–917. doi: 10.1016/j.cell.2011.08.017. [DOI] [PMC free article] [PubMed] [Google Scholar]
- 47.Nicodeme E, Jeffrey KL, Schaefer U, Beinke S, Dewell S, Chung CW, Chandwani R, Marazzi I, Wilson P, Coste H, White J, Kirilovsky J, Rice CM, Lora JM, Prinjha RK, Lee K, Tarakhovsky A. Suppression of inflammation by a synthetic histone mimic. Nature. 2010;468:1119–1123. doi: 10.1038/nature09589. [DOI] [PMC free article] [PubMed] [Google Scholar]
- 48.Sigova AA, Abraham BJ, Ji X, Molinie B, Hannett NM, Guo YE, Jangi M, Giallourakis CC, Sharp PA, Young RA. Transcription factor trapping by RNA in gene regulatory elements. Science. 2015;350:978–981. doi: 10.1126/science.aad3346. [DOI] [PMC free article] [PubMed] [Google Scholar]
- 49.Bose DA, Donahue G, Reinberg D, Shiekhattar R, Bonasio R, Berger SL. RNA Binding to CBP Stimulates Histone Acetylation and Transcription. Cell. 2017;168:135–149. doi: 10.1016/j.cell.2016.12.020. e122. [DOI] [PMC free article] [PubMed] [Google Scholar]
- 50.Collier SP, Henderson MA, Tossberg JT, Aune TM. Regulation of the Th1 Genomic Locus from Ifng through Tmevpg1 by T-bet. J Immunol. 2014;193:3959–3965. doi: 10.4049/jimmunol.1401099. [DOI] [PMC free article] [PubMed] [Google Scholar]
- 51.Ranzani V, Rossetti G, Panzeri I, Arrigoni A, Bonnal RJ, Curti S, Gruarin P, Provasi E, Sugliano E, Marconi M, De Francesco R, Geginat J, Bodega B, Abrignani S, Pagani M. The long intergenic noncoding RNA landscape of human lymphocytes highlights the regulation of T cell differentiation by linc-MAF-4. Nat Immunol. 2015;16:318–325. doi: 10.1038/ni.3093. [DOI] [PMC free article] [PubMed] [Google Scholar]
- 52.Hu G, Tang Q, Sharma S, Yu F, Escobar TM, Muljo SA, Zhu J, Zhao K. Expression and regulation of intergenic long noncoding RNAs during T cell development and differentiation. Nat Immunol. 2013;14:1190–1198. doi: 10.1038/ni.2712. [DOI] [PMC free article] [PubMed] [Google Scholar]
- 53.Collier SP, Collins PL, Williams CL, Boothby MR, Aune TM. Cutting edge: influence of Tmevpg1, a long intergenic noncoding RNA, on the expression of Ifng by Th1 cells. J Immunol. 2012;189:2084–2088. doi: 10.4049/jimmunol.1200774. [DOI] [PMC free article] [PubMed] [Google Scholar]
- 54.Collins PL, Chang SJ, Henderson M, Soutto M, Davis GM, McLoed AG, Townsend MJ, Glimcher LH, Mortlock DP, Aune TM. Distal Regions of the Human IFNG Locus Direct Cell Type-Specific Expression. J Immunol. 2010;185:1492–1501. doi: 10.4049/jimmunol.1000124. [DOI] [PMC free article] [PubMed] [Google Scholar]
- 55.Collins PL, Henderson MA, Aune TM. Lineage-specific adjacent IFNG and IL26 genes share a common distal enhancer element. Genes Immun. 2012;13:481–488. doi: 10.1038/gene.2012.22. [DOI] [PMC free article] [PubMed] [Google Scholar]
- 56.Collins PL, Henderson MA, Aune TM. Diverse Functions of Distal Regulatory Elements at the IFNG Locus. J Immunol. 2012;188:1726–1733. doi: 10.4049/jimmunol.1102879. [DOI] [PMC free article] [PubMed] [Google Scholar]
- 57.Collier SP, Henderson MA, Tossberg JT, Aune TM. Regulation of the Th1 genomic locus from Ifng through Tmevpg1 by T-bet. J Immunol. 2014;193:3959–3965. doi: 10.4049/jimmunol.1401099. [DOI] [PMC free article] [PubMed] [Google Scholar]
- 58.Balasubramani A, Shibata Y, Crawford GE, Baldwin AS, Hatton RD, Weaver CT. Modular Utilization of Distal cis-Regulatory Elements Controls Ifng Gene Expression in T Cells Activated by Distinct Stimuli. Immunity. 2010;33:35–47. doi: 10.1016/j.immuni.2010.07.004. [DOI] [PMC free article] [PubMed] [Google Scholar]
- 59.St Laurent G, Wahlestedt C, Kapranov P. The Landscape of long noncoding RNA classification. Trends Genet. 2015;31:239–251. doi: 10.1016/j.tig.2015.03.007. [DOI] [PMC free article] [PubMed] [Google Scholar]
- 60.Li WB, Notani D, Ma Q, Tanasa B, Nunez E, Chen AY, Merkurjev D, Zhang J, Ohgi K, Song XY, Oh S, Kim HS, Glass CK, Rosenfeld MG. Functional roles of enhancer RNAs for oestrogen-dependent transcriptional activation. Nature. 2013;498:516. doi: 10.1038/nature12210. + [DOI] [PMC free article] [PubMed] [Google Scholar]
- 61.Lai W, Yu MJ, Huang MN, Okoye F, Keegan AD, Farber DL. Transcriptional Control of Rapid Recall by Memory CD4 T Cells. J Immunol. 2011;187:133–140. doi: 10.4049/jimmunol.1002742. [DOI] [PMC free article] [PubMed] [Google Scholar]
Associated Data
This section collects any data citations, data availability statements, or supplementary materials included in this article.
Supplementary Materials
Supplemental Table 1. Primer sequences used to create a tiling array across the 300 kb IFNG locus for ChIP assays.
Supplemental Table 2. Primer sequences used to determine expression levels of the indicated genes and novel lncRNA loci.
Supplemental Table 3. Sample data and calculations used to construct figures 2 and 3
Supplemental Table 4. Indicated lineage-specific protein-coding genes ranked according to numbers of lineage-specific novel lncRNAs either intragenic or within 20kb of 5’ start site or 3’ end.
Data Availability Statement
The RNA-sequencing data generated by this study are accessible through NCBI’s Gene Expression Omnibus using the accession code GSE85294 (https://www.ncbi.nlm.nih.gov/geo).