Abstract
In vivo spectroscopic measurements have the proven potential to provide important insight about the changes in tissue during the development of malignancies and thus help to diagnose tissue pathologies. Extraction of intrinsic data in the presence of varying amounts of scatterers and absorbers offers great challenges in the development of such techniques to the clinical level. Fabrication of optical phantoms, tailored to the biochemical as well as morphological features of the target tissue, can help to generate a spectral database for a given optical spectral measurement system. Such databases, along with appropriate pattern matching algorithms, could be integrated with in vivo measurements for any desired quantitative analysis of the target tissue. This paper addresses the fabrication of such soft, photo stable, thin bilayer phantoms, mimicking skin tissue in layer dimensions and optical properties. The performance evaluation of the fabricated set of phantoms is carried out using a portable fluorescence spectral measurement system. The alterations in flavin adenine dinucleotide (FAD)–a tissue fluorophore that provides important information about dysplastic progressions in tissues associated with cancer development based on changes in emission spectra–fluorescence with varied concentrations of absorbers and scatterers present in the phantom are analyzed and the results are presented. Alterations in the emission intensity, shift in emission wavelength and broadening of the emission spectrum were found to be potential markers in the assessment of biochemical changes that occur during the progression of dysplasia.
OCIS codes: (300.0300) Spectroscopy; (290.0290) Scattering; (260.2510) Fluorescence; (300.6280) Spectroscopy, fluorescence and luminescence; (120.4640) Optical instruments; (070.4790) Spectrum analysis
1. Introduction
Optical spectroscopic techniques based on fluorescence, have the potential to provide tissue discrimination during disease progression [1–4]. Hence, these techniques are expected to function as non-invasive alternatives to current tissue biopsy based clinical procedures in the long term. Extensive studies have been conducted in this direction for distinguishing normal and cancerous tissues in various organs such as human lungs, breast, colon, cervix, head etc [5–8]. In general, biological tissues are inhomogeneous structures, composed of complex milieu of several absorbers, scatterers and fluorophores that are present in different concentration at different depths [9, 10]. In such a turbid medium, intrinsic fluorescence extraction of individual fluorophores is hindered by the complex interplay of several factors like absorption and scattering from non-fluorescing agents within different sub layers of tissue [11]. In order to quantitatively analyze fluorescence from tissues for diagnosis, it is important to obtain the intrinsic fluorescence independent of these interfering factors.
Methods of extraction of intrinsic tissue fluorescence fall into two major categories. In the first category, it is treated as an inverse problem – model based extraction where the experimental spectrum from tissue will be compared with a modeled spectrum and finding the best match using nonlinear least square algorithms. In the second category, a large number of experimental spectra could be acquired from phantoms of known optical properties within the ranges of normal and malignant tissues. These spectra could be used to create a spectral database. Any unknown spectra could be compared and matched with the spectra from the database, employing suitable pattern searching algorithms to extract the desired optical properties. In both scenarios, realistic optical phantoms play an important role in the whole process of optical property extraction. Such phantoms could help in creating a spectral database to compare with the tissue spectra as well as help in studies related to development of more accurate computational models of light tissue interaction.
Most of the phantom based spectroscopic studies available in literature are based on liquid phantoms. Even though liquid phantoms do not include any realistic complexity in preparation, they are commonly used in modeling of infinite or semi-infinite single layer media with absorption, scattering and fluorescence effects [12, 13]. But solid phantoms have the ability to hold the desired geometrical shape, thickness and inhomogeneity as that of multi-layered tissues and can be fabricated with controlled optical properties [14, 15]. The concept of a thin, solid optical tissue phantom is a challenging task and has gained attention only in the recent past [16–19]. Fabrication of solid gelatin based mono and bilayer phantoms were attempted previously with individual layer thickness several orders higher than the original tissue to use with optical spectral studies [17]. Development of a hard, solid, polyurethane fluorescence phantom was reported to assess the sensitivity of fluorescence cameras and to validate the efficacy of interventional fluorescence molecular level imaging with greater depth dimensions compared to in-vivo conditions [18]. Multilayer silicone based phantoms with controlled optical properties and geometries that mimic the skin layers were fabricated for characterization and validation of optical systems [19]. These phantoms tried to address the concerns of original depth dimensions of epithelial layer, but with a hard and much thicker base dermis compared with original tissue. The fabrication of a soft, thin, multi-layered phantom that is tailored to the desired optical properties and depth dimensions of specific tissues yet remain unaddressed. A comprehensive report on the inclusion of different constituents with properties customized to the requirements of skin tissue as addressed in this paper could be extended to different tissue types at a later stage. Such optical phantoms will definitely open up possibilities in generating tissue specific spectral database to help with the quantitative biochemical analysis of the target site.
After fabrication, extraction of information from such solid phantoms requires precise characterization with respect to changes in composition. In the case of fluorescence spectroscopy, the varying amount of absorption and scattering present in different layers of the tissue during the progression of dysplasia offer cumulative distortion effects in the emission spectrum. In this work, we have attempted to demonstrate these challenges by recording the response of the fabricated phantom with independent and collective changes in its optical properties. The fabricated phantom is analyzed for changes in emitted fluorescence during the dysplastic transformation specific to skin tissue. The challenges experienced in extracting the fluorescence from the skin phantom in presence of interfering factors such as absorbers and scatterers is demonstrated in the case of Flavin Adenine Dinucleotide (FAD).
Clinical studies have shown that the changes in FAD fluorescence can be strongly correlated to tissue pathology [20, 21] in primary as well as metastatic tumors, wherein different types of cancer can have dermatological manifestations [22–24]. As FAD is a cofactor related with cellular metabolic activity, increase in FAD fluorescence can be attributed to the increase in metabolic activity in abnormal tissues [25]. In the case of dysplasia associated with precancerous development, an increase in FAD fluorescence is reported as compared to normal tissues [26] indicating tumor growth or large scale cell proliferation. Accordingly, the extraction of this intrinsic fluorescence of FAD is imperative and the study of distorting factors to this fluorescence needs to be carefully considered.
The study of distorting factors in tissue FAD fluorescence has been of considerable interest in the past. The distortions introduced in FAD fluorescence by scattering and absorption effects were studied on normal and dysplastic tissues [27] and a photon migration model was used to extract the intrinsic fluorescence. In another study for brain tumor diagnosis, a spectral filtering modulation approach was used to quantify the intrinsic fluorescence from absorption effects [28] and the tumor classification was done based on multivariate methods [29]. Polarized fluorescence studies conducted on phantoms fabricated using FAD, polystyrene microspheres and Protoporphyrin IX was also found to recover the intrinsic fluorescence from absorption and scattering effects [30]. In a different work, factors affecting the extraction of intrinsic fluorescence were studied in breast tissues and phantoms composed of FAD - polystyrene microspheres combination. Here, a hybrid diffusion theory-Monte Carlo simulation based theoretical model was used to recover the intrinsic fluorescence [31]. The ability of hemoglobin (Hb) to quench the emission of Tyrosine and FAD in tissue simulating liquid phantoms was studied previously by our group and it was inferred that the quenching of FAD fluorescence follows a static mechanism [32]. Most of these works were carried out using liquid optical phantoms / thick solid optical phantoms of single homogeneous layer, but an accurate extraction of spectral parameters in the case of in vivo studies could be facilitated by using optical phantoms of increased accuracy.
The goal of the current work is to fabricate a thin, soft, bilayer skin phantom mimicking the original layer dimensions and optical properties of the skin that could be used to analyze the challenges involved in the extraction of intrinsic FAD fluorescence caused by embedded absorbers and scatterers. Such an analysis is expected to aid with the diagnosis of dysplasia.
2. Materials and methods
Bilayer tissue phantom models were prepared with specific optical properties of fluorophores (FAD), absorbers (Hb, Melanin), scatterers (epithelial cells and dermal collagen fibrils) and dimensions that mimic normal and dysplastic tissues. Fluorescence measurements were obtained from the phantom sets in the visible region with the developed instrumentation.
2.1 Phantom preparation
Tissue simulating phantoms are artificial materials that are used to calibrate and test biomedical optical instrumentation for spectral imaging studies. These phantoms are also used to validate various models of light propagation within turbid media [33]. For spectroscopic studies, solid phantoms are fabricated with host material like polymers and aqueous gels which serve as a mechanical basis [34]. Scatterers, absorbers and fluorophores are suspended in the transparent host medium which forms the volume of phantom. Scattering agents frequently used in construction of tissue-like phantoms are micron-sized polystyrene latex spheres, liposyn and intralipid [35, 36]. Methylene blue, indocyanine green, India ink and Hb act as the major absorbers [37].
For the present study, bilayer tissue simulating phantoms were prepared using gelatin (Product No. ME9M591041; Merck Chemicals) as the host material. The top layer (epidermis) consisted of water soluble FAD (Product No. 064829; Sisco Research Laboratories, Mumbai, India) and cardiogreen (142μM) (Product No. 38883; Fisher Scientific, Mumbai, India). Cardiogreen was used to mimic the static absorption effects of skin melanin in all the test samples. Lyophilized powder human Hb (Product No. H0267; Sigma Aldrich, St Louis, MO) is used as the major absorber in the bottom dermal layer. Aqueous suspension of polystyrene beads of 0.30μm diameter (Product No. L9654; Sigma Aldrich, St Louis, MO) with varying concentrations is used as the major scatterer in both the layers. A detailed explanation of the optical properties chosen is mentioned in section 2.1.1. Table 1 presents the composition of bilayer phantoms mimicking normal and dysplasia conditions fabricated for fluorescence studies. These compositions were chosen to study the effects of changes in scattering and absorption on the emitted FAD fluorescence occurring during the transformation of tissue from normal and malignant states.
Table 1. Bilayer Phantom composition.
| Layer 1 | Layer 2 | ||||
|---|---|---|---|---|---|
| Epidermis | Dermis | ||||
| Phantom Number |
FAD μM |
Polystyrene beads (%volume fraction) | Hb μM |
Polystyrene beads (% volume fraction) |
|
| 1 | 200 | 0.45 | 15 | 0.45 | |
| 2 | 200 | 0.45 | 46 | 0.45 | |
| 3 | 200 | 0.45 | Nil | 0.45 | |
| 4 | 200 | 0.45 | Nil | Nil | |
| 5 | (Dysplastic) | 200 | 0.80 | 46 | 0.30 |
| 6 | (Normal) | 100 | 0.45 | 15 | 0.45 |
| 7 | 100 | 0.45 | 46 | 0.45 | |
| 8 | 100 | 0.45 | Nil | 0.45 | |
| 9 | 100 | 0.45 | Nil | Nil | |
| 10 | 100 | 0.45 | 15 | 0.30 | |
| 11 | 100 | 0.80 | 15 | 0.45 | |
For the present study, thin bilayer solid phantoms were fabricated using spin coating technique with desired epidermal and dermal thickness to mimic the optical similarity of human skin corresponding to forehead region of skin [38]. A detailed explanation of the procedure is given in section 2.1.2.
2.1.1 Optical properties of the phantom
Optical properties of the chemicals mentioned in Table 1 are given in Table 2 and Table 3. The spectral profile of chemicals was found to match closely with that of the tissue constituents in epidermal and dermal layers.
Table 2. Scattering coefficient (µs) and anisotropy values for varying volume fraction of polystyrene beads at excitation (450nm) and emission (526nm) wavelengths of FAD.
| Polystyrene beads (%volume fraction) | Scattering coefficient µs (cm−1) |
Anisotropy | ||
|---|---|---|---|---|
| 450nm | 526nm | 450nm | 526nm | |
| 0.30 | 79.193 | 55.900 | 0.745 | 0.775 |
| 0.45 | 118.789 | 83.850 | 0.752 | 0.772 |
| 0.80 | 211.180 | 149.066 | 0.761 | 0.776 |
Table 3. Absorption coefficient (µa) of FAD and Hb at excitation (450nm) and emission (526nm) wavelengths of FAD.
| FAD | Absorption coefficient | Hb | Absorption coefficient | ||
|---|---|---|---|---|---|
| (µM) | µa (cm−1) | (µM) | µa (cm−1) | ||
| 450nm | 526nm | 450nm | 526nm | ||
| 100 |
2.205 |
0.027 |
15 |
2.170 |
1.011 |
| 200 | 4.385 | 0.054 | 46 | 6.655 | 3.101 |
Each layer in the phantom is characterized by its intrinsic optical properties like absorption coefficient μa(λ), scattering coefficient μs(λ), anisotropy factor g(λ) and refractive index n(λ) as a function of wavelength λ(nm). The typical values of these parameters in the visible wavelength range were based on reported literature [25, 39–48]. Volume fraction of melanosomes which corresponds to the optical absorption coefficient μaepi(λ) of the epidermis is taken as 2% (for light pigmented skin) for the present study [42]. Spectral profile of cardiogreen is found to match with the properties of melanin in skin epidermal layer [40], as presented in Fig. 1(a). Absorption coefficient of the dermis is determined primarily by the absorption of Hb in blood and minor baseline skin absorption [44, 46, 48]. Typical concentrations of Hb mimicking normal and dysplastic tissues were obtained from literature [43]. Scattering coefficients μs(λ) and anisotropy g(λ) of epidermal and dermal layers of normal tissues and dysplastic conditions were approximated using the relations given in literature [40]. Scattering properties of polystyrene microspheres mentioned in Table 1 is found to match with the scattering properties of both the layers [39, 41, 47]. Different concentrations of FAD representing normal and abnormal conditions [25, 45] were also chosen for the current study as presented in Table 1.
Fig. 1.
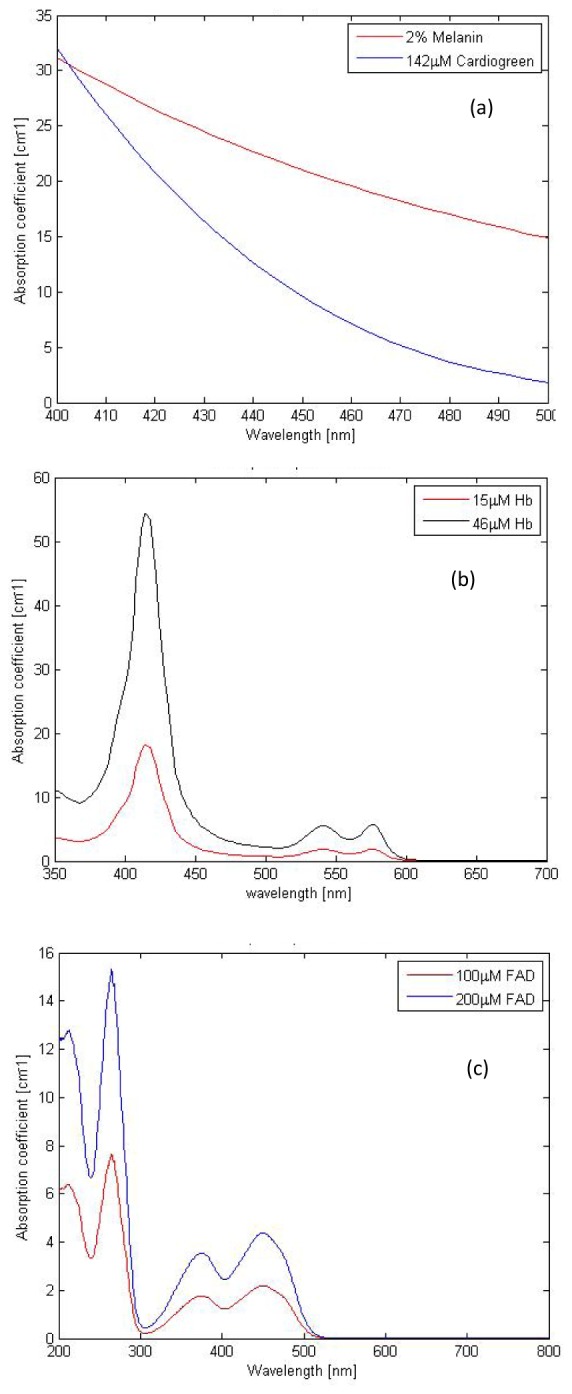
Absorption spectral profiles for (a) 142µM Cardio green (b) Hemoglobin (c) FAD used in the optical phantom fabrication.
The absorption coefficients μa(λ) of Hb and FAD were obtained using UV-VIS-NIR spectrophotometer (Varian Cary 5E) as given in Fig. 1(b) and 1(c). The scattering coefficients μs(λ) and anisotropy values g(λ) of polystyrene microspheres used as scattering agents were predicted using Mie theory [49].
Absorption and scattering coefficient of the tissue constituents at excitation and emission wavelengths of FAD are summarized in Table 2 and 3. The composition of tissue layers taken for the experiments was observed to have spectral signatures in close correlation with that of the real skin tissue constituents.
2.1.2 Method of phantom preparation
All the sample mixtures corresponding to the dermal layer were diluted with distilled water to the desired concentration of interest and sonicated using ultrasonic processor (UP50H, Hielscher Ultrasonics Inc.) to ensure uniformity in concentration and removal of bubbles. The solution was heated up to 60°C with added gelatin (4g) and the mixture was allowed to cool until 35°C. Glass slide substrates were rinsed with distilled water and acetone, and dried at an ambient temperature of 30°C. 1 ml of the corresponding sample mixture was poured onto the center of the glass slide, placed on a spin -coater (Spin NXGP1AA03, Apex Instruments, India). The spin -coater was operated for 62 s (acceleration time of 2 s and spin time of 60 s) at a spin speed of 250 rpm to achieve the desired layer thickness. The epidermal layer was fabricated on top of the dermal layer. For this, the sample mixture corresponding to the epidermal layer was heated up to 60°C with added gelatin (3g) and the mixture was allowed to cool until 50°C. The mentioned values of temperature were optimized after a number of experimental trials. The layers were fabricated with epidermal thickness 110μm and dermal thickness 150 μm with an error limit of ± 2%. Thickness of the tissue phantom was verified using a scanning electron microscope (FESEM Quanta-3D). The scanning electron microscope image of the fabricated phantom sample is shown in Fig. 2 which shows the actual thickness of both the layers.
Fig. 2.
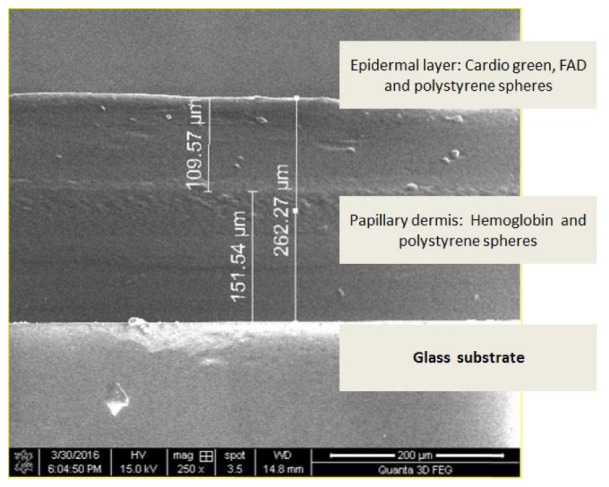
Scanning electron microscope image of the fabricated phantom (two layers are shown along with the glass substrate).
2.2 Experimental setup
The experimental arrangement developed for the present study is shown in Fig. 3((a) schematic and (b) photograph). The setup was highly portable, simple in arrangement and consisted of a compact 12VDC, 40mA 450nm LED light source (AvaLight-LED450, Avantes Inc.), a spectrometer (USB 4000, Ocean Optics Inc.) with high performance linear CCD-array detector with spectral range 200-800 nm, and a custom made optical probe with six illumination fibers and a central collection fiber, each having a diameter of 750 µm. The illumination to the sample was provided at an angle of 45 degrees to the phantom surface for backscattering elimination to facilitate the fluorescence collection from the sample. The probe collects the emitted fluorescence and directs it to a PC integrated spectrometer. The source to detector fiber distance in the probe distal end was 750 µm and the fibers had a numerical aperture of 0.22. Fluorescence measurements were obtained in the wavelength range from 500 to 650nm with an integration time of 150ms. The sample was attached to a precision Vernier gauge and the distance between the probe and the sample was maintained at 0.5mm throughout the experimental study.
Fig. 3.
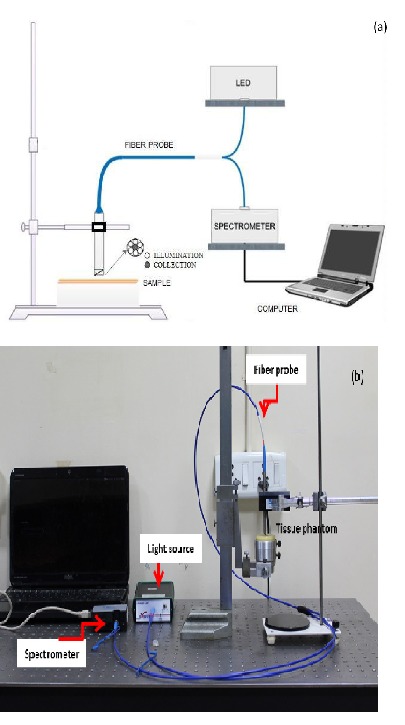
Experimental setup (a) Schematic (b) Photograph.
3. Fluorescence measurements: Results
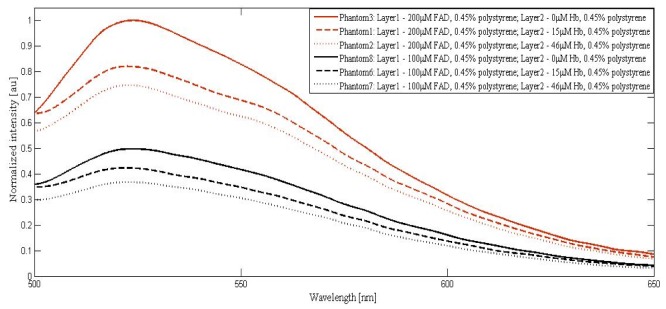
Fluorescence measurements were obtained from the fabricated bilayer phantom sets using the instrumentation as mentioned in section 2.2 and emission spectra were observed in the wavelength range of 500nm to 650nm. Figure 4 shows the normalized fluorescence spectrum obtained from the phantom series with varying compositions of FAD and Hb and fixed concentration of polystyrene microspheres, to exhibit the changes in the collected FAD fluorescence with variations in Hb. The spectra were normalized with respect to the spectrum from the phantom composition 200µM FAD + 0.45% polystyrene microspheres, corresponding to maximum emission intensity, which hereafter will be referred to as the reference spectrum.
Fig. 4.
Fluorescence spectrum of the phantom sets with 0.45% volume fraction of polystyrene in both the layers and varying concentrations of FAD and Hb.
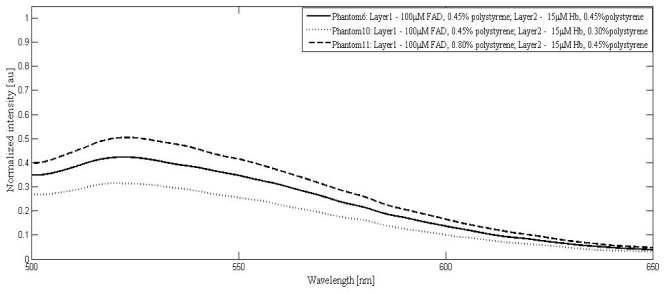
Experiments were carried out with tissue phantoms having fixed FAD and Hb concentrations and varying scatterer concentration in epidermal as well as dermal layers and the corresponding emission spectra from the samples are shown in Fig. 5.
Fig. 5.
Fluorescence spectrum of phantom sets with 100μM FAD, 15μM Hb and varying volume fractions of polystyrene microspheres in layer 1 and layer 2.
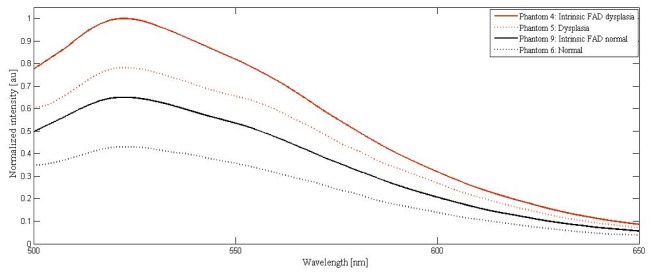
Cumulative effects for the increased epithelial scattering and decreased dermal scattering along with absorber changes present in dysplastic conditions (phantom set 5, Table 1) is demonstrated in Fig. 6 and compared with its normal counterpart (phantom set 6, Table 1). The spectra for phantom sets 4 (intrinsic fluorescence in the dysplastic condition in the absence of absorbers and dermal scatterers; Table 1) and 9 (intrinsic fluorescence in the normal condition in the absence of absorbers and dermal scatterers; Table 1) are also plotted for comparison in Fig. 6.
Fig. 6.
Fluorescence spectrum from phantom sets mimicking normal and dysplasia conditions.
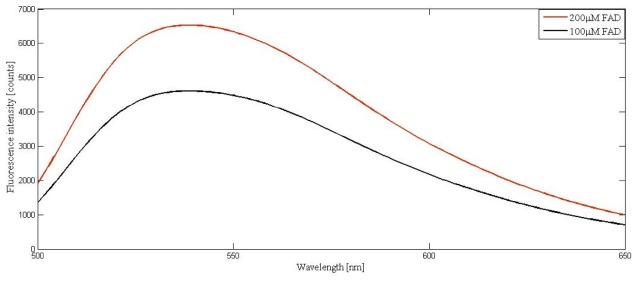
It is to be noted that for the study presented in section 4.4, the intrinsic normal spectra was taken from phantom composition 9, which included 0.45% scatterers in the epidermal layer to facilitate the emitted fluorescence detection in the diffused backscattering geometry. However, comparison of the FAD spectra obtained from normal and dysplastic samples, without the addition of absorbers as well as the scatterers, reveals the actual deviation as represented in Fig. 7 at the selected concentrations (the experiments were carried out in 90 degree geometry for these spectral measurements).
Fig. 7.
FAD fluorescence from liquid phantoms without addition of scatterers and absorbers.
4. Discussions
4.1 Effects of absorber concentration
Referring to Fig. 4, all the spectra had dominant peaks corresponding to the emission of FAD. For 200µM FAD, a blue shift in the emission peak (526 to 525nm) was observed with an increase in Hb concentration. These graphs showed a decrease in normalized emitted FAD fluorescence intensity with the addition of absorbers. The intensity was reduced to 0.8 for 15µM Hb and 0.75 for 46µM Hb from its maximum normalized unit corresponding to 0 µM Hb. For 100µM FAD, the emissions from sample were blue shifted by 1 nm (from 526 to 525nm) with the addition of 15µHb and 2nm (from 526 to 524nm) with the addition of 46µM Hb. The sensitivity of wavelength shift is found to increase with decreased amounts of FAD. This could be attributed to the increased effect of absorbers at the reduced FAD concentration. The fluorescence intensity decrements, in the case of 0µM, 15µM and 46µM Hb were found to be 0.50 to 0.42 and 0.35. The reduction in the relative change in fluorescence intensity compared to the 200µM counterparts with added absorber could be due to the relatively increased amount of scatterers available at the reduced fluorophore concentration.
The decrement in FAD emission intensity could be attributed to two factors: (i) The absorption of the emitted fluorescence by Hb molecules: It is to be noted that Hb used for the study has dominant absorption peaks at 418nm, 548nm and 578nm and FAD has an emission peak at 526nm in the visible region, resulting in the absorption by Hb specifically at 548nm and 578nm. (ii) There was also an equal effect of source absorption by Hb molecules at 450nm contributing to the reduction in excitation available for FAD. The Hb concentration considered for the study corresponded to the absorption coefficients of normal and malignant tissues and the combined effects of wavelength shift and intensity alterations could provide potential information in discriminating the tissues.
4.2 Effects of scatterer concentration
All the spectra were normalized with respect to the reference spectrum as demonstrated in Fig. 5. In the case of dysplasia, while the epithelial size / density changes increase sample scattering, a corresponding decrease in the dermal scattering limits the overall collected emission intensity from the target sample. The selected scatterer concentrations in this study account for the increased scattering due to changes in epithelial cell density and decreased dermal scattering during disease progression.
Figure 5 demonstrates the effects of changes in epithelial and dermal scattering independently. It is observed that as the volume fraction of scattering agent in first layer is increased from 0.45% to 0.80% (phantoms 6 and 11), the normalized intensity of FAD at the emission peak increases from 0.42 to 0.50. The increase in epithelial scattering is found to shift the entire spectrum upwards as compared to the spectrum corresponding to the normal tissue. The peak wavelength was red shifted by 1 nm (525 to 526nm). Decrement in dermal scatterer concentration from 0.45% to 0.30% (phantom 6 and 10) caused the emission intensity to decrease from 0.42 to 0.32. Additionally, a blue shift of 2nm (525 to 523nm) was observed for FAD emission peak in this case.
4.3 Effects of spectral broadening
Spectral broadening effects were observed to accompany the changes in sample scattering. To analyze these changes, full width at half maximum (FWHM) as an estimate of the spectral line width were computed for the fluorescence spectra captured from the phantom sets with 100µM FAD and varying compositions of absorbers and scatterers. The phantoms considered for this analysis uniformly contained 100µm FAD in layer 1, the top epidermal layer. FWHM values of the spectra with zero, 15 and 46 µM Hb in layer 2, the bottom dermal layer, with fixed scatterer concentration were found to be 82.86 nm, 82.70nm and 82.57nm respectively. The normalized percentage changes in FWHM with respect to zero added absorber were estimated to be 0.2% and 0.3%. To analyze the effect of spectrum broadening with varying concentrations of scatterer, FWHM values were computed for the spectra with fixed absorber concentrations (15µM Hb), and varying scatterer concentrations. For phantoms with increased scatterer concentration (0.8% v/v) in layer 1, the normalized percentage change in FWHM was computed to be 0.4%. For phantoms with decreased scatterer (0.30%) in layer 2, the normalized FWHM percentage was 3.5%. This increase in percentage line width compared to the previous case could be attributed to the depth dimension of the scatterers (layer 2) facilitating predominant multiple scattering. Any changes in multiple scattering could contribute to the light beam broadening and subsequent broadening of the emitted spectrum [50]. Cellular organelles such as mitochondria, thin fibrillar structures of connective tissue and RBC are the main scatterers contributing to the multiple scattering in living tissue [51] and hence the observations from the phantoms could find similarities while observing spectra from real tissues as well. In comparison with the absorber effects, scattering was found to be the primary factor responsible for the spectral line width alterations.
4.4 Normal and dysplastic tissues
In Fig. 6, as during the disease progression, the changes in FAD, Hb and scatterers occur simultaneously, phantom sets 6 and 5 (Table 1) were used for experimentation in mimicking the conditions of normal and dysplastic tissues. These spectra account for the simultaneous changes in absorption and scattering that occur during the disease progression such as increase in Hb concentration, increase in epidermal scattering and decrease in dermal scattering in dysplastic tissue compared to the normal tissue.
Comparing the spectra collected from phantom sets 4 and 9, the normalized fluorescence intensity in the case of intrinsic dysplasia is found to be enhanced to 1.00 from 0.64, with a corresponding percentage change of 36.00%. As expected, no shift in wavelength was observed. Spectral broadening in the dysplastic case was calculated and found to be minimal (0.2%). In the case of spectra collected from phantom sets 6 and 5, the following were observed. The intensity alterations were quantified to be 43.58%. A net shift of 1 nm was observed for the emission peak as a result of the cumulative changes in decreased dermal scattering, increased epithelial scattering and increased absorption by Hb. The dysplastic spectrum was observed to be broadened by 1.51% indicating the pronounced decrement in dermal scattering as compared to epithelial scattering.
In summary, the present study indicates that between normal and dysplastic tissues (i) changes in emission peak is predominantly caused by absorbers (ii) changes in peak wavelength shift is caused by the cumulative effect of absorbers and scatterers and (iii) changes in spectral line width is caused by dermal scatterers predominantly in comparison with the intrinsic counterparts.
As mentioned before, the changes in normal and dysplastic fluorescence intensity in the presence of absorbers and scatterers are found to be more as compared to the intrinsic changes and this difference is expected to increase with the incorporation of the realistic FAD concentration found in tissues. This difference effect will be more pronounced while employing the realistic FAD concentrations in the nM range within the fabricated tissue. The identification of FAD changes in this realistic range requires enhanced sensitivity and resolution in spectral detection, which could be achieved by alteration / upgrading in the existing experimental detection scheme. These changes can influence a fluorescence spectroscopy based diagnostic test for dysplasia involving FAD. Here the clinical outcome may be positive (cancer) or negative (healthy) depending on the increase or decrease in the FAD concentrations obtained [5]. Such a diagnostic test could result in false negative result with the increase of Hb in the underlying dermal layer associated with the disease progression, depending on the tradeoff between the corresponding increments of individual constituents. As the optical phantom fabricated in this work is reflective of different kinds of optical property changes in the tissue during the progression of dysplasia, this methodology could further be extended to the extraction of other fluorophore concentrations as well. This will help a more comprehensive assessment of dysplasia using optimal multivariate algorithms. Such experimental spectra database generated in future could offer solution strategies for fluorophore concentration extraction employing pattern recognition algorithms. In addition, as these phantoms are multilayered, they could be further employed to extract layer-wise fluorescence using spatial frequency domain imaging techniques, which will be dealt with in future. Also these phantoms could be extended to multilayer models corresponding to different kinds of tissues with varied optical properties and morphology.
5. Conclusions
In this paper, we have investigated the factors affecting the extraction of intrinsic FAD fluorescence from epidermal layer of tissues for diagnosis of dysplasia by creating skin tissue mimicking bilayer, thin, soft, solid phantoms with desired optical properties which closely match with the optical properties of major constituents found in skin tissue. The effects of absorber and scatterer variations with emitted intensity were demonstrated independently and simultaneously. This could open up possibilities in a semi empirical based procedure for optical characterization of biological tissues, specific to skin. In the present work, the absorbing and scattering agents considered are hemoglobin / melanin and epithelial cells / collagen fibers. A more comprehensive model needs to be developed for the skin that is involving additional constituents such as in keratin / bilirubin /other tissue fluorophores such as NADH and additionally the fluorescence from collagen. The current model mimics the layer thickness and the desired range of absorber and scatterer properties, which needs to be extended incorporating the maximum possible structural complexities that are present in real tissues. Although the current study focuses on assessment of fluorescence, such tissue phantoms offer great potential for usage in other modalities of spectroscopies as well. As layer specific controlled optical properties could be incorporated in such phantoms, these phantoms will additionally offer advantages in developing spectroscopic measurements sensitive to different layers. Development of such optical phantoms will be a real breakthrough in biomedical optical spectroscopy, for the non-invasive characterization of different variety of tissues.
Acknowledgments
The authors acknowledge Sophisticated Analytical Instrument Facility (SAIF) and Nano Functional Materials Technology Centre (NFMT) at IIT Madras for providing facilities for the absorbance based spectral measurements and sample thickness measurements using Scanning Electron Microscope. The authors would like to acknowledge Mr. Vijayaraghavan, Biophotonics lab, IIT Madras for helping with the preparation of the phantom samples.
Funding
Department of Science and Technology, India.
References and links
- 1.Ebihara A., Krasieva T. B., Liaw L. H. L., Fago S., Messadi D., Osann K., Wilder-Smith P., “Detection and diagnosis of oral cancer by light-induced fluorescence,” Lasers Surg. Med. 32(1), 17–24 (2003). 10.1002/lsm.10137 [DOI] [PubMed] [Google Scholar]
- 2.McGee S., Mardirossian V., Elackattu A., Mirkovic J., Pistey R., Gallagher G., Kabani S., Yu C. C., Wang Z., Badizadegan K., Grillone G., Feld M. S., “Anatomy-based algorithms for detecting oral cancer using reflectance and fluorescence spectroscopy,” Ann. Otol. Rhinol. Laryngol. 118(11), 817–826 (2009). [PMC free article] [PubMed] [Google Scholar]
- 3.Papazoglou T. G., “Malignancies and atherosclerotic plaque diagnosis--is laser induced fluorescence spectroscopy the ultimate solution?” J. Photochem. Photobiol. B 28(1), 3–11 (1995). 10.1016/1011-1344(95)07126-M [DOI] [PubMed] [Google Scholar]
- 4.Shahzad A., Edetsberger M., Koehler G., “Fluorescence spectroscopy: An emerging excellent diagnostic tool in medical sciences,” Appl. Spectrosc. Rev. 45(1), 1–11 (2010). 10.1080/05704920903435375 [DOI] [Google Scholar]
- 5.Alfano R. R., Tang G., Pradhan A., Lam W., Choy D., Opher E., “Fluorescence spectra from cancerous and normal human breast and lung tissues,” IEEE J. Quantum Electron. 23(10), 1806–1811 (1987). 10.1109/JQE.1987.1073234 [DOI] [Google Scholar]
- 6.Kolli V. R., Shaha A. R., Savage H. E., Sacks P. G., Casale M. A., Schantz S. P., “Native cellular fluorescence can identify changes in epithelial thickness in-vivo in the upper aerodigestive tract,” Am. J. Surg. 170(5), 495–498 (1995). 10.1016/S0002-9610(99)80338-9 [DOI] [PubMed] [Google Scholar]
- 7.Ramanujam N., Mitchell M. F., Mahadevan A., Thomsen S., Silva E., Richards-Kortum R., “Fluorescence spectroscopy: a diagnostic tool for cervical intraepithelial neoplasia (CIN),” Gynecol. Oncol. 52(1), 31–38 (1994). 10.1006/gyno.1994.1007 [DOI] [PubMed] [Google Scholar]
- 8.Römer T. J., Fitzmaurice M., Cothren R. M., Richards-Kortum R., Petras R., Sivak M. V., Jr, Kramer J. R., Jr., “Laser-induced fluorescence microscopy of normal colon and dysplasia in colonic adenomas: implications for spectroscopic diagnosis,” Am. J. Gastroenterol. 90(1), 81–87 (1995). [PubMed] [Google Scholar]
- 9.Meglinski I. V., Matcher S. J., “Quantitative assessment of skin layers absorption and skin reflectance spectra simulation in the visible and near-infrared spectral regions,” Physiol. Meas. 23(4), 741–753 (2002). 10.1088/0967-3334/23/4/312 [DOI] [PubMed] [Google Scholar]
- 10.Thueler P., Charvet I., Bevilacqua F., St Ghislain M., Ory G., Marquet P., Meda P., Vermeulen B., Depeursinge C., “In vivo endoscopic tissue diagnostics based on spectroscopic absorption, scattering, and phase function properties,” J. Biomed. Opt. 8(3), 495–503 (2003). 10.1117/1.1578494 [DOI] [PubMed] [Google Scholar]
- 11.Wu J., Feld M. S., Rava R. P., “Analytical model for extracting intrinsic fluorescence in turbid media,” Appl. Opt. 32(19), 3585–3595 (1993). 10.1364/AO.32.003585 [DOI] [PubMed] [Google Scholar]
- 12.Beck G. C., Akgun N., Rück A., Steiner R., “Design and characterization of a tissue phantom system for optical diagnostics,” Lasers Med. Sci. 13(3), 160–171 (1998). 10.1007/s101030050070 [DOI] [Google Scholar]
- 13.Wolf M., Keel M., Dietz V., von Siebenthal K., Bucher H. U., Baenziger O., “The influence of a clear layer on near-infrared spectrophotometry measurements using a liquid neonatal head phantom,” Phys. Med. Biol. 44(7), 1743–1753 (1999). 10.1088/0031-9155/44/7/313 [DOI] [PubMed] [Google Scholar]
- 14.Hielscher A. H., Liu H., Chance B., Tittel F. K., Jacques S. L., “Time-resolved photon emission from layered turbid media,” Appl. Opt. 35(4), 719–728 (1996). 10.1364/AO.35.000719 [DOI] [PubMed] [Google Scholar]
- 15.Kienle A., Glanzmann T., Wagnières G., Bergh H., “Investigation of two-layered turbid media with time-resolved reflectance,” Appl. Opt. 37(28), 6852–6862 (1998). 10.1364/AO.37.006852 [DOI] [PubMed] [Google Scholar]
- 16.Park J., Ha M., Yu S., Jung B., “Fabrication of various optical tissue phantoms by the spin-coating method,” J. Biomed. Opt. 21(6), 065008 (2016). 10.1117/1.JBO.21.6.065008 [DOI] [PubMed] [Google Scholar]
- 17.Leh B., Siebert R., Hamzeh H., Menard L., Duval M. A., Charon Y., Abi Haidar D., “Optical phantoms with variable properties and geometries for diffuse and fluorescence optical spectroscopy,” J. Biomed. Opt. 17(10), 108001 (2012). 10.1117/1.JBO.17.10.108001 [DOI] [PubMed] [Google Scholar]
- 18.Anastasopoulou M., Koch M., Gorpas D., Karlas A., Klemm U., Garcia-Allende P. B., Ntziachristos V., “Comprehensive phantom for interventional fluorescence molecular imaging,” J. Biomed. Opt. 21(9), 091309 (2016). 10.1117/1.JBO.21.9.091309 [DOI] [PubMed] [Google Scholar]
- 19.Saager R. B., Kondru C., Au K., Sry K., Ayers F., Durkin A. J., “Multilayer silicone phantoms for the evaluation of quantitative optical techniques in skin imaging,” Proc. SPIE 7567, 756706 (2010). 10.1117/12.842249 [DOI] [Google Scholar]
- 20.Wu Y., Qu J. Y., “Autofluorescence spectroscopy of epithelial tissues,” J. Biomed. Opt. 11(5), 054023 (2006). 10.1117/1.2362741 [DOI] [PubMed] [Google Scholar]
- 21.Wu Y., Xi P., Qu J., Cheung T. H., Yu M. Y., “Depth-resolved fluorescence spectroscopy of normal and dysplastic cervical tissue,” Opt. Express 13(2), 382–388 (2005). 10.1364/OPEX.13.000382 [DOI] [PubMed] [Google Scholar]
- 22.Marcu L., French P. M., Elson D. S., Fluorescence Lifetime Spectroscopy and Imaging: Principles and Applications in Biomedical Diagnostics. (CRC Press, 2014). [Google Scholar]
- 23.Ghukasyan V. V., Heikal A. A., Natural Biomarkers for Cellular Metabolism: Biology, Techniques, and Applications (CRC Press, 2014). [Google Scholar]
- 24.Helm T. N., “Dermatologic Manifestations of Metastatic Carcinomas,” http://emedicine.medscape.com/article/1101058-overview#a10
- 25.Chang S. K., Marin N., Follen M., Richards-Kortum R., “Model-based analysis of clinical fluorescence spectroscopy for in vivo detection of cervical intraepithelial dysplasia,” J. Biomed. Opt. 11(2), 024008 (2006). 10.1117/1.2187979 [DOI] [PubMed] [Google Scholar]
- 26.Pavlova I., Sokolov K., Drezek R., Malpica A., Follen M., Richards-Kortum R., “Microanatomical and biochemical origins of normal and precancerous cervical autofluorescence using laser-scanning fluorescence confocal microscopy,” Photochem. Photobiol. 77(5), 550–555 (2003). [DOI] [PubMed] [Google Scholar]
- 27.Rajaram N., Aramil T. J., Lee K., Reichenberg J. S., Nguyen T. H., Tunnell J. W., “Design and validation of a clinical instrument for spectral diagnosis of cutaneous malignancy,” Appl. Opt. 49(2), 142–152 (2010). 10.1364/AO.49.000142 [DOI] [PMC free article] [PubMed] [Google Scholar]
- 28.Liu Q., Grant G., Li J., Zhang Y., Hu F., Li S., Wilson C., Chen K., Bigner D., Vo-Dinh T., “Compact point-detection fluorescence spectroscopy system for quantifying intrinsic fluorescence redox ratio in brain cancer diagnostics,” J. Biomed. Opt. 16(3), 037004 (2011). 10.1117/1.3558840 [DOI] [PMC free article] [PubMed] [Google Scholar]
- 29.Liu Q., Chen K., Martin M., Wintenberg A., Lenarduzzi R., Panjehpour M., Overholt B. F., Vo-Dinh T., “Development of a synchronous fluorescence imaging system and data analysis methods,” Opt. Express 15(20), 12583–12594 (2007). 10.1364/OE.15.012583 [DOI] [PubMed] [Google Scholar]
- 30.Biswal N., Gupta S., Ghosh N., Pradhan A., “Recovery of turbidity free fluorescence from measured fluorescence: an experimental approach,” Opt. Express 11(24), 3320–3331 (2003). 10.1364/OE.11.003320 [DOI] [PubMed] [Google Scholar]
- 31.Raja V. S., Gupta S., Pradhan A., “Recovery of intrinsic fluorescence of tissue mimicking model media and human breast tissues from spatially resolved fluorescence and simultaneous evaluation of optical transport parameters,” Proc. SPIE 6091, 609104 (2006). 10.1117/12.645918 [DOI] [PubMed] [Google Scholar]
- 32.Anand B. S. S., Sujatha N., “Fluorescence quenching effects of hemoglobin on simulated tissue phantoms in the UV–Vis range,” Meas. Sci. Technol. 23(2), 025502 (2012). 10.1088/0957-0233/23/2/025502 [DOI] [Google Scholar]
- 33.Vishwanath K., Zhong W., Close M., Mycek M. A., “Fluorescence quenching by polystyrene microspheres in UV-visible and NIR tissue-simulating phantoms,” Opt. Express 14(17), 7776–7788 (2006). 10.1364/OE.14.007776 [DOI] [PubMed] [Google Scholar]
- 34.Beck G. C., Akguen N., Rueck A. C., Steiner R. W., “Developing optimized tissue phantom systems for optical biopsies,” Proc. SPIE 3197, 76–85 (1997). 10.1117/12.297954 [DOI] [Google Scholar]
- 35.Gardner C. M., Jacques S. L., Welch A. J., “Fluorescence spectroscopy of tissue: recovery of intrinsic fluorescence from measured fluorescence,” Appl. Opt. 35(10), 1780–1792 (1996). 10.1364/AO.35.001780 [DOI] [PubMed] [Google Scholar]
- 36.Zhadin N. N., Alfano R. R., “Correction of the internal absorption effect in fluorescence emission and excitation spectra from absorbing and highly scattering media: theory and experiment,” J. Biomed. Opt. 3(2), 171–186 (1998). 10.1117/1.429874 [DOI] [PubMed] [Google Scholar]
- 37.Makropoulou M. I., Drakaki H., Stamatakos G., Serafetinides A. A., “Quantitative estimation of absorbing chromophores in tissue simulators based on laser-induced spectroscopy and scattering measurements,” Proc. SPIE 4162, 76–85 (2000). 10.1117/12.405926 [DOI] [Google Scholar]
- 38.Ha R. Y., Nojima K., Adams W. P., Jr, Brown S. A., “Analysis of facial skin thickness: defining the relative thickness index,” Plast. Reconstr. Surg. 115(6), 1769–1773 (2005). 10.1097/01.PRS.0000161682.63535.9B [DOI] [PubMed] [Google Scholar]
- 39.Arifler D., Pavlova I., Gillenwater A., Richards-Kortum R., “Light scattering from collagen fiber networks: micro-optical properties of normal and neoplastic stroma,” Biophys. J. 92(9), 3260–3274 (2007). 10.1529/biophysj.106.089839 [DOI] [PMC free article] [PubMed] [Google Scholar]
- 40.Cheong W. F., Prahl S. A., Welch A. J., “A review of the optical properties of biological tissues,” IEEE J. Quantum Electron. 26(12), 2166–2185 (1990). 10.1109/3.64354 [DOI] [Google Scholar]
- 41.Cui W. J., Ostrander L. E., Lee B. Y., “In vivo reflectance of blood and tissue as a function of light wavelength,” IEEE Trans. Biomed. Eng. 37(6), 632–639 (1990). 10.1109/10.55667 [DOI] [PubMed] [Google Scholar]
- 42.Dai T., Pikkula B. M., Wang L. V., Anvari B., “Comparison of human skin opto-thermal response to near-infrared and visible laser irradiations: a theoretical investigation,” Phys. Med. Biol. 49(21), 4861–4877 (2004). 10.1088/0031-9155/49/21/002 [DOI] [PubMed] [Google Scholar]
- 43.Mirkovic J., Lau C., McGee S., Crum C., Badizadegan K., Feld M., Stier E., “Detecting high-grade squamous intraepithelial lesions in the cervix with quantitative spectroscopy and per-patient normalization,” Biomed. Opt. Express 2(10), 2917–2925 (2011). 10.1364/BOE.2.002917 [DOI] [PMC free article] [PubMed] [Google Scholar]
- 44.Prahl S. A., “Tabulated molar extinction coefficient for hemoglobin in water,“ http://omlc.ogi.edu/spectra/hemoglobin/summary.html (1999).
- 45.Schomacker K. T., Frisoli J. K., Compton C. C., Flotte T. J., Richter J. M., Nishioka N. S., Deutsch T. F., “Ultraviolet laser-induced fluorescence of colonic tissue: basic biology and diagnostic potential,” Lasers Surg. Med. 12(1), 63–78 (1992). 10.1002/lsm.1900120111 [DOI] [PubMed] [Google Scholar]
- 46.Tseng S.-H., Bargo P., Durkin A., Kollias N., “Chromophore concentrations, absorption and scattering properties of human skin in-vivo,” Opt. Express 17(17), 14599–14617 (2009). 10.1364/OE.17.014599 [DOI] [PMC free article] [PubMed] [Google Scholar]
- 47.van Leeuwen-van Zaane F., Gamm U. A., van Driel P. B. A. A., Snoeks T. J. A., de Bruijn H. S., van der Ploeg-van den Heuvel A., Mol I. M., Löwik C. W. G. M., Sterenborg H. J. C. M., Amelink A., Robinson D. J., “In vivo quantification of the scattering properties of tissue using multi-diameter single fiber reflectance spectroscopy,” Biomed. Opt. Express 4(5), 696–708 (2013). 10.1364/BOE.4.000696 [DOI] [PMC free article] [PubMed] [Google Scholar]
- 48.Yudovsky D., Pilon L., “Rapid and accurate estimation of blood saturation, melanin content, and epidermis thickness from spectral diffuse reflectance,” Appl. Opt. 49(10), 1707–1719 (2010). 10.1364/AO.49.001707 [DOI] [PubMed] [Google Scholar]
- 49.Maetzler C., “MATLAB functions for Mie scattering and absorption,” Research Report no: 2002–08, University of Bern, (2002). [Google Scholar]
- 50.Palero J. A., de Bruijn H. S., van der Ploeg van den Heuvel A., Sterenborg H. J., Gerritsen H. C., “Spectrally Resolved Multiphoton Imaging of In vivo And Excised Mouse Skin Tissues,” Biophys. J. 93(3), 992–1007 (2007). 10.1529/biophysj.106.099457 [DOI] [PMC free article] [PubMed] [Google Scholar]
- 51.Cohen S., Biophotonics in Pathology: Pathology at the Crossroads, Vol. 185 (IOS Press, 2013). [Google Scholar]


