

Abstract
Coupling structure-specific in vivo chemical modification to next-generation sequencing is transforming RNA secondary structural studies in living cells. The dominant strategy for detecting in vivo chemical modifications uses reverse transcriptase truncation products, which introduces biases and necessitates population-average assessments of RNA structure. Here we present dimethyl sulfate mutational profiling with sequencing (DMS-MaPseq), which encodes DMS modifications as mismatches using a thermostable group II intron reverse transcriptase (TGIRT). DMS-MaPseq yields a high signal-to-noise ratio, can report multiple structural features per molecule, and allows both genome-wide studies and focused in vivo investigations of even low abundance RNAs. We apply DMS-MaPseq for the first analysis of RNA structure within an animal tissue and to identify a functional structure involved in non-canonical translation initiation. Additionally, we use DMS-MaPseq to compare the in vivo structure of pre-mRNAs to their mature isoforms. These applications illustrate DMS-MaPseq’s capacity to dramatically expand in vivo analysis of RNA structure.
INTRODUCTION
RNA is a functionally diverse molecule that both carries genetic information and directly conducts biological processes through its ability to fold into complex secondary and tertiary structures1. The discovery of functional RNA structures depends critically on accurate, targeted, and accessible RNA structure determination methods, particularly in vivo. Sequence information alone is generally not sufficient to predict RNA structure, but in combination with experimental structure data with single nucleotide resolution, an accurate assessment of RNA folding status can often be obtained and novel RNA structures discovered2–4.
Existing high-resolution techniques to measure RNA secondary structure are based on structure-specific chemical modification. Dimethyl sulfate (DMS) has emerged as one of the preeminent choices for this application. DMS rapidly and specifically modifies unpaired adenines and cytosines in vivo at their Watson-Crick base-pairing positions5. Selective 2′-hydroxyl acylation analyzed by primer extension (SHAPE) chemicals are another powerful option for chemical RNA structure probing. Due to their distinct mechanisms of modification, DMS and SHAPE report on different and complementary aspects of RNA structure6,7. In early efforts, chemical lesions from either SHAPE or DMS were detected when the reverse transcriptase (RT) enzyme terminates cDNA synthesis upon reaching a modified nucleotide. We and others have coupled the chemical probing of RNA structure to next-generation sequencing (Fig. 1a), allowing for experimental analysis of RNA structure on a global scale in vitro or in vivo4,8–11. (See references 12–13 for reviews of sequencing-coupled RNA structure techniques). Globally, these experiments have revealed substantial differences in RNA structure in vivo versus in vitro, underscoring the importance of examining RNA structure in its native cellular environment4,10.
Figure 1. Sequencing library generation for RNA structure probing techniques.
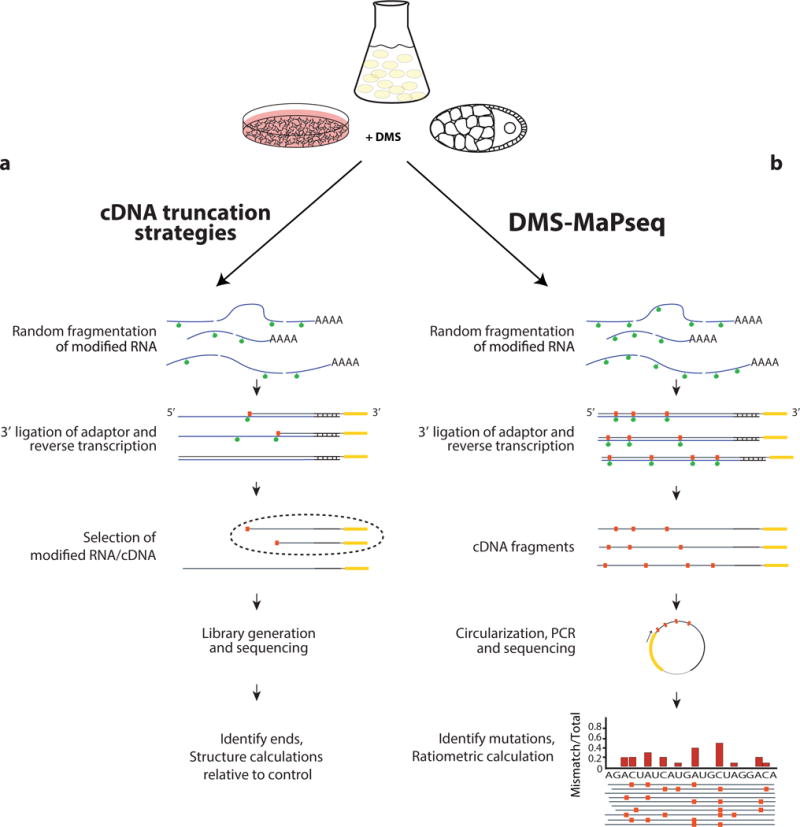
Schematic of library preparation strategies for cDNA truncation approaches (a) and for DMS-MaPseq (b).
Despite important contributions to RNA structure discovery, truncation-based approaches using either DMS or SHAPE have intrinsic limitations that render them unsuitable to address certain biological questions, such as the heterogeneity of RNA structures in vivo. We sought to develop an in vivo and genome-wide approach that would overcome existing limitations in truncation strategies by encoding DMS lesions as mutations instead of cDNA truncations, as has been recently described for individual or highly abundant RNA targets7,14–16. Such mutational profiling (MaP) approaches confer several advantages. These include the resolution of enzymatic biases proximal to the information-encoding nucleotide and most importantly, the analysis of multiple chemical modification sites per molecule, which opens up the possibility of distinguishing heterogeneous RNA structure subpopulations in vivo. In truncation approaches, only a single site of chemical modification can be observed per RNA molecule, meaning the structure signal corresponds to a population average. Additionally, low abundance RNAs are not conducive to truncation-based RNA structure probing. Specifically, they are poorly sequenced on a genome-wide scale, and input requirements for available low-throughput methods often necessitate in vitro transcription prior to structure profiling6,14,15,17. We reasoned that an in vivo MaP approach would make it possible to perform targeted amplification of low abundance RNA species while retaining a record of the modification sites.
Here we describe DMS-MaPseq, an RNA structure probing strategy that takes advantage of a high fidelity and processive thermostable group II reverse transcriptase (TGIRT) enzyme. We apply this technique globally in vivo and for selected RNA species, including low abundance RNA targets in yeast and human cells, producing the high signal and low background necessary for high data quality. We also highlight a simple RT-PCR approach for targeted amplification and demonstrate RNA experiments inaccessible by previous techniques such as the investigation of isoform-specific RNA structure and the discovery of a functional structure in the low abundance human FXR2 mRNA. DMS-MaPseq enables a far broader exploration of in vivo RNA structure and offers an accessible technical solution to address structure-function hypotheses for virtually any RNA, regardless of abundance.
RESULTS
Development of genome-wide in vivo RNA structure probing with mutational profiling
For DMS-MaPseq, we treat cells with a high concentration of DMS to increase the number of modifications detected per fragment, modifying approximately 1 in 50 nucleotides. We compared data produced at this DMS concentration (5% v/v) to previously validated concentrations4, and we observe excellent correlation of the RNA structure signal both globally and for each nucleotide in the yeast 18S rRNA (Supplementary Fig. 1; r = 0.94 and r = 0.98, respectively). For applications that aim to use even higher DMS levels, it will be important to do a similar analysis to evaluate whether RNA structures are perturbed with increasing DMS concentrations. After DMS treatment and total RNA extraction, random fragmentation with Zn2+, and the removal of ribosomal RNA, we do a broad size selection, ligate a 3′ adapter, and reverse transcribe under conditions in which chemically modified bases are encoded as a mutation in the cDNA (Fig. 1b). Consequently, multiple modifications can be observed on a single cDNA fragment, providing an essential framework for future applications of single-molecule RNA structure determination.
The accuracy of DMS-MaPseq depends critically on reverse transcription conditions that optimize the detection of DMS modifications while retaining high fidelity and processivity during cDNA synthesis. The TGIRT enzyme was recently adapted with these latter priorities in mind and notably produces mismatches at endogenous m1A and m3C tRNA residues—the exact methylation profiles of a DMS-modification18,19. Additionally, Superscript II with Mn2+ buffer (SSII/Mn2+) had been used previously for the mutational read-through of DMS and SHAPE modification for abundant individual RNA species14–16. To compare the suitability of these two enzymes for our in vivo DMS-MaPseq approach, we prepared genome-wide yeast libraries with each. Encoding DMS modifications as mismatches inherently retains the single-nucleotide resolution of DMS while insertions or deletions (indels) suffer from positional ambiguity when aligned across a homopolymeric stretch. TGIRT does not produce a high number of indels (6%, Fig. 2a). However, we find that nearly a third of DMS-induced mutations from SSII/Mn2+ reverse transcription are insertions or deletions. Next, we used two endogenous m1A modifications on the yeast 25S rRNA as internal controls for DMS lesion detection. The frequency of mismatches at these residues across TGIRT replicate experiments revealed m1A detection at 85% and 48% average frequency, placing a lower bound on the fraction of these endogenous modifications. SSII/Mn2+ yielded a mutation rate of only 53% and 1.4% (Fig. 2b). This tendency of SSII/Mn2+ to underreport the DMS modification signal in a context-dependent manner could severely undermine data quality.
Figure 2. TGIRT enzyme delivers higher signal and lower background for DMS-MaPseq.
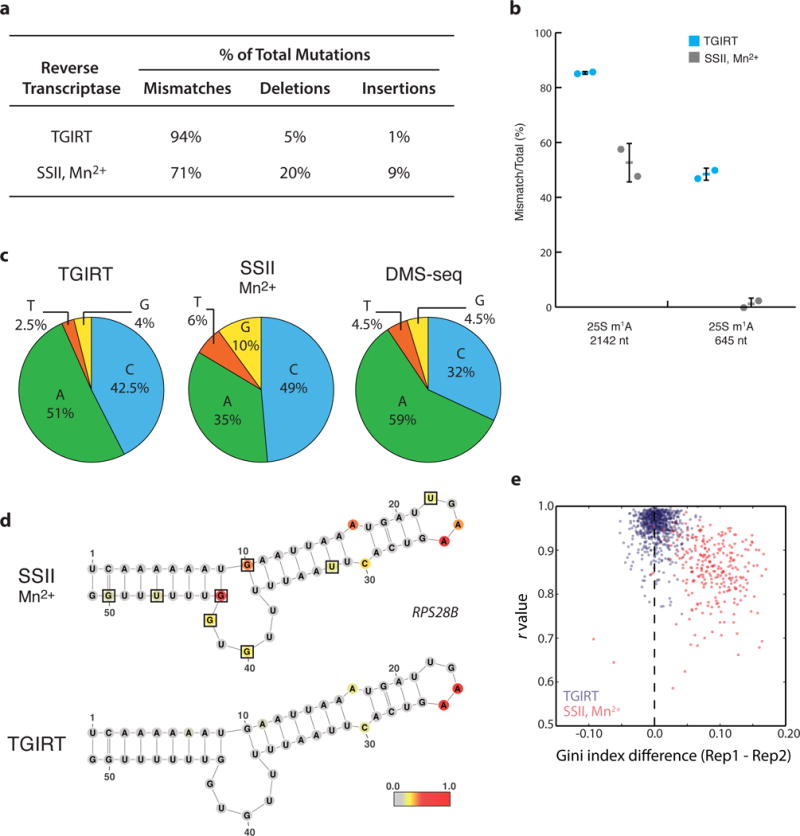
a, Distribution of mutation type generated by SSII/Mn2+ or TGIRT reverse transcription from in vivo DMS-treated yeast mRNA. b, Endogenous m1A modifications in yeast 25S rRNA transcript reveal superior modification detection with TGIRT. Average percent modification (bar) detected at the position across two biological DMS-treated replicates (circles) with error bars representing standard deviation from the average. c, Nucleotide composition of mismatches from TGIRT or SSII/Mn2+ approaches. d, Yeast RPS28B mRNA positive control structure with nucleotides colored by DMS reactivity in vivo. Black boxes outline G/U bases with high background signal. DMS reactivity was calculated as the average ratiometric DMS signal per position across two biological replicates normalized to the highest number of reads in displayed region, which is set to 1.0. e, Genome-wide DMS-MaPseq replicates compared by Pearson’s r value and Gini index for yeast mRNA regions (requiring 15x coverage, resulting in 733 and 272 regions displayed for TGIRT and SSII/Mn2+, respectively).
A valuable measure for the signal-to-noise ratio in DMS data is the enrichment of signal on adenines and cytosines4 (Supplementary Fig. 2a). When the same source of DMS-modified RNA is reverse transcribed using either TGIRT or SSII/Mn2+, we observed a far greater fraction of mismatches on A/Cs using TGIRT (93.5% versus 84%) (Fig. 2c). This high A/C signal in TGIRT data also exceeds that of our previously published DMS-seq strategy based on cDNA truncation, and there are notable differences in the relative contributions of A/Cs4. Analysis of the mismatch nucleotide bias in DMS-seq reveals that 54% of mismatches occur on cytosines in a DMS-dependent manner, suggesting that truncation at cytosines is not robust14 (Supplementary Fig. 2b,c). Notably, the signal on adenines is lower with SSII/Mn2+ than the other techniques, which suggests an underlying failure to robustly encode m1A modifications consistent with the low signal detection on the endogenous rRNA residues.
Both TGIRT and SSII/Mn2+ produce excellent signal at unpaired A/C residues in the yeast RPS28B positive control structure, but the SSII/Mn2+ data reveal high background signal on certain G/U residues, suggesting a propensity for non-random errors in cDNA synthesis. This higher background error for SSII/Mn2+ is also reflected in the genomewide frequency of mutations and indels on matched untreated and DMS-treated RNA (Supplementary Fig. 2d), which is consistent with the historical use of Mn2+ buffer in deliberate mutagenesis during oligonucleotide synthesis20. Other RNA structure methods have subtracted background signal on a nucleotide-by-nucleotide basis15, however, we see an increase in noise after applying a background correction to the RPS28B positive control structure21 (Fig. 2d, Supplementary Fig. 3a–d). Global investigation reveals a poor correlation of background signal for both TGIRT and SSII/Mn2+ untreated replicates, suggesting it is variable and stochastic (Supplementary Fig. 3e,f). Thus, a key advantage of DMS-MaPseq is the ratiometric nature of the data (i.e., in a population-level analysis, the rate of modification at each position is equal to the ratio of mutated reads to total reads) (Fig. 1b). Untreated or denatured DMS-MaPseq controls may still be useful in the discovery of endogenous mRNA modifications encoded during reverse transcription19, uncharacterized single nucleotide polymorphisms, or as a negative control, but it is not a necessary component for single nucleotide RNA structure calculations.
We used replicates to assess the reproducibility of the RNA structure signal across yeast transcriptome regions as measured by r value and the Gini index difference, an established RNA structure metric to assess the evenness of the data distribution4 (Fig. 2e). This analysis reveals a stronger reproducibility between data generated by TGIRT than by SSII/Mn2+, consistent with our observations of high background noise in the latter approach. Due to the high DMS signal and low background error observed across many quality control metrics, we chose the TGIRT enzyme for all further DMS-MaPseq experimentation and method development.
Global analysis of DMS-MaPseq data
When DMS lesions are detected by truncation, only the most 3′ DMS modification on an RNA fragment will be detected. For this reason, DMS treatment conditions must be carefully titrated to avoid improper hit kinetics and 5′ signal decay22. This effect is illustrated by the lack of DMS-seq signal immediately 5′ of an endogenous m1A residue in denatured yeast 25S rRNA (Fig. 3a). This drop off does not occur with DMS-MaPseq data, confirming the TGIRT enzyme can encode multiple DMS lesions in a short sequence space. Additionally, negative control bases in the yeast rRNA fall overwhelmingly into the lowest bin of reactivity in DMS-MaPseq data, confirming low background noise relative to previous DMS-seq data4 (Fig. 3b).
Figure 3. Global analysis of in vivo DMS-MaPseq data.
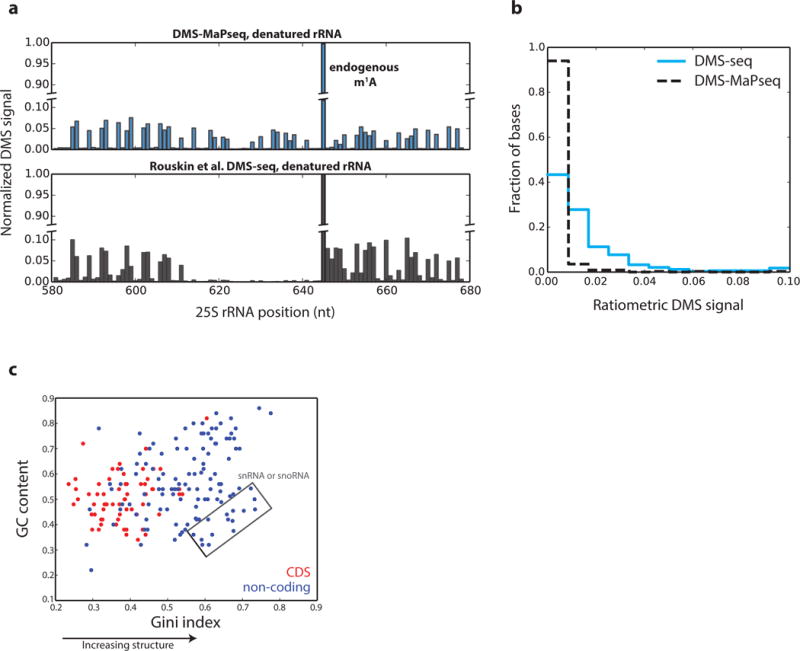
a, Signal decay observed after endogenous m1A modification at position 642 in the yeast 25S rRNA in DMS-seq, but not in DMS-MaPseq. b, Histogram of ratiometric reactivity for negative control bases in the yeast 18S rRNA. The total number of negative control bases is 338, characterized as bases known to be base-paired. c, Scatterplot of GC content versus Gini Index in 50nt windows of deeply sequenced genes. Non-coding RNA regions include UTRs and all classes of mammalian non-coding RNAs. The total number of evaluated windows is 182. Pearson’s correlation = 0.32, p-value = 7.3e-6.
We also collected a genome-wide in vivo DMS-MaPseq dataset from human embryonic kidney (HEK) 293T cells, and we confirm the agreement of our data with the XBP1 positive control structure23 (Supplementary Fig. 4). Often, GC content is invoked as an indicator for RNA structure, so we investigated this relationship across human transcriptome regions, plotting GC content against the Gini index from DMS-MaPseq (Fig. 3c). A small correlation (r = 0.32) exists, but overall, coding regions have lower GC content and their RNA appears less structured, as we demonstrated previously4. However, the lack of structure is more pronounced than expected by GC content alone, and non-coding RNA regions are more structured than CDS regions of comparable GC content. Interestingly, the biggest outliers are snoRNAs and snRNAs, which have a low GC content but are highly structured.
DMS-MaPseq for specific or low abundance RNA targets
Low abundance mRNAs do not receive sufficient sequencing coverage in genome-wide experiments to make robust conclusions about their structure. Plotting the cumulative r value distribution for mRNA regions between in vivo DMS-MaPseq replicates in yeast reveals that an average mismatch coverage depth of greater than 20× greatly improves data reproducibility (Fig. 4a). However, for genome-wide HEK 293T DMS-MaPseq data only a limited fraction of genes pass this 20x coverage threshold (Fig. 4b). Even when extrapolated to an exorbitant sequencing depth of 1 billion uniquely mapped reads, many human genes (78%) have insufficient coverage. To probe the in vivo structure of low abundance mRNAs, we developed and validated a simple targeted RT-PCR implementation of DMS-MaPseq (Fig. 4c). Targeted DMS-MaPseq begins with the in vivo modification of RNA, followed by total RNA extraction, DNase treatment, and rRNA depletion. Then, we reverse transcribe using the TGIRT enzyme and target-specific primers, which can be used in combination to amplify multiple RNA species in a single reaction. Directly after cDNA synthesis, target-specific PCR primers amplify the RNA region of interest, followed by NexteraXT tagmentation and sequencing.
Figure 4. DMS-MaPseq enables in vivo RNA structure probing for specific RNA targets.
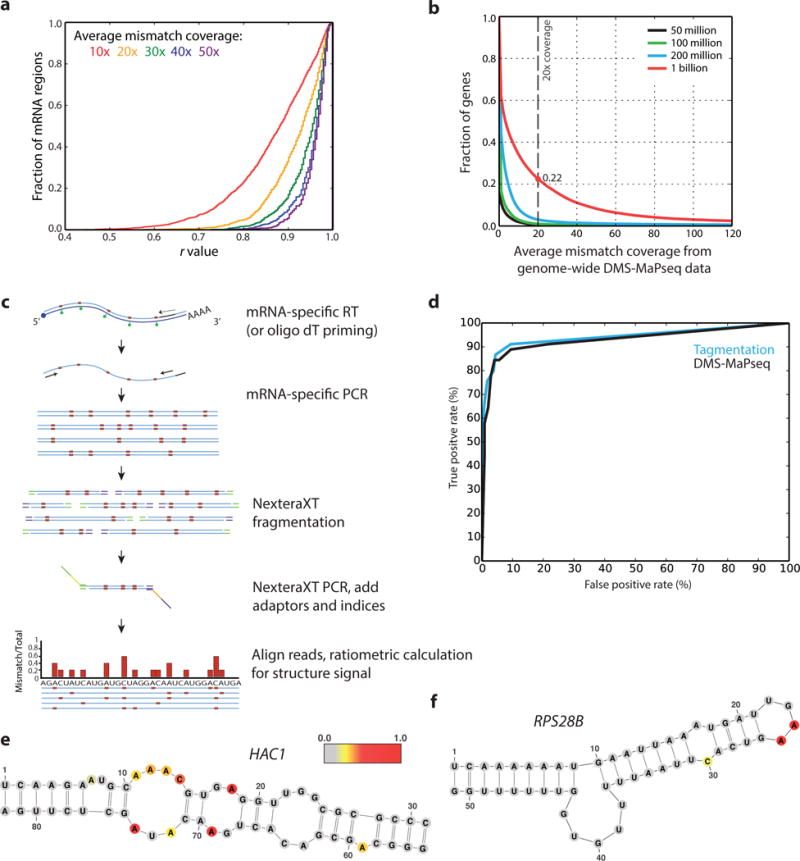
a, Cumulative histogram of Pearson’s r values between yeast mRNA regions in DMS-MaPseq replicates at varied depths of average mismatch coverage. b, Fraction of genes exceeding the minimum average mismatch coverage of 20x in genome-wide human HEK 293T DMS-MaPseq data with varied sequencing depths. 0.006, 0.009, and 0.03 are the fraction of genes passing this threshold at 50, 100, and 200 million uniquely mapped reads, respectively. c, Schematic for targeted RNA structure probing via target-specific RT-PCR and NexteraXT tagmentation. d, ROC curve for DMS signal on yeast 18S rRNA using ratiometric data from target-specific tagmentation approach and from genome-wide DMS-MaPseq. e, f, Yeast HAC1 (e) and RPS28B (f) 3′ UTR mRNA positive control structures from target-specific priming with nucleotides colored by DMS reactivity in vivo. DMS reactivity calculated as the ratiometric DMS signal per position normalized to the highest number of reads in displayed region, which is set to 1.0.
To assess data quality from this targeted approach, we examined the structure signal for known RNA structures. We plotted an ROC curve to assess the concordance of 18S rRNA DMS-MaPseq data with the published yeast crystal structure model24 and observed an excellent agreement with data from both our genome-wide or targeted approach (Fig. 4d, Supplementary Fig. 5a). We also assessed whether the targeted DMS-MaPseq data supported positive control mRNA structure models and observe excellent agreement with the yeast HAC1 and RPS28B structures21,25 (Fig. 4e,f), as well as the human XBP1 and MSRB1 structures23,26 (Supplementary Fig. 5b–e). Finally, we observe no signal drop-off in our amplified regions until the primer binding region and a very low level of background signal (Supplementary Fig. 6).
To reduce PCR amplification biases for quantitative applications or low input material, we also developed a variation of targeted DMS-MaPseq that tags each RNA molecule with a unique molecular index (UMI) on the RT primer (Supplementary Fig. 7a and Table S1). Unique reads can then be isolated easily based on their specific UMI and DMS mutation profiles. The SFT2 and ASH1 yeast mRNAs are lowly expressed and host functional RNA structures in their 5′ and 3′ UTRs, respectively, serving as positive controls for DMS signal detection utilizing a UMI. Indeed, both controls show DMS modification profiles consistent with the known secondary structure models4,27 (Supplementary Fig. 7b,c). Interestingly, these data are in excellent agreement when processed irrespective of uniqueness, suggesting a UMI may not be necessary for amplification of transcripts of comparable abundance. Given the limitations regarding the size of RNA region assayed with this UMI approach and the expense of longer sequencing reads, choosing between the targeted versions of DMS-MaPseq depends on the region size, target abundance, and quantitative demands of an experiment.
DMS-MaPseq for D. melanogaster ovaries
Drosophila melanogaster oocytes provide a premier system for studying mRNA localization and translational control due to dramatic developmental changes independent of transcription and mRNA degradation. Many mRNAs are localized during oogenesis28, and while these localization mechanisms are poorly understood globally, RNA structure has been shown to be involved29–31. Here, we apply targeted DMS-MaPseq to D. melanogaster ovaries, which yields excellent structure data at two DMS treatment levels consistent with the oskar and gurken mRNA structures responsible for localization31,32 (Fig. 5a,b; Supplementary Fig. 8). This is the first example of RNA structure probing in an animal tissue and marks a key step forward in investigating the role of RNA structure in mRNA localization in this model system.
Figure 5. Novel experimental applications for in vivo RNA structure probing.
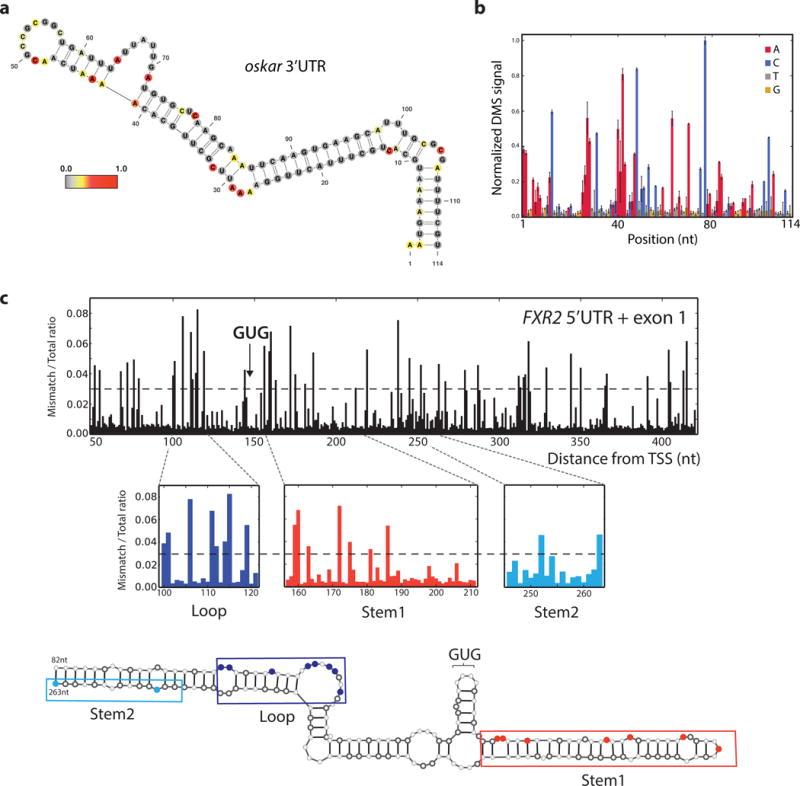
a, oskar 3′ UTR mRNA positive control structure from target-specific priming with nucleotides colored by in vivo DMS reactivity in D. melanogaster ovaries. DMS reactivity calculated as the ratiometric DMS signal per position normalized to the highest number of reads in displayed region, which is set to 1.0. b, oskar positive control region from (a) shown with average normalized DMS-MaPseq values from two biological replicates, one at 5 min DMS treatment and one at 10 min. Error bars represent one standard deviation. c, Ratiometric DMS-MaPseq from targeted amplification of the human FXR2 5′ UTR and exon1 sequence. Nucleotides accessible to DMS are noted with a value >0.03, which is the threshold representing the best agreement with our model. Position 1 corresponds to chromosome XVII:7614897.
A highly structured region influences non-canonical translation initiation
We recently discovered that translation of the mammalian FXR2 (Fragile X Mental Retardation, Autosomal Homolog 2) gene initiates predominantly at a GUG codon33. Due to the extreme GC content (80%) of the first exon of FXR2, we hypothesized a stable RNA structure may contribute to the non-canonical initiation. We used in vitro DMS-MaPseq data to develop a secondary structure model with RNAfold34. This revealed two highly stable putative structures flanking the GUG initiation codon (Fig. 5c, Supplementary Fig. 9; free energy < -31 kcal/mol), with some ambiguity across certain regions depending on the thresholds used to impose folding constraints (see alternative structure model, Supplementary Fig. 10a). We mutated these putative FXR2 structures to perturb the majority of base-pairing interactions in the both models and tested their effects within a reporter construct, revealing a drop in protein levels upon mutating either structure (Supplementary Fig. 10b–d and Table S2). Compensatory mutations, designed to optimize the restoration of our predicted RNA structures, restored eGFP levels and thus implicated the structure itself as a functional modulator of translation initiation for FXR2. In addition to the compensatory mutations, the in vivo structure signal supports this model (Supplementary Fig. 9c–e).
Structure probing of RNAs in multiple conformations
In the complex environment of the cell, the structure of an RNA molecule may vary based on its current state, such as maturation, translation, protein binding, and degradation. In the case of structural heterogeneity from a ribosnitch, i.e. a single nucleotide polymorphism that yields a local RNA structure rearrangement, the interpretation of in vitro RNA folding status differs greatly when DMS-MaPseq data from the two human MRPS21 ribosnitch alleles35 are analyzed together or separately. Allele-specific analysis of the data reveals two distinct and mutually exclusive structures, which are not detectable from the combined allele analysis (Fig. 6a). This example illustrates the complexity of analyzing structurally heterogeneous regions and a simple resolution using DMS-MaPseq to separate specific RNA subpopulations by allele.
Figure 6. Investigating RNA structure heterogeneity with DMS-MaPseq.
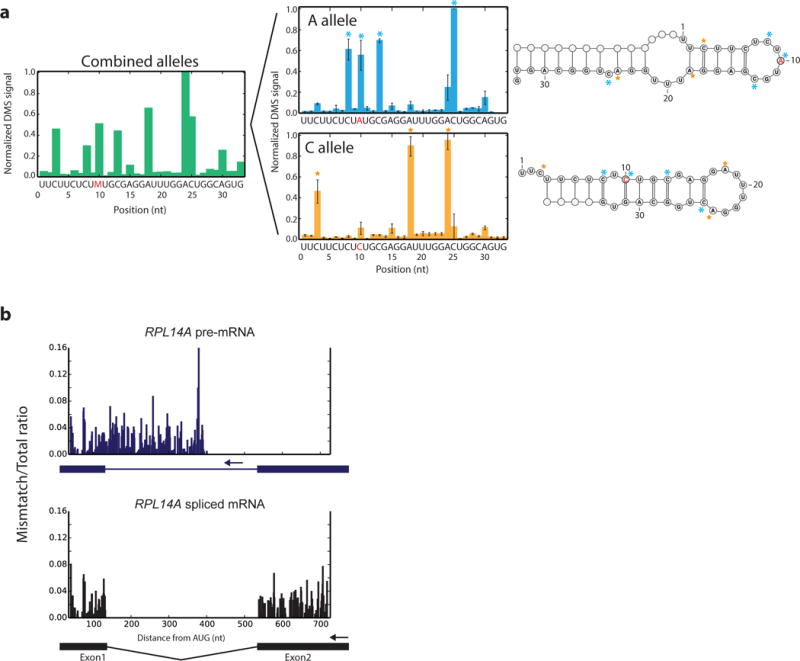
a, Regions of heterogeneous structure exhibit indistinguishable structure signals when combined but can be distinguished by DMS-MaPseq, illustrated by normalized DMS-MaPseq data derived from the human MRPS21 ribosnitch A/C alleles. Allele-specific data represented as the mean of three technical replicates. Error bars represent one standard deviation. b, Targeted DMS-MaPseq data specific for the yeast RPL14A pre-mRNA and spliced mRNA isoforms reveal minimal structure difference in the common exon1 sequence (r = 0.88). Ratiometric in vivo DMS-MaPseq data is plotted with isoform-specific RT primer locations noted with arrows.
Of particular interest regarding structural heterogeneity are isoform-specific RNA structures. Structure differences have been proposed between pre-mRNAs and their mature translated counterparts, such as RNA structures which influence splice site selection36 or affect translation37,38. We used intron- or exon-specific RT primers to separately amplify each isoform of two yeast ribosomal protein genes using targeted DMS-MaPseq. The RNA structure signal in the common exon1 sequence between the RPL14A and RPL31B pre-mRNAs and their respective mature counterpart reveals surprisingly little structure difference between isoforms (Fig. 6b, Supplementary Fig. 11, and Supplementary Fig. 12). These mRNAs are highly translated, but their exon1 structure is similar to the untranslated pre-mRNA, suggesting that local RNA structure rapidly refolds after translation. While we focus here on a limited number of messages, this approach broadly enables the analysis of different RNA isoforms.
DISCUSSION
Here we establish DMS-MaPseq as a robust and simple tool suitable for the quantitative analysis of RNA secondary structure in vivo by improving the inherent quality of the structure data, enabling qualitatively new types of structure to be gathered, and greatly expanding the repertoire of RNAs that can be analyzed. Future applications include in vivo single-molecule analyses of the co-occurrence of DMS modifications to identify heterogeneous RNA structure subpopulations (e.g., ribosnitches35) empirically. Additionally, DMS-MaPseq allows the selective amplification of RNA targets, including pre-mRNAs or differentially spliced isoforms. Together, these advances drastically expand the range of experimentally accessible RNA species for structural analysis, enabling a wide range of future studies. In theory, our in vivo MaP approach with TGIRT could also be used for SHAPE, which would be a valuable and complementary approach. However, the bulky nature of the best characterized and validated in vivo SHAPE chemical, NAI-N310, may prove challenging. Finally, DMS-MaPseq could be combined with the analysis of endogenous mRNA modifications, including the sequencing-based mapping of pseudouridines or m6A methylation39–42. These endogenous modifications occur on only a subset of their RNA targets. Combined with the single-molecule aspects of DMS-MaPseq, it would be possible to evaluate how such endogenous RNA modification impact structure within a single experiment. It is the versatility of DMS-MaPseq that makes it a transformative tool for in vivo RNA structure probing, allowing for more comprehensive investigations into the biological relevance of RNA structures than ever before.
Online Methods
Step-by-step protocols for target-specific and genome-wide DMS-MaPseq are available as Supplementary Protocols 1 and 2 (and online methods ref. 1 and 2).
Media and growth conditions
Yeast strain BY4741 was grown in YPD at 30°C. Saturated cultures were diluted to OD600 of ~0.09 and grown to a final OD600 of 0.5–0.7 at the time of DMS treatment. HEK 293T cells were grown in DMEM medium with high glucose, supplemented with glutamine, pyruvate, non-essential amino acids, and 10% FBS, and cells were treated with DMS at ~80% confluence.
Dimethyl sulfate (DMS) modification
For in vivo DMS modification in yeast, 15 ml of exponentially growing yeast were incubated with 750 μl DMS (Sigma) for 4 min at 30°C. DMS was quenched by adding a 30 ml stop solution comprised of 30% beta-mercaptoethanol (from a 14.2 M stock) and 50% isoamyl alcohol, after which cells were quickly put on ice, collected by centrifugation at 3,500 × g at 4°C for 4 min, and washed with 10 ml 30% BME solution. Cells were then resuspended in 0.6 ml total RNA lysis buffer (6 mM EDTA, 45 mM NaOAc pH 5.5), and total RNA was purified with hot acid phenol (Ambion) and EtOH precipitation. Ribosomal RNA was depleted using RiboZero (Epicentre), either directly after RNA extraction or post-ligation in the genome-wide library preparation. Denatured RNA structure samples were treated as in DMS-seq3. For HEK 293T cells, 15 cm4 plates with 15 ml of media were treated with the addition of 300 μl DMS and incubation at 37°C for 4–5 min. Media/DMS was decanted, and plates were washed twice in 30% BME (v/v). Cells were resuspended in Trizol, and RNA isolated according to manufacturer protocol. For D. melanogaster oocytes, we dissected ovaries from ~100 flies (OreR strain) in 250 μl 1X PBS. We added 250 μl DMS for 5 min at 26°C with shaking at 500 rpm. To stop the reaction, we added 1 ml of 30% BME (v/v) and transferred the oocytes to a sieve, where they were washed three times in 30% BME and two times with sterile water. Finally, the ovaries were collected and re-suspended in 1mL of Trizol and 10 μl BME, and total RNA was extracted.
Library generation, genome-wide DMS-MaPseq
Sequencing libraries were prepared with a modified version of the protocol used for DMS-seq3. Specifically, 10 μg of DMS-treated total RNA was denatured for 2 min at 95°C, then fragmented at 95°C for 2 min in 1X RNA Fragmentation Reagent (Zn2+ based, Ambion). Note, this is an increase in starting material over the 1–3 μg used in our previous DMS-seq approach (REF). The reaction was stopped with 1x Stop Solution (Ambion) and quickly placed on ice. The fragmented RNA was run on a 6% TBU (Tris Borate Urea) polyacrylamide gel for 45 min at 150 V. A blue light (Invitrogen) was used for gel imaging, and RNA fragments of 100–170 nucleotides in size were excised, depleting small ncRNA contaminants of <100 nucleotides (tRNAs, snoRNAs). Gel extraction was performed by crushing the purified gel piece and incubating in 300 μl 300 mM NaCl at 70°C for 10 min with vigorous shaking. The RNA was then precipitated by adding 2 μl GlycoBlue (Invitrogen) and 3x volume (900 μl) 100% EtOH, incubating on dry ice for 20 min and spinning at 20k × g for 45 min at 4°C. The samples were then resuspended in 7 μl 1X CutSmart buffer (NEB) and the 3′ phosphate groups left after random fragmentation were resolved by adding 1.5 μl rSAP (NEB), 1 μl of SUPERase Inhibitor (Ambion) and incubating at 37°C for 1 hour. After heat inactivation of the phosphatase at 65°C for 5 min, the samples were then directly ligated to 25 pmol of miRNA cloning linker-2 (IDT) by adding 2 μl T4 RNA ligase2, truncated K227Q (NEB), 1 μl 0.1M DTT, 6.5 μl 50% PEG, 1 μl 10X T4 RNL2 buffer, and incubating for 2 hours at 25°C. Reactions were purified by EtOH precipitation (as above), and excess linker was degraded for 1 hour at 30°C in a 20 μL reaction of 1x RecJ buffer, 1 μl SUPERase Inhibitor, 1 μl 5′ Deadenylase (Epicentre), and 1 μl RecJ exonuclease (Epicentre). Ribosomal RNA was depleted using RiboZero (Epicentre), with a final incubation of 5 min at 40°C, instead of 50°C as recommended in the commercial protocol, and purified by EtOH precipitation. Reverse transcription was performed in a 10 μl volume with 1 pmol oCJ200-link2. To begin, a mixture of RNA/primer/buffer was incubated at 80°C for 2 min to denature the template, then returned to ice for the addition of SUPERase Inhibitor (Ambion), DTT, dNTPs, and RT enzyme to generate the final reaction conditions. For reverse transcription using Superscript II with Mn2+ buffer, we followed the exact published reactions conditions for mutational profiling5 [0.5 mM dNTPs, 50 mM Tris-HCl pH 8.0, 75 mM KCl, 6 mM MnCl2, and 10 mM DTT] and allowed the reaction to proceed for 2–3 h at 42°C with 100U of SuperScript II (Invitrogen). Due to potential pausing of the TGIRT at modification sites, this long incubation time facilitates readthrough of multiple modifications per RNA fragment. For the TGIRT reverse transcription, a 5 min incubation at room temperature followed the initial denaturation, and the RT reaction proceeded for 1.5 h at 57°C with 100 U TGIRT-III enzyme (InGex) and the following reaction conditions: 1 mM dNTPs, 5 mM freshly prepared DTT (Sigma-Aldrich), 10 U SUPERase Inhibitor, 50 mM Tris-HCl pH 8.3, 75 mM KCl, 3 mM MgCl2. After reverse transcription, 1 μl of 5 M NaOH was added and the reaction incubated for 3 min at 95°C to degrade the RNA, followed by EtOH precipitation and gel purification to remove excess RT primer. Finally, cDNAs were circularized using CircLigase (Epicentre), and Illumina sequencing adapters and indexes were introduced by 9–13 cycles of PCR using Phusion HF Polymerase (NEB), oNTI231, and indexing primers with TruSeq 6 bp indices. Libraries were sequenced with oNTI202 in 50 nt single-end reads on the HiSeq4000 (Illumina). See primer sequences in Table S1.
Library generation, targeted DMS-MaPseq
After in vivo DMS treatment and total RNA extraction, 5 μg of total RNA was DNase-treated for 30min at 37°C in 1x TURBO DNase buffer with 1 μl TURBO DNase enzyme (Thermo Fisher Scientific). Reactions were desalted using RNA Clean & Concentrator-5 columns (Zymo Research), and rRNA was depleted using RiboZero (Epicentre) or with RNase H for D. melanogaster and HEK 293T samples, implemented with slight modifications to the published protocol6. For the RNase H protocol, briefly, 5 μg of total RNA was depleted of small RNA species with a Zymo RNA Clean & Concentrator-5 column, retaining RNA >200 nt per manufacturer instructions. RNase H subtraction was performed by adding 5 μg of published subtraction oligos6 in a total volume of 30 μl in 1X Hybridization Buffer (200 mM NaCl, 100 mM Tris pH 7.5). The mixture was incubated at 68°C for 1 min, and the temperature was ramped down at a rate of 1°C/min down to 45°C. MgCl2 was added to a 10 mM final concentration, and 3 μl of Hybridase Thermostable RNase H (Epicentre) was added, followed by a 30 min incubation at 45°C. The reaction was again purified by Zymo RNA Clean & Concentrator-5 column to deplete small RNA species, followed by treatment with DNaseI (Ambion) per manufacturer instructions and a final column clean-up to remove excess RNase H subtraction oligos.
20–100 ng of RNA was used for reverse transcription with 100 U TGIRT-III (InGex) for 2h at 57°C in the same TGIRT reaction conditions described above. We used 5–10 pmol of each gene-specific RT primer and successfully pooled up to six different RT primers in one reaction, using no more than 35 pmol total. DTT was prepared from powder directly before reverse transcription, and we omitted the denaturation step before reverse transcription due to low-level fragmentation of DMS-treated RNA at high temperatures. After moving the reaction to ice, 1 μl RNase H (Enzymatics, 5 U/μl) was added and RNA:DNA hybrids were degraded at 37°C for 20 min to release the cDNA. We use RNase H at this step for convenience—NaOH hydrolysis as used in the genome-wide protocol also works well at this step. cDNA was purified using the ssDNA protocol for DNA Clean & Concentrator-5 columns (Zymo Research). We used the Advantage HF 2 PCR kit (Clontech) with high fidelity conditions for two-step PCR amplification, using 1/12 of the purified RT reaction and gene-specific primers targeting a single template with a target amplicon size of 300–600 nucleotides for low abundance RNA targets. When possible, we designed our gene-specific RT primers close to the PCR amplicon of interest, and in many cases, used the RT primer as the reverse primer in our PCR reactions. High abundance RNAs, such as the yeast 18S rRNA, can be amplified in a single 1.8kb amplicon. Due to the high GC-content of the FXR2 template, we used 200 mM NaCl instead of 75 mM KCl in the RT reaction buffer and the Advantage GC 2 PCR Kit (Clontech) for its amplification. The PCR program begins with 10 cycles at a 65°C annealing temperature to promote specificity, followed by 20–25 cycles at a 57°C annealing temperature. PCR bands were gel purified on a non-denaturing 8% TBE polyacrylamide gel (Invitrogen) and crushed, extracted, and EtOH precipitated as described above. NexteraXT (Illumina) was used to fragment and prepare amplicons (1ng) for sequencing. Tagmented amplicons were barcoded and amplified using 12 cycles of PCR, and barcoded libraries were cleaned using 1.5x (v/v) PCRClean beads (Aline Biosciences). Libraries were quantified using the Fragment Analyzer (Advanced Analytical) and subject to a final quantification by qPCR before sequencing by 50bp single-end reads on the HiSeq4000 (Illumina).
For the UMI-based RT-PCR, reverse transcriptase primers were designed with a random 10 nucleotide barcode, labeling each cDNA with a unique molecular index. Gene-specific variations of oMZ282 were used in the reverse transcription reaction described above, followed by Advantage HF 2 PCR with gene-specific variants of primers oMZ282 and oMZ283. Amplicons were purified by polyacrylamide gel and extracted as described above, and a second round of PCR was done with 20–25 cycles to add Illumina adaptors and indices for sequencing (oMZ284 and indexing primers). Libraries were constructed so the UMI was sequenced first using custom Read1 sequencing primer oNTI202. We used the standard Illumina Read2 primer, and sequencing was done via MiSeq v2 2×150 (Illumina). See primer sequences in Table S1.
Ribosnitch RNA preparation
dsDNA corresponding to the human MRPS21 sequences shown below were in vitro transcribed, mixed, and folded by denaturing at 95°C followed by a brief incubation at 37°C in 350 mM sodium cacodylate buffer and 6 mM MgCl2. 10% DMS (v/v) was added, and the sample was incubated for 10 min at 37°C. The reaction was stopped by placing on ice and adding BME to 30% final volume. The RNA was then purified by RNA Clean & Concentrator-5 column (Zymo), and the small RNA fraction was collected and prepared for sequencing as described in the genome-wide strategy above.
-
MRPS21 A allele,
5′-TGCTGCCATCTCTTTTCTTCTCTATGCGAGGATTTGGACTGGCAGTG-3;
-
MRPS21 C allele,
5′-ATCTCTTTTCTTCTCTCTGCGAGGATTTGGACTGGCAGTGAGAATAAGAGACAA-3′
Sequencing alignment and analysis
Raw fastq files were stripped of linker sequences and filtered for quality using the FASTX-Toolkit Clipper and Quality Filter functions, respectively, requiring that 80% of sequenced bases have a quality score >25 (http://hannonlab.cshl.edu/fastx_toolkit/). Reads were aligned using Tophat v2.1.0 with bowtie2 with the following settings for a 50 nt sequencing run: --no-novel-juncs -N 5 --read-gap-length 7 --read-edit-dist 7 --max-insertion-length 5 --max-deletion-length 5 -g 3. All non-uniquely aligned reads were then removed. Sequencing data was aligned against the Saccharomyces cerevisiae assembly R64 (UCSC: sacCer3) downloaded from the Saccharomyces Genome Database on February 8, 2011 (SGD, www.yeastgenome.org) or against the longest human RefSeq isoforms (hg19). Despite template-switching capabilities of the TGIRT enzyme, we do not detect a substantial number of chimeric reads in our data and do not include a processing step beyond alignment to remove these. Due to empirically determined mutation enrichment from non-template addition and Nextera XT transposase insertion, we trimmed 2, 5, and 7 nucleotides from the 5′ end of each read for TGIRT, SSII/Mn2+, and NexteraXT generated libraries, respectively. Mismatches located within 3 nucleotides of an indel were also discarded for future analysis. The ratiometric DMS signal was calculated for each nucleotide as # mismatches/sequencing depth.
Target-specific sequencing data prepared with NexteraXT was combined across both strand alignments, due to lack of strandedness after tagmentation. Transposase insertion is subject to primary sequence biases in transposase insertion, thus it is possible (although rare) to have amplicon regions that are poorly sampled and result in false positive bases with high ratiometric reactivity due to poor sequencing depth. After linker stripping with a length requirement for reads >100 nt from a 2×150 nt MiSeq run, target-specific sequencing data prepared with the UMI was collapsed to unique reads using FASTX-Collapser. Unique reads are, therefore, the combination of a unique molecular index and internal DMS-induced modifications, which add sequence diversity beyond the 10bp UMI.
Genome-wide yeast DMS-MaPseq data was collected and sequenced with two biological replicates for each SSII/Mn2+ and TGIRT, untreated and in vivo DMS-treated libraries. For each library variation, we collected a combined total of 90 to 200 million uniquely mapped reads between yeast replicates and 200 million for HEK 293T cells. Note that we sequence to a similar depth for a genome-wide DMS-MaPseq experiment as we did for our previously published genome-wide DMS-seq method1.
HEK 293T Gini index calculations
UTR and coding regions were defined by RefSeq coordinates, and we analyzed 50 nt windows beginning at the annotated transcription start site. After requiring a minimum number of 100 total reads at A/Cs and >20x mismatch coverage for each window, we also discarded any windows with evidence for endogenous modifications (>15% mismatch rate). The Gini index was calculated only for A/C bases, as done previously3.
Minimum average coverage calculation
Using 100 nt transcriptome windows, we chose the window with the highest total sequence coverage as representative coverage for the gene. We counted the fraction of genes from the hg19 RefSeq annotation that had an average mismatch coverage >120 mismatches at sequencing depths of 50, 100, and 200 million uniquely mapped reads. We extrapolated the data for 1 billion reads.
Computing the ROC curve for ribosomal RNA
This analysis was completed as previously described, using the yeast ribosome crystal structure7 and the same considerations for solvent accessibility and removal of outliers by 90% Winsorization3.
Secondary structure models
Novel secondary structure models were generated using constraints derived from DMS-MaPseq data using RNAfold8. For FXR2, the sequence corresponding to nucleotides 1–450, which comprise the 5′ UTR and first exon, were folded in RNAfold. Adenine and cytosine bases with an in vitro ratiometric signal greater than 0.03–0.06 were required to be unpaired. Depending on the threshold used, small differences exist in the predicted structure, however, the 0.04 constraint threshold appears to produce the best-fitting model for our experimental data. Due to the high GC content of the FXR2 region (80% GC) and the necessity of using a low fidelity GC polymerase for these experiments, an untreated control was used to mask ten positions with reactivity above background. DMS-MaPseq reactivities were overlaid on structure models using VARNA (http://varna.lri.fr/)9.
Cloning and transfection experiments
The plasmid construct in Supplementary Figure 5 was derived from the ∆ATG FXR2exon1-eGFP-IRES-mCherry plasmid described in Fields et al.10. A gBlock (IDT) was ordered containing a 43bp FXR2-3xFLAG-T2A-AgeI-40bp eGFP fragment for HiFi assembly (NEB) into the linearized plasmid backbone. This wildtype plasmid was used as the PCR template for FXR2 mutations, which were designed as overhangs on primers against the relevant portion of the FXR2 exon1 sequence, resulting in 5′ and 3′ fragments with overlapping mutated regions for HiFi assembly into the linearized wildtype backbone. Successful amplification of fragments was confirmed by running a fraction on an agarose gel and the remainder purified using DNA Clean & Concentrator-5 columns (Zymo) or, in the case of contaminating PCR bands, purified via agarose gel and MinElute gel extraction (Qiagen). Common cloning primers for FXR2 amplification from the plasmid are 5′-CTCACTCGGCGCGCCAGTC-3′ (5′ FXR2 fragment, forward) and 5′-TATAGTCCCCGTCGTGATCCTTGTA-3′ (3′ FXR2 fragment, reverse). Inserts in all analyzed constructs were confirmed by Sanger sequencing (Molecular Cloning Laboratories). Plasmids are listed in Table S2.
For fluorescence measurements, HEK 293T cells were grown as described and transfected with plasmids using TransIT-LT1 (Mirus) two days prior to data collection. eGFP and mCherry fluorescence were quantified using an LSR-II flow cytometer (BD Biosciences). Two plasmids for each type of mutation were assayed for fluorescence, serving as biological duplicates.
Code Availability
Our code is publically available at https://github.com/spersad94/DMS-MaP-Seq-Code
Cell lines
HEK 293T cells were obtained from ATCC.
Supplementary Material
Editor’s summary.
DMS-MaPseq enables genome-wide and target-specific RNA secondary structure probing of even rare or heterogeneously structured RNAs in vivo and was used to study structure involved in translation regulation as well as nascent transcripts.
Acknowledgments
We thank A. Fields from UCSF for FXR2 reporter plasmids; T. Norman, A. Fields, and J. Quinn for insightful discussions and comments on the manuscript; A. Jaeger for providing HEK 293T cells; and the Orr-Weaver lab at the Whitehead Institute for providing flies. We also thank Y. Chen, D. Bogdanoff, E. Chow, and J. Lund at the UCSF Center for Advanced Technology for sequencing assistance; J. Love and S. Levine in the Whitehead Core and MIT BioMicro Center for library preparation; and C. Reiger, M. DeVera, J. Kanter, and G. McCauley for administrative support. This research was supported by the CRSB grant P50 GM102706 (Center for RNA Systems Biology, J.S.W.), the Howard Hughes Medical Institute (J.S.W.), the National Science Foundation grant 1144247 (M. Z.), and the Genentech Foundation (M.Z.). Research on TGIRTs and their modes of use was supported by NIH R01 grants GM37949 and GM37951 (A.M.L.).
Footnotes
Accession Codes
Raw and processed data are available at NCBI Gene Expression Omnibus, accession number GSE84537.
Data Availability Statement
All raw and processed sequencing data are available on NCBI Gene Expression Omnibus, under accession number GSE84537. Plasmids are listed in Table S1 and are available upon request.
Author Contributions
M.Z., J.S.W, and S.R. designed the experiments. A.M.L provided early samples of the TGIRT enzymes and advice on troubleshooting and methods. M.Z., P.G., and S.R. performed the experiments and analyzed the data, with help from S.P. M.Z., J.S.W., and S.R. drafted and revised the manuscript, and all authors reviewed the manuscript and provided comments.
Competing Financial Interests
Thermostable group II intron reverse transcriptase (TGIRT) enzymes and methods for their use are the subject of patents and patent applications that have been licensed by the University of Texas and East Tennessee State University to InGex, LLC. A.M.L. and the University of Texas are minority equity holders in InGex, LLC and receive royalty payments from the sale of TGIRT enzymes and the licensing of intellectual property. The other authors declare no competing financial interests.
References
- 1.Mortimer SA, Kidwell MA, Doudna JA. Insights into RNA structure and function from genome-wide studies. Nat Rev Genet. 2014;15:469–479. doi: 10.1038/nrg3681. [DOI] [PubMed] [Google Scholar]
- 2.Deigan KE, Li TW, Mathews DH, Weeks KM. Accurate SHAPE-directed RNA structure determination. Proc Natl Acad Sci U S A. 2009;106:97–102. doi: 10.1073/pnas.0806929106. [DOI] [PMC free article] [PubMed] [Google Scholar]
- 3.Ouyang Z, Snyder MP, Chang HY. SeqFold: genome-scale reconstruction of RNA secondary structure integrating high-throughput sequencing data. Genome Res. 2013;23:377–387. doi: 10.1101/gr.138545.112. [DOI] [PMC free article] [PubMed] [Google Scholar]
- 4.Rouskin S, Zubradt M, Washietl S, Kellis M, Weissman JS. Genome-wide probing of RNA structure reveals active unfolding of mRNA structures in vivo. Nature. 2014;505:701–705. doi: 10.1038/nature12894. [DOI] [PMC free article] [PubMed] [Google Scholar]
- 5.Wells SE, Hughes JM, Igel AH, Ares M., Jr Use of dimethyl sulfate to probe RNA structure in vivo. Methods Enzymol. 2000;318:479–493. doi: 10.1016/s0076-6879(00)18071-1. [DOI] [PubMed] [Google Scholar]
- 6.Mortimer SA, Weeks KM. A fast-acting reagent for accurate analysis of RNA secondary and tertiary structure by SHAPE chemistry. J Am Chem Soc. 2007;129:4144–4145. doi: 10.1021/ja0704028. [DOI] [PubMed] [Google Scholar]
- 7.Smola MJ, Rice GM, Busan S, Siegfried NA, Weeks KM. Selective 2′-hydroxyl acylation analyzed by primer extension and mutational profiling (SHAPE-MaP) for direct, versatile and accurate RNA structure analysis. Nat Protoc. 2015;10:1643–1669. doi: 10.1038/nprot.2015.103. [DOI] [PMC free article] [PubMed] [Google Scholar]
- 8.Ding Y, et al. In vivo genome-wide profiling of RNA secondary structure reveals novel regulatory features. Nature. 2014;505:696–700. doi: 10.1038/nature12756. [DOI] [PubMed] [Google Scholar]
- 9.Lucks JB, et al. Multiplexed RNA structure characterization with selective 2′-hydroxyl acylation analyzed by primer extension sequencing (SHAPE-Seq) Proc Natl Acad Sci U S A. 2011;108:11063–11068. doi: 10.1073/pnas.1106501108. [DOI] [PMC free article] [PubMed] [Google Scholar]
- 10.Spitale RC, et al. Structural imprints in vivo decode RNA regulatory mechanisms. Nature. 2015;519:486–490. doi: 10.1038/nature14263. [DOI] [PMC free article] [PubMed] [Google Scholar]
- 11.Poulsen LD, Kielpinski LJ, Salama SR, Krogh A, Vinther J. SHAPE Selection (SHAPES) enrich for RNA structure signal in SHAPE sequencing-based probing data. RNA. 2015;21:1042–1052. doi: 10.1261/rna.047068.114. [DOI] [PMC free article] [PubMed] [Google Scholar]
- 12.Kwok CK, Tang Y, Assmann SM, Bevilacqua PC. The RNA structurome: transcriptome-wide structure probing with next-generation sequencing. Trends Biochem Sci. 2015;40:221–232. doi: 10.1016/j.tibs.2015.02.005. [DOI] [PubMed] [Google Scholar]
- 13.Strobel EJ, Watters KE, Loughrey D, Lucks JB. RNA systems biology: uniting functional discoveries and structural tools to understand global roles of RNAs. Curr Opin Biotechnol. 2016;39:182–191. doi: 10.1016/j.copbio.2016.03.019. [DOI] [PMC free article] [PubMed] [Google Scholar]
- 14.Homan PJ, et al. Single-molecule correlated chemical probing of RNA. Proc Natl Acad Sci U S A. 2014;111:13858–13863. doi: 10.1073/pnas.1407306111. [DOI] [PMC free article] [PubMed] [Google Scholar]
- 15.Siegfried NA, Busan S, Rice GM, Nelson JAE, Weeks KM. RNA motif discovery by SHAPE and mutational profiling (SHAPE-MaP) Nat Methods. 2014;11:959–965. doi: 10.1038/nmeth.3029. [DOI] [PMC free article] [PubMed] [Google Scholar]
- 16.Smola MJ, Calabrese JM, Weeks KM. Detection of RNA-Protein Interactions in Living Cells with SHAPE. Biochemistry (Mosc) 2015;54:6867–6875. doi: 10.1021/acs.biochem.5b00977. [DOI] [PMC free article] [PubMed] [Google Scholar]
- 17.Inoue T, Cech TR. Secondary structure of the circular form of the Tetrahymena rRNA intervening sequence: a technique for RNA structure analysis using chemical probes and reverse transcriptase. Proc Natl Acad Sci U S A. 1985;82:648–652. doi: 10.1073/pnas.82.3.648. [DOI] [PMC free article] [PubMed] [Google Scholar]
- 18.Mohr S, et al. Thermostable group II intron reverse transcriptase fusion proteins and their use in cDNA synthesis and next-generation RNA sequencing. RNA N Y N. 2013;19:958–970. doi: 10.1261/rna.039743.113. [DOI] [PMC free article] [PubMed] [Google Scholar]
- 19.Katibah GE, et al. Broad and adaptable RNA structure recognition by the human interferon-induced tetratricopeptide repeat protein IFIT5. Proc Natl Acad Sci U S A. 2014;111:12025–12030. doi: 10.1073/pnas.1412842111. [DOI] [PMC free article] [PubMed] [Google Scholar]
- 20.Beckman RA, Mildvan AS, Loeb LA. On the fidelity of DNA replication: manganese mutagenesis in vitro. Biochemistry (Mosc) 1985;24:5810–5817. doi: 10.1021/bi00342a019. [DOI] [PubMed] [Google Scholar]
- 21.Badis G, Saveanu C, Fromont-Racine M, Jacquier A. Targeted mRNA degradation by deadenylation-independent decapping. Mol Cell. 2004;15:5–15. doi: 10.1016/j.molcel.2004.06.028. [DOI] [PubMed] [Google Scholar]
- 22.Aviran S, Pachter L. Rational experiment design for sequencing-based RNA structure mapping. RNA N Y N. 2014;20:1864–1877. doi: 10.1261/rna.043844.113. [DOI] [PMC free article] [PubMed] [Google Scholar]
- 23.Hooks KB, Griffiths-Jones S. Conserved RNA structures in the non-canonical Hac1/Xbp1 intron. RNA Biol. 2011;8:552–556. doi: 10.4161/rna.8.4.15396. [DOI] [PMC free article] [PubMed] [Google Scholar]
- 24.Ben-Shem A, et al. The structure of the eukaryotic ribosome at 3.0 Å resolution. Science. 2011;334:1524–1529. doi: 10.1126/science.1212642. [DOI] [PubMed] [Google Scholar]
- 25.Aragón T, et al. mRNA Targeting to ER Stress Signaling Sites. Nature. 2009;457:736–740. doi: 10.1038/nature07641. [DOI] [PMC free article] [PubMed] [Google Scholar]
- 26.Latrèche L, Jean-Jean O, Driscoll DM, Chavatte L. Novel structural determinants in human SECIS elements modulate the translational recoding of UGA as selenocysteine. Nucleic Acids Res. 2009;37:5868–5880. doi: 10.1093/nar/gkp635. [DOI] [PMC free article] [PubMed] [Google Scholar]
- 27.Chartrand P, Meng XH, Singer RH, Long RM. Structural elements required for the localization of ASH1 mRNA and of a green fluorescent protein reporter particle in vivo. Curr Biol CB. 1999;9:333–336. doi: 10.1016/s0960-9822(99)80144-4. [DOI] [PubMed] [Google Scholar]
- 28.Jambor H, et al. Systematic imaging reveals features and changing localization of mRNAs in Drosophila development. eLife. 2015;4 doi: 10.7554/eLife.05003. [DOI] [PMC free article] [PubMed] [Google Scholar]
- 29.MacDonald PM. bicoid mRNA localization signal: phylogenetic conservation of function and RNA secondary structure. Dev Camb Engl. 1990;110:161–171. doi: 10.1242/dev.110.1.161. [DOI] [PubMed] [Google Scholar]
- 30.Bullock SL, Ringel I, Ish-Horowicz D, Lukavsky PJ. A′-form RNA helices drive microtubule-based mRNA transport in Drosophila. Nat Struct Mol Biol. 2010;17:703–709. doi: 10.1038/nsmb.1813. [DOI] [PMC free article] [PubMed] [Google Scholar]
- 31.Jambor H, Brunel C, Ephrussi A. Dimerization of oskar 3′ UTRs promotes hitchhiking for RNA localization in the Drosophila oocyte. RNA N Y N. 2011;17:2049–2057. doi: 10.1261/rna.2686411. [DOI] [PMC free article] [PubMed] [Google Scholar]
- 32.Van De Bor V, Hartswood E, Jones C, Finnegan D, Davis I. gurken and the I factor retrotransposon RNAs share common localization signals and machinery. Dev Cell. 2005;9:51–62. doi: 10.1016/j.devcel.2005.04.012. [DOI] [PubMed] [Google Scholar]
- 33.Fields AP, et al. A Regression-Based Analysis of Ribosome-Profiling Data Reveals a Conserved Complexity to Mammalian Translation. Mol Cell. 2015;60:816–827. doi: 10.1016/j.molcel.2015.11.013. [DOI] [PMC free article] [PubMed] [Google Scholar]
- 34.Lorenz R, et al. ViennaRNA Package 2.0. Algorithms Mol Biol AMB. 2011;6:26. doi: 10.1186/1748-7188-6-26. [DOI] [PMC free article] [PubMed] [Google Scholar]
- 35.Wan Y, et al. Landscape and variation of RNA secondary structure across the human transcriptome. Nature. 2014;505:706–709. doi: 10.1038/nature12946. [DOI] [PMC free article] [PubMed] [Google Scholar]
- 36.Meyer M, Plass M, Pérez-Valle J, Eyras E, Vilardell J. Deciphering 3′ss selection in the yeast genome reveals an RNA thermosensor that mediates alternative splicing. Mol Cell. 2011;43:1033–1039. doi: 10.1016/j.molcel.2011.07.030. [DOI] [PubMed] [Google Scholar]
- 37.Babendure JR, Babendure JL, Ding JH, Tsien RY. Control of mammalian translation by mRNA structure near caps. RNA. 2006;12:851–861. doi: 10.1261/rna.2309906. [DOI] [PMC free article] [PubMed] [Google Scholar]
- 38.Kudla G, Murray AW, Tollervey D, Plotkin JB. Coding-sequence determinants of gene expression in Escherichia coli. Science. 2009;324:255–258. doi: 10.1126/science.1170160. [DOI] [PMC free article] [PubMed] [Google Scholar]
- 39.Carlile TM, et al. Pseudouridine profiling reveals regulated mRNA pseudouridylation in yeast and human cells. Nature. 2014;515:143–146. doi: 10.1038/nature13802. [DOI] [PMC free article] [PubMed] [Google Scholar]
- 40.Schwartz S, et al. Transcriptome-wide mapping reveals widespread dynamic regulated pseudouridylation of ncRNA and mRNA. Cell. 2014;159:148–162. doi: 10.1016/j.cell.2014.08.028. [DOI] [PMC free article] [PubMed] [Google Scholar]
- 41.Meyer KD, et al. Comprehensive Analysis of mRNA Methylation Reveals Enrichment in 3′ UTRs and Near Stop Codons. Cell. 2012;149:1635–1646. doi: 10.1016/j.cell.2012.05.003. [DOI] [PMC free article] [PubMed] [Google Scholar]
- 42.Dominissini D, et al. Topology of the human and mouse m6A RNA methylomes revealed by m6A-seq. Nature. 2012;485:201–206. doi: 10.1038/nature11112. [DOI] [PubMed] [Google Scholar]
Online Methods References
- 1.Zubradt M, et al. Genome-wide DMS-MaPseq for in vivo RNA structure determination. Protoc Exch. 2016 http://dx.doi.org/10.1038/protex.2016.068.
- 2.Zubradt M, et al. Target-specific DMS-MaPseq for in vivo RNA structure determination. Protoc Exch. 2016 http://dx.doi.org/10.1038/protex.2016.069.
- 3.Rouskin S, Zubradt M, Washietl S, Kellis M, Weissman JS. Genome-wide probing of RNA structure reveals active unfolding of mRNA structures in vivo. Nature. 2014;505:701–705. doi: 10.1038/nature12894. [DOI] [PMC free article] [PubMed] [Google Scholar]
- 4.Ingolia NT, Ghaemmaghami S, Newman JRS, Weissman JS. Genome-wide analysis in vivo of translation with nucleotide resolution using ribosome profiling. Science. 2009;324:218–223. doi: 10.1126/science.1168978. [DOI] [PMC free article] [PubMed] [Google Scholar]
- 5.Homan PJ, et al. Single-molecule correlated chemical probing of RNA. Proc Natl Acad Sci U S A. 2014;111:13858–13863. doi: 10.1073/pnas.1407306111. [DOI] [PMC free article] [PubMed] [Google Scholar]
- 6.Adiconis X, et al. Comparative analysis of RNA sequencing methods for degraded or low-input samples. Nat Methods. 2013;10:623–629. doi: 10.1038/nmeth.2483. [DOI] [PMC free article] [PubMed] [Google Scholar]
- 7.Ben-Shem A, et al. The structure of the eukaryotic ribosome at 3.0 Å resolution. Science. 2011;334:1524–1529. doi: 10.1126/science.1212642. [DOI] [PubMed] [Google Scholar]
- 8.Lorenz R, et al. ViennaRNA Package 2.0. Algorithms Mol Biol AMB. 2011;6:26. doi: 10.1186/1748-7188-6-26. [DOI] [PMC free article] [PubMed] [Google Scholar]
- 9.Darty K, Denise A, Ponty Y. VARNA: Interactive drawing and editing of the RNA secondary structure. Bioinforma Oxf Engl. 2009;25:1974–1975. doi: 10.1093/bioinformatics/btp250. [DOI] [PMC free article] [PubMed] [Google Scholar]
- 10.Fields AP, et al. A Regression-Based Analysis of Ribosome-Profiling Data Reveals a Conserved Complexity to Mammalian Translation. Mol Cell. 2015;60:816–827. doi: 10.1016/j.molcel.2015.11.013. [DOI] [PMC free article] [PubMed] [Google Scholar]
Associated Data
This section collects any data citations, data availability statements, or supplementary materials included in this article.