

A considerable global need exists for simple, portable, inexpensive, and integrated assay and diagnostic approaches that are appropriate for use in minimal-infrastructure, resource-poor settings such as those found in the developing world, as well as for use in resource-limited environments such as those encountered by emergency first responders, primary care physicians, patients at home, forensic investigators, and military field personnel.[1-3] Continuing advances in microfluidics have enabled the demonstration of prototype lab-on-a-chip devices that offer to help answer this challenge and improve access to chemical and biological sample analysis by paving the way for the introduction of low-cost, portable point-of-need assay systems. Although such systems would have immediate applications in many fields, there are at present relatively few commercially available examples of the technology.[4,5]
In clinical and industrial laboratory analyses, the most widely used and generally accepted methods to quantify particulate, chemical or biochemical analytes employ optical detection approaches based on absorbance, fluorescence or luminescence. While lab-on-a-chip implementations of optical methods have been demonstrated, detection is typically achieved off-chip using conventional microscope optics and digital camera systems or custom and relatively expensive chip-scale optoelectronics.[6,7] The translation of these established methods into truly portable micro total analysis systems has been hindered in part by a lack of reasonably priced, sensitive and compact optical detectors that can easily be interfaced with microfluidic sample handling.[4,7] In response to this limitation, we demonstrate the feasibility of applying an inexpensive, readily-available complementary metal–oxide–semiconductor (CMOS) image sensor, originally intended for use in mass market digital camera applications, as a viable option for integrated optical detection in a variety of microfluidic systems. Specifically, we report direct integration of this chip-scale sensor with our digital fluid-handling system to track nL-volume reagent droplets via contact imaging, as well as show its more general application as a quantitative photometer for integrated optical detection of colorimetric and bioluminescent assays implemented in various lab-on-a-chip architectures.
Point-of-need assay platforms will complement, rather than supplant, existing laboratory-based analysis methods and hardware that form the foundation of clinical diagnostics and academic research. Indeed, within the realm of analytical (and particularly, diagnostic) technology and instrumentation, the development of inexpensive point-of-need assays is a rather specific, but not inconsequential endeavor. Over 95% of the world’s deaths due to major infectious diseases occur in developing countries, and while these diseases are largely treatable with drug therapy, the lack of available, infrastructure-appropriate diagnostic assays means that healthcare workers in these settings are unable to identify who is, or — just as critically — is not, in need of treatment.[2,3] Simple, portable, inexpensive assay systems also provide utility in natural disaster or other emergency situations that indiscriminately arise in all countries.[8]
Technology and instrumentation for performing chemical and biochemical analyses have, thus far, typically been advanced to meet the demands of comparatively well-funded laboratories. State-of-the-art assay systems employing flow-injection analysis (FIA) concepts,[9,10] automated microplate processors and readers, or other mechanized sample handling technologies,[11,12] provide impressive capabilities for respective continuous or parallel processing and assaying hundreds or thousands of samples per hour (sample preparation and readout times combined can average well under one second per sample), making them especially useful in centralized laboratories where high-throughput is essential. While such systems are currently the mainstay of clinical diagnostics, drug discovery, and many research laboratories (and will likely remain so for the foreseeable future), lab-on-a-chip assay approaches are primarily targeted to providing sample in, answer out assay capabilities by integrating sample handling and processing steps into a closed microfluidic architecture that is often single-use and more ideally suited for localized assay applications. It is probable that many analyses will remain the province of dedicated centralized laboratories, but it is also anticipated that therapies and biomarkers discovered via high-throughput techniques will increasingly be implemented at the bedside using localized assay systems.[13-15] The various sample handling and assay approaches are not disparate or incompatible. The latest-generation flow-injection (FI) methodology of lab-on-valve (LOV) enables low-volume reagent based assays at the micro- and submicroliter level by exploiting miniaturization and integration principles analogous to those that drive the development of labon- a-chip devices.[16,17] Lab-on-a-chip systems that employ flow-injection have also been described.[18,19] Furthermore, state-of-the-art highdensity microplate instruments routinely manipulate and utilize sample volumes down to a few μL, effectively making them microfluidic. The current trend for such array-based assay formats is towards higher-density microarray and multiplexed schemes that employ submicroliter sample and reagent volumes.[20] Alternatively, 96- and 384-microzone plates fabricated using paper substrates have recently been described as a low-cost replacement to conventional molded polymer multiwell plates for use in resource-limited laboratories.[21] These various approaches are not only compatible, they can also be combined synergistically with microfluidics to yield new means for performing bioassays.[22] It is unlikely that any singular technology or approach will provide comprehensive utility for performing assays in every circumstance. Rather, systems will emerge from a broad array of available components and demonstrated capabilities, and solutions will be devised that optimize traits such as speed, sensitivity, specificity, ease of use, portability, and cost per assay according to the requirements and infrastructure imposed by the particular environment in which the technology is to be used.
We sought a compact and cost-effective imaging and detection solution for reagent droplet tracking and assay quantification for our dielectrophoresis (DEP) based microfluidic system. Contact imaging (also referred to as direct or shadow imaging) is achieved by coupling a photodetector array directly to the area to be imaged without intervening optics, making it ideal for use in microdevices where the object(s) of interest and sensor are of a similar scale.[23-25] Efforts in this area have mainly been targeted at providing contact images of particles, cells, and other biological entities. Kovacs and colleagues were the first to demonstrate using shadow images from a camera chip attached to the bottom of a microfluidic culture chamber to monitor the activity of C. elegans nematodes (typical length, approximately 1 mm) that were maintained in a microfluidic environment.[23] Ozcan has reported a lensfree cell monitoring technique (LUCAS) to enumerate various microparticles by employing image processing algorithms to recognize signature diffraction patterns (rather than high resolution images) produced by illuminated polystyrene microbeads, yeast, E. coli, erythrocytes and hepatocytes, for example.[26] Yang has demonstrated a novel lensless contact imager capable of yielding high-resolution images of cells, spores, and nematodes by essentially raster scanning (and then computationally reconstructing) objects that are in translational motion in a microchannel.[25] This optofluidic microscopy (OFM) technique employs an array of custom-fabricated apertures over a 200-pixel linear region to provide intermittent 1 μm-diameter images spaced 9.9 μm apart. The approach has not been demonstrated for assay detection and may well be of limited utility in this capacity, since the inherent aperture array mask physically blocks 99.0% of incident photons before they reach the photodetector. Filippini and Lundström have developed a computer screen photo-assisted technique (CSPT) that employs a computer screen as solid-state light source and web camera as an optical detector for characterizing and identifying collections of chemical indicators. The approach has been used, for example, to evaluate commercial multi-parameter paper test strip colorimetric assays[27] and to characterize the spectral absorbance and emission responses of porphyrins exposed to various gases and organic vapors in assays using specially-prepared thin-film-on-glass sensing arrays.[28] Although the CSPT approach does not employ integrated contact imaging and is not explicitly targeted toward microfluidic-based assays, such studies do reveal the feasibility of applying readily-available consumer electronic technology to chemical and biochemical assay detection. Martinez, Whitesides, and colleagues have described a prototype system for low-cost telemedicine that employs paper-based microfluidics and consumer cameras or scanners to digitize assays for transmission from remote sites to a central laboratory for analysis by trained evaluators.[29] Here, we demonstrate that an inexpensive and readily-available component can be implemented with channel, reservoir, and droplet-based microfluidic architectures and with different standard bioassay chemistries to provide quantitative imaging of microscale analyses. To our knowledge this is the first report of a single, off-the-shelf device so ubiquitously applied for integrated optical detection in labs-on-a-chip.
Our microfluidic device utilizes electrically-generated forces to manipulate discrete reagent droplets within an immiscible fluid to perform biochemical assays.[30,31] A key feature of the system is that reagents are not confined to channels but are instead freely manipulated using an addressable electrode array, allowing reconfiguration of droplet paths as required for various applications (a number of analogous, digital microfluidic approaches are currently being developed.)[32-34] Since the fluid paths are not predefined, a capability to monitor the position and routing of droplets within the system is useful. For our application we chose a commercially available five megapixel CMOS image sensor that retails for less than 20 dollars. According to the sensor manufacturer, a complete imaging system can be built from 40 dollars worth of electronic components using their reference design and available open application source code. The use of a mass-produced CMOS sensor provides several advantages. Foremost, because development and production costs are distributed over many millions of unit sales, it is possible to realize an advanced and fully featured component at a reasonable cost per unit. CMOS fabrication methods enable integration of the photon sensing array, analog to digital signal conversion, image processing, and system control into a single device that outputs quantitative, digital data and requires a minimum of support components. Additionally, CMOS fabrication takes advantage of established techniques that are widely used in the volume manufacture of microprocessor and memory devices. The specifications of the image sensor used in these experiments make it suitable for integration with a variety of microfluidic devices in addition to those we describe here. The active imaging area is 5.70 mm × 4.28 mm and comprises an array of approximately five million 2.2 μm square pixels, supporting both quantitative photodetection and high resolution contact imaging of typical microfluidic features. The responsivity and low dark current provide low light level performance that is acceptable for most applications. Values from neighboring pixels can also be summed to further increase sensitivity or averaged to decrease signal noise as needed. While such spatial pixel binning results in a concomitant decrease in signal resolution, the use of a high density array of millions of small light-sensing elements mitigates this effect.
The implementation of our dielectrophoresis-based digital microfluidic device used in these studies consists of an array of fluid handling microelectrodes (Figure 1b) and an upper fluidics layer. The stacked construction design (Figure 1d) allows the device to be directly interfaced with the imaging surface of the CMOS sensor and attached to the circuit board that carries the sensor and support electronics (Figures 1a and 1d). This design minimizes the overall system size and is applicable to other microfluidic device architectures, including those that employ glass or polymer microchannels (Figure 2a) or arrays of microfluidic wells or spots (Figure 3a). The design also allows the assay reagents and fluid handling system to be fabricated in the form of a replaceable cartridge, as opposed to single use designs where assays are performed directly on the sensor itself.[35] For our contact imaging experiments, we utilized a collimated light source (tungsten lamp and modular beam collimator) to minimize diffraction artifacts and image blurring. Use of a point source light emitting diode has also been demonstrated for this purpose.[23] The array of 2.2 μm pixels enables good imaging of electrode features (Figure 1c), as well as low resolution imaging of cells and latex microparticles. This straightforward imaging approach also provides visualization and position tracking of nanoliter and smaller reagent droplets (Figures 1e and 1f; single droplets shown for clarity), making it practical for general purpose use in digital microfluidic applications.
Figure 1.
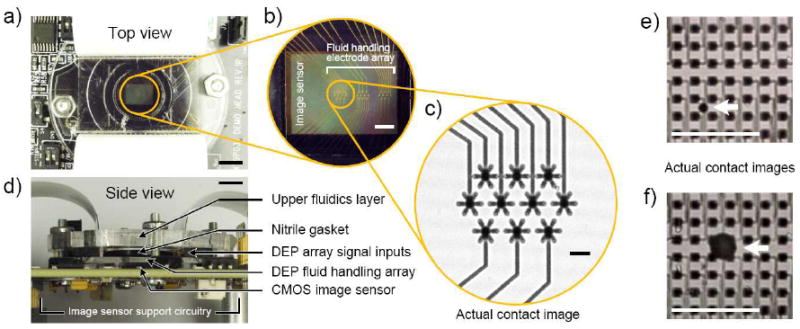
CMOS image sensor integrated with dielectrophoresis-based digital microfluidic device and contact imaging of fluid handling microelectrodes and reagent droplets. (a) Top view of integrated system comprising laser-machined polymer fluidics upper layer, fluid handling microelectrode array, image sensor for tracking position of reagent droplets, and image sensor support circuitry. (b) Magnification of circled area in (a). Fluid handling gold microelectrodes positioned over the image sensor. (c) Contact image of circled area in (b) taken using the integrated image sensor. (d) Side view of integrated system illustrating stacked construction approach and compact system size. (e,f) Contact images of microelectrode array and reagent droplets (marked by arrows) obtained using the integrated image sensor. Reagent droplet volumes are 0.33 nL (e) and 13.0 nL, (f). Scale bars, 5 mm (a) and (d), 1 mm (b), (e) and (f), and 125 μm (c).
Figure 2.
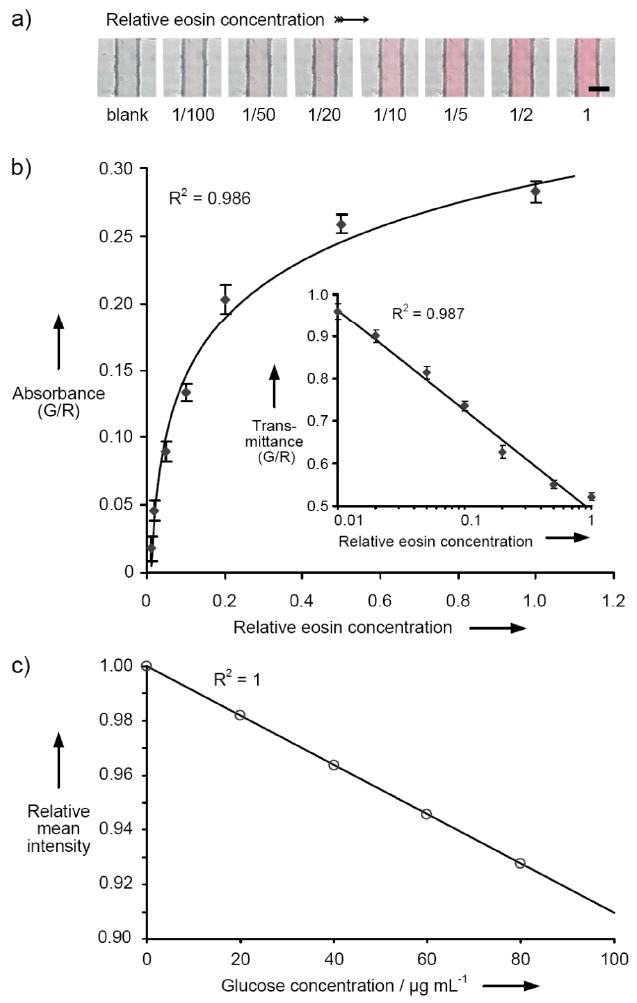
Quantitative colorimetric detection and analysis using a commercially available CMOS image sensor. (a) Contact images of eosin solutions in a 200 μm-wide × 20 μm-deep PDMS microchannel. The relative eosin concentration in each solution is noted under its image, with the initial stock designated as “1” and the buffer only sample designated as “blank.” Scale bar, 200 μm. (b) The absorbance of each of the eosin solutions shown in (a) is determined from analysis of red (600 nm) and green (530 nm) pixel intensity values as quantified with the image sensor during exposure of the contact image. Inset reports the data as transmittance. (c) Colorim etric analysis of glucose concentration by contact imaging. Pixel intensity values are measured with the image sensor to determine absorbance of oxidized o-Dianisidine as a function of glucose concentration as described in the Supporting Information.
Figure 3.

Quantitative bioluminescent detection and analysis using a commercially available CMOS image sensor. (a) Contact image of Kinase Glo Plus assay reactions in an array of 1 mm diameter polymer microwells. The ATP concentration in each reaction is noted under its image with the no ATP controls designated as “blank.” (b) The relative chemiluminescence (in arbitrary units) of each reaction shown in (a) is determined from analysis of the blue (450 nm) pixel intensity values as quantified with the image sensor dubring exposure of the contact image as described in the Supporting Information.
In addition to droplet based schemes, we also evaluated the utility of the CMOS image sensor as a microscale quantitative absorbance detector. We chose a typical microfluidic channel architecture, fabricated using cast polydimethylsiloxane (PDMS) bonded to a glass coverslip. As in the contact imaging experiments with droplets, the microfluidic assembly was placed directly on the imaging surface of the sensor and transilluminated with collimated light. The lack of intervening optics and large area (24 mm2) sensor array facilitates simple and misalignment-tolerant integration of the microfluidic and detector components. It also enables measurements to be performed on multiple samples in parallel using a single sensor device. The image sensor we chose is produced with integrated RGB Bayer filters that provide capability for multiple wavelength (600, 530, and 450 nm) absorbance measurements, obviating the need for additional optical elements. Also, since the images obtained from the sensor include filtered wavelength data, they are useful for both single and multicolor colorimetric assays (Figure 2a). Such RGB filter-based optical detection approaches are also routinely applied in a wide range of conventional microplate reader systems. An available monochrome version of the CMOS sensor offers better quantum efficiency and would be appropriate for circumstances where enhanced low light sensitivity is needed.
For our initial studies, we evaluated solutions of eosin Y, a red dye with maximum absorption in aqueous solution between 515–518 nm. Serial dilutions were prepared from stock to span a range of concentrations across two orders of magnitude. Before analysis of the test solutions, the 20 μm-deep microchannel was filled with water, and the red, green and blue digital gains were independently adjusted to give matched average intensity values for each color component for a multipixel region of interest in the center of the microchannel. Such “white balancing” of the image is akin to zeroing a conventional spectrophotometer, and is easily automated. Basic image processing was used to find the edges of the channel (they are apparent in the contact image, and are distinguished graphically in a plot of the intensity data as regions of low transmittance). The intensity data from the resulting color contact images was analyzed to obtain an absorbance for each sample by comparing ratio of the pixel intensity at 530 and 600 nm. The mean intensity ratios obtained from a minimum 1 × 50 pixel region of interest in the central area of the channel provided quantitative absorbance data that correlated well with eosin Y concentration over a 100- fold concentration range (Figure 2b). By averaging data from several neighboring photodetectors, the signal to noise ratio of the absorbance measurements is increased as evidenced by the small relative error and good fit of the trendlines. To demonstrate that the sensor is capable of being applied to biochemical analyses based on widely-available reagent chemistries, we also performed a colorimetric glucose assay. Specifically, we chose a standard coupled enzyme assay in which the conversion of glucose to gluconic acid is proportionally linked to the oxidation of o-Dianisidine to form a colored product whose absorbance is measured at 540 nm. As before, the samples were contained within a microfluidic layer that was placed directly on top of the sensor. We were able to quantitatively image glucose solution concentrations that spanned the recommended working range of the assay. A plot of the relative averaged green pixel intensity versus glucose concentration generated a linear standard curve with excellent trendline fit statistics (Figure 2c), similar to results that would be expected from a conventional spectrophotometer.
Although absorbance-based methods are routinely employed in bioanalysis, they can be difficult to apply when analyzing highly colored matrices, such as whole blood. For such analyses, methods based on fluorescence or luminescence would be preferred. Also, sensitive colorimetric determinations can be problematic to implement in microfluidics because of the inherently short optical path lengths. Whitesides and colleagues have developed a low-cost single channel optical sensor and alternative immunoassay chemistry based on reduction of silver ions to opaque silver film to circumvent this problem.[36] Assay methods that employ chemiluminescent reactions which produce their own light,[37] are widely-available and can also be used to overcome this difficulty. Furthermore, the use of such assay chemistries simplifies system integration by eliminating the need for an excitation source. We investigated the applicability of the CMOS image sensor as a microscale photometer for quantitatively detecting such chemiluminescent reactions, again employing a contact imaging approach. Accordingly, we incubated a bioluminescent reagent intended for screening of kinase activity (Kinase Glo Plus, Promega Corporation) with various concentrations of its substrate, ATP. The reactions were contained in an array of 1 mm diameter microwells (comparable to the diameter of individual wells on a 1536-well microplate) that was fabricated on a glass coverslip and placed directly on the sensor imaging surface. A repurposed black phenolic bottle cap was used to protect the array assembly from stray light, and the array chemiluminescence was integrated using a 200 ms exposure. The resulting contact image of the array (Figure 3a) reveals the different ATP concentration in each well across a 10-fold concentration range. The relative chemiluminescence of each sample was quantified (Figure 3b) by averaging the intensity data from a 1 × 100 pixel region of interest (approximately 20% of the diameter) from the center of each microwell. As in the absorbance studies, averaging data from multiple pixels increased the signal to noise ratio, and a good correlation between the measured intensity and reagent concentration was obtained.
Indeed, for applications where analytes need to be analyzed rapidly or at exceedingly low concentrations, the ultimate detection sensitivity of the analysis platform is the foremost parameter of concern. Assay systems employing photomultiplier tubes, avalanche photodiodes, and (more recently) low-noise, cooled CCD cameras possess impressive gain and dynamic range properties, and they are able to achieve limits of detection down to at least picomolar sensitivity.[7] Such performance is not however, inexpensive, as plate readers or other analysis platforms that employ these high-performance detectors are generally priced in the $10,000–100,000 range. Similar to the manner in which CCD image sensors are implemented for purposes that were once the exclusive domain of more costly detectors, advances in detector technology are narrowing the performance gap between CMOS and CCD based image sensors. Furthermore, detection limits for a given assay system are a function of both the detector and the reporter chemistry being utilized, and signal amplification can be attained via both of these system components. Use of a less sensitive detector may necessitate an appropriately compensatory assay approach that employs alternative or novel reporter schemes to amplify analyte signals to a suitable level.
In summary, these investigations demonstrate that it is possible to use a low-cost and readily-available CMOS sensor chip as a microscale contact imager for droplet-based microfluidics and as a quantitative photometer for integrated optical detection of microfluidic implementations of typical absorbance and chemiluminescence assays. We anticipate expanding the utility of the method by incorporating a capacity for fluorescence based assays. The use of contact imaging for lab-on-a-chip detection simplifies system integration, eliminates the need for precision alignment of multiple optical components, and is applicable to the most common microfluidic architectures including those based on channels, reservoirs or droplets. In applications where the overall cost of the assay system is the factor that must be optimized, readily-available CMOS image sensors provide an assay detection solution with an exceptional price-to-performance ratio, and their use in this capacity certainly merits further exploration.
Experimental Section
Contact imaging was performed using an Aptina MT9P031I12STC image sensor. The fluid handling microelectrodes were fabricated using standard microlithographic processing of thin-film substrates, and the fluidics layer was fabricated from sheet acrylic. Droplet manipulation by dielectrophoresis is described in detail elsewhere.[30,31] For the colorimetric assays, microchannels were cast in PDMS elastomer using a negative mold and bonded to a glass coverslip. Eosin Y was diluted in deionized water. Data for each point is the average from a >50-pixel region in the channel center. For the glucose assays, Sigma-Aldrich glucose oxidase assay kit GAGO-20 was used according to the manufacturer’s protocol. Reactions were loaded into hybriwells affixed to glass coverslips and contact imaged. Data for each point is the mean intensity value obtained from a 2025-pixel region. For the bioluminescent assays, a microwell array was constructed from polyester sheet and a glass coverslip. Promega Kinase-Glo Plus Luminescent Kinase Assay was used according to the manufacturer’s protocol. ATP was dilut ed into kinase buffer. Chemiluminescent reactions were loaded into microwells and contact imaged. Data shown for each point is the average from a 100-pixel region in the center of each well (see the Supporting Information for further experimental details).
Supplementary Material
Footnotes
This work was supported by NIH grant 5R01EB006198 (D.M.V., P.R.C.G., J.V.) and by InGeneron, Inc. (G.P.S.). W e thank Caleb Williams, Paul Karazuba and Joe Camilleri at Aptina Imaging; Robert Riegelsperger at Optical Instrument Laboratory, Inc.; Philip Lorenzi, and Yasheng Yan.
Supporting information for this article is available on the WWW under http://www.angewandte.org or from the author.
Contributor Information
Dr. Daynene M. Vykoukal, Department of Molecular Pathology, The University of Texas M. D. Anderson Cancer Center, 7435 Fannin Street, Houston, Texas 77054 (USA)
Dr. Gregory P. Stone, Department of Molecular Pathology, The University of Texas M. D. Anderson Cancer Center, 7435 Fannin Street, Houston, Texas 77054 (USA) InGeneron, Incorporated, 8275 El Rio Street, Suite 130, Houston, Texas 77054 (USA).
Dr. Peter R. C. Gascoyne, Department of Molecular Pathology, The University of Texas M. D. Anderson Cancer Center, 7435 Fannin Street, Houston, Texas 77054 (USA)
Dr. Eckhard U. Alt, Department of Molecular Pathology, The University of Texas M. D. Anderson Cancer Center, 7435 Fannin Street, Houston, Texas 77054 (USA)
Dr. Jody Vykoukal, Department of Molecular Pathology, The University of Texas M. D. Anderson Cancer Center, 7435 Fannin Street, Houston, Texas 77054 (USA), Fax: (+1) 713-834-6103, jody@mdanderson.org
References
- 1.Hay B, Wasserman J, Dahl CA. Nature. 2006;S1:1–2. [Google Scholar]
- 2.Urdea M, Penny LA, Olmsted SS, Giovanni MY, Kaspar P, Shepherd A, Wilson P, Dahl CA, Buchsbaum S, Moeller G, Hay B. Nature. 2006;S1:73–79. doi: 10.1038/nature05448. [DOI] [PubMed] [Google Scholar]
- 3.Yager P, Domingo GJ, Gerdes J. Annu Rev Biomed Eng. 2008;10:107–144. doi: 10.1146/annurev.bioeng.10.061807.160524. [DOI] [PubMed] [Google Scholar]
- 4.Myers FB, Lee LP. Lab Chip. 2008;8:2015–2031. doi: 10.1039/b812343h. [DOI] [PubMed] [Google Scholar]
- 5.Whitesides GM. Nature. 2006;442:368–373. doi: 10.1038/nature05058. [DOI] [PubMed] [Google Scholar]
- 6.West J, Becker M, Tombrink S, Manz A. Anal Chem. 2008;80:4403–4419. doi: 10.1021/ac800680j. [DOI] [PubMed] [Google Scholar]
- 7.Brennan D, Justice J, Corbett B, McCarthy T, Galvin P. Anal Bioanal Chem. 2009 doi: 10.1007/s00216-009-2826-5. [DOI] [PubMed] [Google Scholar]
- 8.Kost GJ, Tran NK, Tuntideelert M, Kulrattanamaneeporn S, Peungposop N. Am J Clin Pathol. 2006;126:513–520. doi: 10.1309/NWU5E6T0L4PFCBD9. [DOI] [PubMed] [Google Scholar]
- 9.Ruzicka J, Hansen EH. Anal Chem. 2000;72:212A–217A. doi: 10.1021/ac002756m. [DOI] [PubMed] [Google Scholar]
- 10.Ruzicka J, Hansen EH. TrAC-Trends Anal Chem. 2008;27:390–393. [Google Scholar]
- 11.Chapman T. Nature. 2003;421:661–666. doi: 10.1038/421661a. [DOI] [PubMed] [Google Scholar]
- 12.Blow N. Nat Methods. 2008;5:109–112. doi: 10.1038/nmeth0108-109. [DOI] [PubMed] [Google Scholar]
- 13.Kling J. Nat Biotechnol. 2006;24:891–893. doi: 10.1038/nbt0806-891. [DOI] [PubMed] [Google Scholar]
- 14.Sorger PK. Nat Biotechnol. 2008;26:1345–1346. doi: 10.1038/nbt1208-1345. [DOI] [PubMed] [Google Scholar]
- 15.Mukhopadhyay R. Anal Chem. 2009;81:4169–4173. doi: 10.1021/ac900638w. [DOI] [PubMed] [Google Scholar]
- 16.Ruzicka J. Analyst. 2000;125:1053–1060. doi: 10.1039/b004512h. [DOI] [PubMed] [Google Scholar]
- 17.Chen XW, Wang JH. Anal Chim Acta. 2007;602:173–180. doi: 10.1016/j.aca.2007.09.019. [DOI] [PubMed] [Google Scholar]
- 18.Xu ZR, Zhong CH, Guan YX, Chen XW, Wang JH, Fang ZL. Lab Chip. 2008;8:1658–1663. doi: 10.1039/b805774e. [DOI] [PubMed] [Google Scholar]
- 19.Rapp BE, Carneiro L, Lange K, Rapp M. Lab Chip. 2009;9:354–356. doi: 10.1039/b815690e. [DOI] [PubMed] [Google Scholar]
- 20.Ling MM, Ricks C, Lea P. Expert Rev Mol Diagn. 2007;7:87–98. doi: 10.1586/14737159.7.1.87. [DOI] [PubMed] [Google Scholar]
- 21.Carrilho E, Phillips ST, Vella SJ, Martinez AW, Whitesides GM. Anal Chem. 2009 doi: 10.1021/ac900847g. [DOI] [PubMed] [Google Scholar]
- 22.Derveaux S, Stubbe BG, Braeckmans K, Roelant C, Sato K, Demeester J, De Smedt SC. Anal Bioanal Chem. 2008;391:2453–2467. doi: 10.1007/s00216-008-2062-4. [DOI] [PMC free article] [PubMed] [Google Scholar]
- 23.Lange D, Storment CW, Conley CA, Kovacs GTA. Sens Actuators B-Chem. 2005;107:904–914. [Google Scholar]
- 24.Ji HH, Sander D, Haas A, Abshire PA. IEEE Trans Circuits Syst I-Regul Pap. 2007;54:1698–1710. [Google Scholar]
- 25.Cui X, Lee LM, Heng X, Zhong W, Sternberg PW, Psaltis D, Yang C. Proc Natl Acad Sci USA. 2008;105:10670–10675. doi: 10.1073/pnas.0804612105. [DOI] [PMC free article] [PubMed] [Google Scholar]
- 26.Seo S, Su TW, Tseng DK, Erlinger A, Ozcan A. Lab Chip. 2009;9:777–787. doi: 10.1039/b813943a. [DOI] [PMC free article] [PubMed] [Google Scholar]
- 27.Filippini D, Lundström I. Analyst. 2006;131:111–117. doi: 10.1039/b508783j. [DOI] [PubMed] [Google Scholar]
- 28.Filippini D, Alimelli A, Di NC, Paolesse R, D’Amico A, Lundström I. Angew Chem. 2006;118:3884–3887. doi: 10.1002/anie.200600050. [DOI] [PubMed] [Google Scholar]; Angew Chem Int Ed. 2006;45:3800–3803. doi: 10.1002/anie.200600050. [DOI] [PubMed] [Google Scholar]
- 29.Martinez AW, Phillips ST, Carrilho E, Thomas SW, III, Sindi H, Whitesides GM. Anal Chem. 2008;80:3699–3707. doi: 10.1021/ac800112r. [DOI] [PMC free article] [PubMed] [Google Scholar]
- 30.Schwartz JA, Vykoukal JV, Gascoyne PR. Lab Chip. 2004;4:11–17. doi: 10.1039/b310285h. [DOI] [PMC free article] [PubMed] [Google Scholar]
- 31.Gascoyne PR, Vykoukal JV, Schwartz JA, Anderson TJ, Vykoukal DM, Current KW, McConaghy C, Becker FF, Andrews C. Lab Chip. 2004;4:299–309. doi: 10.1039/b404130e. [DOI] [PubMed] [Google Scholar]
- 32.Teh SY, Lin R, Hung LH, Lee AP. Lab Chip. 2008;8:198–220. doi: 10.1039/b715524g. [DOI] [PubMed] [Google Scholar]
- 33.Sista R, Hua Z, Thwar P, Sudarsan A, Srinivasan V, Eckhardt A, Pollack M, Pamula V. Lab Chip. 2008;8:2091–2104. doi: 10.1039/b814922d. [DOI] [PMC free article] [PubMed] [Google Scholar]
- 34.Gong J, Kim CJ. Lab Chip. 2008;8:898–906. doi: 10.1039/b717417a. [DOI] [PMC free article] [PubMed] [Google Scholar]
- 35.Mallard F, Marchand G, Ginot F, Campagnolo R. Biosens Bioelectron. 2005;20:1813–1820. doi: 10.1016/j.bios.2004.07.031. [DOI] [PubMed] [Google Scholar]
- 36.Sia SK, Linder V, Parviz BA, Siegel A, Whitesides GM. Angew Chem. 2004;116:504–508. doi: 10.1002/anie.200353016. [DOI] [PubMed] [Google Scholar]; Angew Chem Int Ed. 2004;43:498–502. doi: 10.1002/anie.200353016. [DOI] [PubMed] [Google Scholar]
- 37.Filanoski B, Rastogi SK, Cameron E, Mishra NN, Maki W, Maki G. Luminescence. 2008;23:22–27. doi: 10.1002/bio.1011. [DOI] [PubMed] [Google Scholar]
Associated Data
This section collects any data citations, data availability statements, or supplementary materials included in this article.