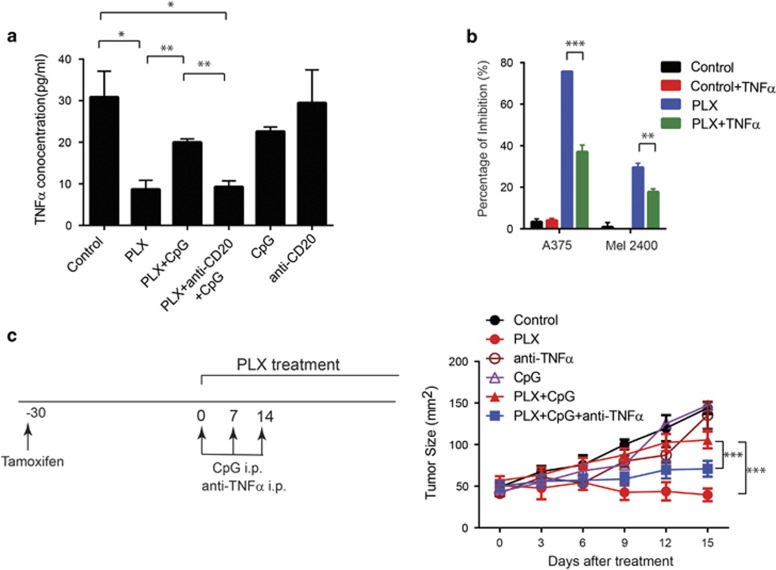
Figure 3.
CpG treatment dampens BRAF inhibitor-induced tumor regression through B-cell-derived TNFα. (a) Sera samples from tumor-bearing BP mice treated as in Figure 2d were collected and measured by MILLIPLEX mouse cytokine/chemokine panels I (premixed 32-plex) and II (premixed 8-plex) according to the manufacturer's protocol (EMD Millipore, Billerica, MA, USA). The concentration of each cytokine and chemokine in serum was determined using a Luminex 200 system (Luminex Corporation, Austin, TX, USA). Serum expression of TNFα from different treatment groups are shown. N=3 per group. (b) Melanoma tumor cells A375 and 2400 were seeded at 1000 cells per well and stimulated with 1 μm PLX, 20 ng/ml TNFα (Bioxcell) or both. Three days later, cell viability was determined using CellTiter Blue assay according to the manufacturer’s protocol (Promega, Madison, WI, USA). Data expressed as mean±s.e.m. of triplicates from two independent experiments. (c) Tumor-bearing BP mice were treated with vehicle, PLX, CpG, or combination of PLX and CpG as described in Figure 2. To neutralize TNFα, mice were injected with 100 μg of rat anti-mouse TNFα IgG1 (Bioxcell) intraperitoneally once per week for 2 weeks, either alone or together with PLX and CpG. Tumor sizes were monitored every 3 days. (Control group: N=5; PLX group: N=4; anti-TNFα group: N=5; CpG group: N=4; PLX+CpG group: N=6; PLX+CpG+anti-TNFα group: N=6). Data expressed as mean±s.e.m. *P<0.05, **P<0.01, ***P<0.001, one-way ANOVA (a, b) or two-way ANOVA (c) plus post hoc Turkey test.

