Abstract
Purpose
To present a method for spatio-temporal alignment of in-utero magnetic resonance imaging (MRI) time series acquired during maternal hyperoxia for enabling improved quantitative tracking of blood-oxygen-level dependent (BOLD) signal changes that characterize oxygen transport through the placenta to fetal organs.
Methods
The proposed pipeline for spatio-temporal alignment of images acquired with a single shot gradient echo echo-planar imaging includes (i) signal non-uniformity correction, (ii) intra-volume motion correction based on non-rigid registration, (iii) correction of motion and non-rigid deformations across volumes, and (iv) detection of the outlier volumes to be discarded from subsequent analysis. BOLD MRI time series collected from ten pregnant women during 3T scans were analyzed using this pipeline. To assess pipeline performance, signal fluctuations between consecutive time points were examined. In addition, volume overlap and distance between manual ROI delineations in a subset of frames and the delineations obtained through propagation of the ROIs from the reference frame were used to quantify alignment accuracy. A previously demonstrated rigid registration approach was used for comparison.
Results
The proposed pipeline improved anatomical alignment of placenta and fetal organs over the state-of-the-art rigid motion correction methods. In particular, unexpected temporal signal fluctuations during the first normoxia period were significantly decreased (p<0.01) and volume overlap and distance between region boundaries measures were significantly improved (p<0.01).
Conclusion
The proposed approach to align MRI time series enables more accurate quantitative studies of placental function by improving spatio-temporal alignment across placenta and fetal organs.
Keywords: Motion correction, signal non-uniformity, BOLD-MRI, Placental MRI, fetal MRI, hyperoxygenation
INTRODUCTION
Abnormalities in oxygen and nutrition transport from the placenta to the fetus are associated with perinatal mortality and morbidity (1). Quantitative analysis of placental function has the potential to facilitate decision-making for early delivery when placental function is failing or quantify placental response to novel therapies and therefore to ultimately decrease mortality and morbidity. Blood-oxygen-level dependent magnetic resonance imaging (BOLD-MRI) with alternating maternal oxygenation has gained attention as a promising non-invasive method to monitor placental function in vivo (2, 3). Accurate quantification of signal changes with maternal hyperoxia is difficult as in-utero BOLD-MRI scans contain many motion artifacts due to unpredictable fetal movements, uterine contractions and maternal respiration as well as signal non-uniformities caused by motion and field inhomogeneity (4, 5). Thus despite the potential of BOLD-MRI, obtaining quantitative metrics of placental function remains challenging.
Current methods focus primarily on mitigating fetal head motion but do not attempt to correct for placental motion (6-12). In the first placental BOLD-MRI studies, the analysis was performed in manually delineated regions of interest without motion or bias field correction. These studies highlighted the need for motion mitigation and for bias field correction to improve the accuracy of signal intensity change estimates in the placenta and in fetal organs (e.g., fetal brain) with maternal hyperoxia. More recently, You et al. (13) proposed a rigid body motion correction algorithm to temporally align placenta and fetal brain. This approach aimed to mitigate the rotational and translational motion between the temporal volume series, but not the motion across the slices within the volume. Moreover, rigid body motion correction is inadequate for accurate alignment of the placenta as it is a deformable organ.
The purpose of this study is to demonstrate a computational approach to estimate and minimize (i) signal non-uniformities, (ii) motion artifacts within each volume due to the interleaved slice acquisition, and (iii) motion artifacts between consecutive volumes in BOLD-MRI time series to enable more accurate temporal characterization of hemoglobin oxygenation changes in the placenta and fetal organs.
MATERIALS AND METHOD
Data Acquisition
Data were acquired with a single shot gradient echo echo-planar imaging (EPI) with repetition time (TR) between 5.8 sec and 8 sec, echo time (TE) of 32-36 msec, flip angle (FA) of 90°, slice thickness of 3 mm and in-plane resolution of 3×3 mm2 with slices acquired in an interleaved order. The number of slices and slice position were adjusted to cover the entire uterus. The number of volume in the time series varied from 220 to 340, adjusted to result in a total acquisition time of 30 minutes. Scans were performed on a 3T Skyra scanner (Siemens Healthcare, Erlangen, Germany) using an 18-channel body and a 12-channel spine receive array.
Four singletons and six twin pregnancies between 26 and 34 weeks of gestational age were scanned. Informed consent was obtained in all cases. The maternal oxygenation protocol was designed to include three consecutive ten minutes episodes: an initial normoxic episode (21% O2), a hyperoxic episode (100% O2, 15 L/min), and a final normoxic episode (21% O2). The oxygen paradigm was designed in consultation with an anesthesiologist (AP) with experience in obstetrical anesthesia to ensure the safety of the mother and the fetus, and was approved by our institutional review board. Oxygen was supplied via non-rebreathing facial mask during BOLD acquisition. The facial mask was applied without interfering with the BOLD MRI scan while the pregnant woman remained in the magnet bore. Subjects were lying on their left side in the scanner.
Computational Analysis
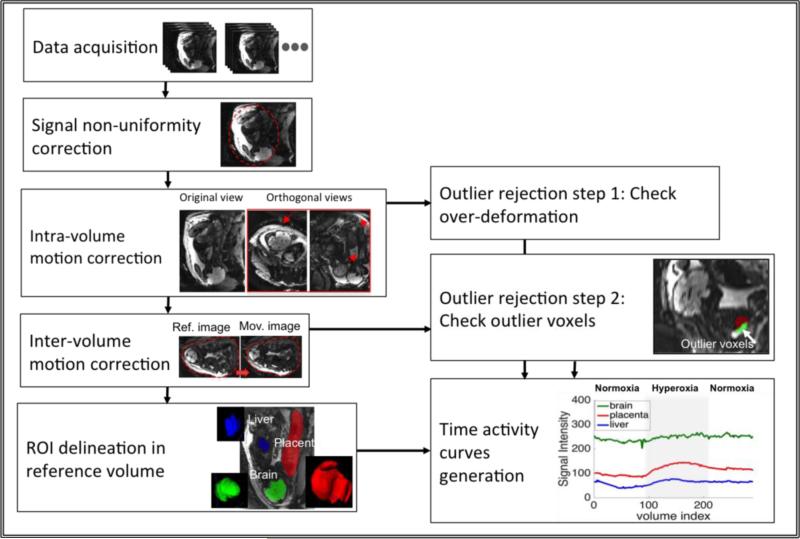
In this section, we define each computational analysis step in detail and provide implementation details of the algorithms. Figure 1 illustrates the proposed analysis pipeline.
Figure 1.
The steps of the proposed method to estimate and eliminate signal non-uniformities and motion artifacts.
Signal Non-Uniformity Correction
We adapt the broadly used N4ITK algorithm (14) for signal non-uniformity correction in the BOLD-MRI series. The method was originally developed for single MRI images. N4ITK estimates a smooth multiplicative field, represented in a B-spline basis, to maximize the high frequency content of the tissue intensity distribution (14, 15).
We generate a single 3D bias field estimate from an average of the MRI volumes in the resting state (i.e., the first 10 minute epoch). To prevent volumes with dramatic artifacts from unduly influencing the average, we compare each volume with the entire series using mean square error (MSE):
where Vi is volume i in the series, n is the number of volumes in the first epoch, and Ωu is the uterus ROI. The uterus mask was delineated manually on the average volume. Volumes with high MSE (e.g., with values larger than half of the observed maximum MSE) were excluded from averaging. To remove the effects of the bias field, each volume in the series was divided by the same 3D bias field estimate.
Intra-Volume Motion Correction
The interleaved acquisition of 2D slices results in motion artifacts between the sets of odd and even slices. To alleviate this motion artifact, we followed the approach of Guyader et al. (16). In particular, we separated each volume into two sub-volumes that consisted of only even slices and only odd slices with doubled slice thickness. We then non-rigidly registered the sub-volumes and re-combined them via voxel-wise averaging to generate the resulting volume at the original resolution.
Inter-Volume Motion Correction
For motion correction across different volumes, we employed a pair-wise registration method. We selected a reference volume to minimize the MSE score between the reference volume and the rest of the volumes in the series. We treated the reference volume as fixed image If(x) with image space ΩF. Each volume in the series was treated as moving image Im(x) with image space ΩM. The registration procedure estimated a transformation T: ΩF → ΩM that maximized intensity-based similarity between Im(T(x)) and If(x).
For initialization, we estimated a six degrees of freedom rigid transformation as a mapping from the reference volume to the moving image within the mask that included the whole uterus, i.e., T: ΩF ⊂ Ωu → ΩM ⊂ Ωu. The uterus mask was delineated manually on the average volume, i.e., the average of all volumes in the time series after intra-volume motion correction.
To compensate for motion of the deformable placenta and fetal liver in the time series, we estimated a non-rigid body transformation of the respective volumes following the initial rigid body alignment. The resulting transformation T(x) = TNR(TRO(x)) was constructed as a composition of the initial rigid registration TRO and the non-rigid transformation TNR.
To compensate for motion of the brain, which is more rigid, we estimated a second rigid body transformation within a brain-specific mask following the initial rigid body alignment. The brain mask was delineated manually on the average volume.
Outlier Rejection
When severe motion occurs, the proposed motion correction algorithm may fail for some volumes. To detect these volumes, we performed a two-phase outlier rejection step. Since placenta, fetal liver and fetal brain might move and deform differently, outlier volumes were selected for each organ separately.
In the first step, we quantified the deformations within each voxel in the ROI by computing the determinant of the Jacobian of transformations det(J(x)) after motion correction within the volume. All volumes that contained voxels with negative determinants were rejected to avoid including topological errors in subsequent analysis. To account for differences between the elasticity of different tissues, over-compression and over-expansion in a voxel were evaluated with different thresholds (τc; τe). Volumes that contained voxels with over-compression or over-expansion (i.e., det (J(x)) < τc or det(J(x)) > τe) were rejected. Thresholds τc and τe were chosen empirically based on the structural changes in a subset of the data.
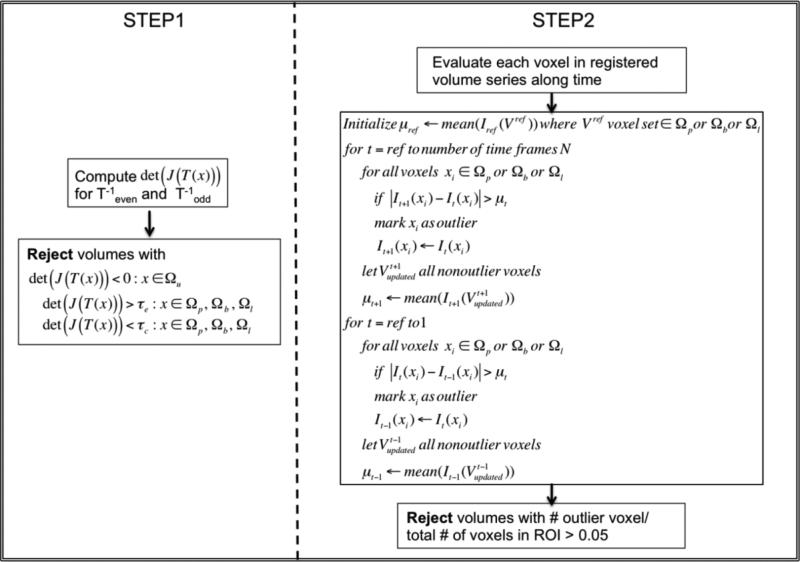
The second outlier rejection step evaluated each voxel in the ROI by using the mean signal intensity μt for that ROI at time t and the magnitude of temporal signal change ΔIt(x) = |It+1(x) – It(x)|. Any voxel x whose temporal signal change ΔIt(x) at time t exceeded μt was labeled as an outlier. For the next time point (e.g., time t + 1), the intensity of a voxel labeled as an outlier (e.g., at time t) was replaced with its value at the last time point at which the voxel was not labeled as an outlier, and the mean signal intensity μt+1 at that time point was recalculated using the updated signal intensity values. This process was initiated at the reference frame selected for inter-volume motion correction and ran outwards towards the beginning and the end of the series. Volumes with more than 5% outlier voxels in an ROI were rejected. Figure 2 illustrates the outlier rejection procedure.
Figure 2.
Outlier rejection procedure. Ωu, Ωp,Ωb and Ωl indicate uterus ROI, placental ROI, fetal brain ROI and fetal liver ROI, respectively.
BOLD Signal Change Visualization
To extract ROI-specific temporal signals, we delineated manually the placenta, fetal livers and fetal brains in the reference frame. The segmentation labels were then used in all aligned volumes to compute the average ROI signals. In Figure 1 ROIs used in the analysis are illustrated.
We generated the time activity curves as R2* change for the placenta and fetal organs:
where I is the signal intensity, Ib is the average signal intensity computed for the first normoxia epoch, and TE is the echo time.
Implementation Details
N4ITK bias correction implementation in the ANTS software package (17) was used with a mask covering the whole uterus, with default B-Spline fitting parameters, and a shrink factor of three.
Image registration software package Elastix (18) was used for all motion correction steps in the pipeline. We employed 3D B-spline transformation model with a three level multi-resolution strategy and the maximum number of 2500 iterations per resolution. The grid size for B-spline transformation and gradient descent optimization parameters were determined in a subset of volumes by visual inspection of the alignment. Mutual information was used due to its known suitability for aligning images with different intensity distributions (6), which is critical for functional data collected during maternal oxygenation paradigm as this can cause marked changes in image intensity.
We performed all manual delineations of uterus, liver and brain masks on the average volume in ITK-SNAP visualization package (19).
Outlier rejection and ROI-specific signal extraction were implemented in MATLAB 8.6.0 (The MathWorks, Inc., Natick, MA).
Performance Evaluation
Signal Non-Uniformity Correction
We used four subjects from the study to evaluate our solution (which we call 3D N4ITK) relative to the baseline method that generates a 4D bias field estimate for the spatio-temporal volume series as suggested in (13). Each volume in the original time series was divided by the corresponding volume in the estimated 4D bias field. We refer to this approach as 4D N4ITK. As an additional baseline approach, we also generated a 4D set of bias field estimates by applying the original N4ITK algorithm to each volume separately. We will refer to this method as Independent 3D N4ITK. Although these particular baseline methods are not entirely appropriate for our application as they risk capturing some of the signal change during hyperoxia as part of the estimated bias field, we include them for completeness.
Initially, we evaluated how the bias field changed over time by examining the normalized cross-correlation between the bias field estimates for each frame with that for the first frame. To compare the effect of different methods on the overall signal change we evaluated the area under the curve (AUC) for the entire time course to characterize the global behavior of the ROI-specific average signal for the placentae, fetal livers and fetal brains. To compute the signal change for the entire time course, manually delineated masks on the reference volume were warped to every volume of the time series using the inverse of the transformation obtained by the registration. These masks were used to compute the averaged signal change over time in the original data and the bias corrected data.
Motion Correction
The baseline rigid motion correction approach taken in (13) was applied to the data sets for comparison.
To evaluate the quality of alignment, we examined volume overlap between manual ROI delineations in a subset of frames and the delineations obtained through propagation of the ROIs from the reference frame. We employed Dice score (20) to quantify volume overlap:
where A is the manually delineated ROI and B is the automatically estimated ROI. We also computed the Hausdorff distance (21):
to evaluate the distance between the manual and the automatically obtained ROI boundaries.
Outlier Rejection
Registered images and the resulting deformation maps were visually examined in ITK-SNAP to determine if unreasonable deformations were present. After visual inspection of local expansion and compression, thresholds (τc; τe) for over-compression and over-expansion for the placenta, fetal liver and fetal brain were set to (0.5; 1.5), (0.7; 1.3), (0.8; 1.2) respectively.
In the second step of outlier rejection, outlier voxels were quantified and volumes with more than 5% outlier voxels in an ROI were rejected. We evaluated the number of outliers detected for the proposed motion correction data, the original images, and a baseline rigid motion correction method.
Finally, for voxel-wise evaluation of different motion correction pipelines, we examined the variance volumes for the first normoxia epoch and the mean volumes for overall time.
Biological Plausibility
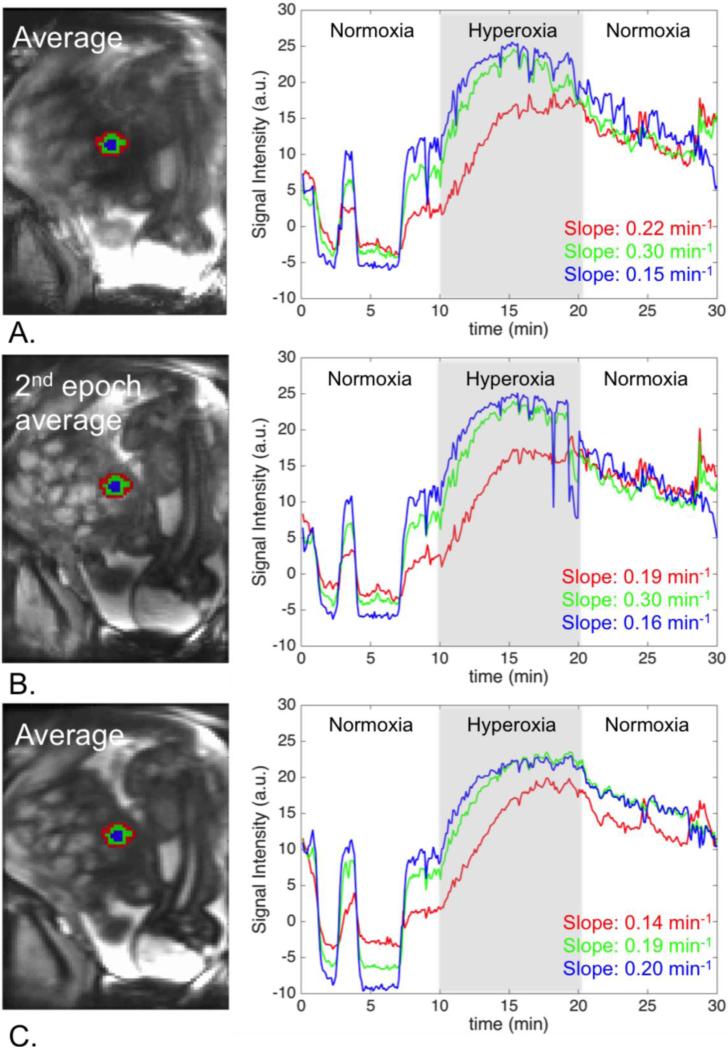
As there is no reference standard for in vivo placental function, we explored regional slopes of signal increase in three regions of a single cotyledon. We hypothesized that central cotyledon regions would have more rapid increases in oxygenation and therefore signal intensity compared to peripheral regions. This hypothesis was based on the known cotyledon anatomy where highly oxygenated maternal blood is known to enter vascular lakes more centrally. Cotyledon anatomy was defined on the reference image and propagated to all volumes in the motion corrected time series. To examine the rate of oxygenation change in each region, we computed the slope of the signal increase during the first two minutes of the hyperoxia.
Statistical Analysis
All data are expressed as mean ± SD (standard deviation). We employed a paired Student's t-test for the comparison of different approaches at each step with the original data and with each other. All analyses were performed using Prism 6.0g (GraphPad Software Inc.). P < 0.05 was considered statistically significant.
RESULTS
Signal Non-Uniformity Correction
We first considered the estimates obtained through the baseline method 4D N4ITK and observed that all 3D bias field volumes were highly similar to that estimated for the first volume in the series (correlation of 0.974±0.018), as illustrated in Figure 3a. Figure 3b reports the difference (NSSD) between the bias field estimate generated by 4D N4ITK for the first frame and the bias field estimated by Independent 3D N4ITK applied to each volume separately for one subject in the study. We observe substantial fluctuations in NSSD between the bias field estimated for the first volume and the estimates for the subsequent volumes using Independent 3D N4ITK. Since it is unlikely that the true bias field changes so dramatically over the time course of the scan, we anticipate this fluctuation would adversely affect the quality of the resulting BOLD signal estimates. We therefore decided against independent signal non-uniformity correction.
Figure 3.
Signal non-uniformity correction based on the baseline 4D N4ITK method. (a) Correlation of the bias field estimates with that for first frame for four different subjects. (b) Normalized sum of square difference between the estimated bias field for each volume and that for the first volume for 4D N4ITK (solid green) and for Independent 3D N4ITK (dotted red).
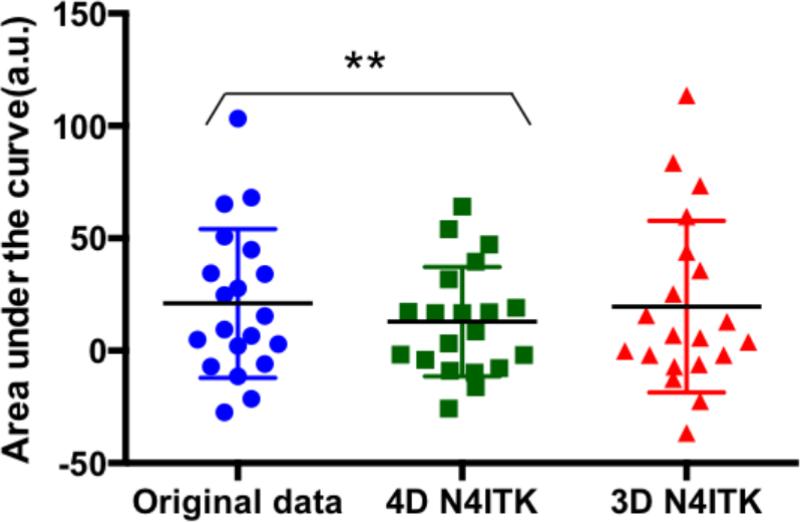
After 4D-N4ITK correction we observed a significant decrease (p=0.0045) in the area under the curve. No significant change (p=0.7268) was observed after 3D N4ITK correction (Figure 4). Since the bias correction algorithm does not have the prior constraints on the intensity changes due to the maternal oxygenation in second and third epochs of the oxygenation paradigm, we conclude that 4D N4ITK approach attempts to correct the signal non-uniformities caused by the oxygenation change, which is undesirable. As a result of this finding, we proceed with the 3D N4ITK method that estimates a single bias field map from an average of the MRI volumes in the resting state and employs it for signal non-uniformity correction of all volumes in the series.
Figure 4.
Area under the curve computed using the time activity curves generated for the whole placenta, fetal brain and liver after applying different signal non-uniformity correction methods. Paired t-tests are used to compare the results, ** indicates p < 0.01.
Motion Correction and Outlier Rejection
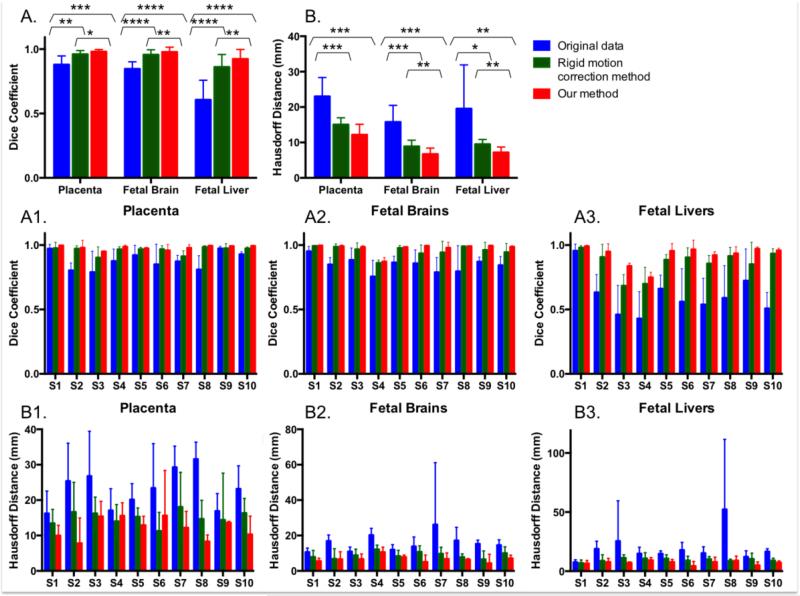
Figure 5 reports statistics of volume overlap and distance between boundaries of manual segmentations in the reference volume and those in other volumes after motion correction for the placenta, fetal brain and fetal liver. The rigid motion correction method improved the volume overlap from 0.879±0.067 to 0.960±0.028 in the placenta (p=0.0029), from 0.846±0.055 to 0.956±0.039 in the fetal brain (p<0.0001), and from 0.606±0.152 to 0.861±0.097 in the fetal liver (p<0.0001). Incorporating non-rigid B-Spline transformations increased it further to 0.981±0.016 (p=0.0005), 0.977±0.037 (p<0.0001), and 0.923±0.074 (p<0.0001) in the placenta, fetal brain and fetal liver, respectively. In addition, the alignment in the placenta, fetal brain and fetal liver after following non-rigid B-spline transformations was significantly improved compared to using the rigid motion correction approach (p=0.0158, p=0.0065, and p=0.0019, respectively). The mean distance between outlines decreased from 23.005±5.361 mm to 15.050±1.919 mm for the rigid motion correction method (p=0.0005) and further to 12.183±2.961 mm for non-rigid transformations (p=0.0008) in the placenta. Fetal brain and fetal liver ROIs exhibit similar improvements in alignment with both the rigid motion correction method (p=0.0009 and p=0.0318, respectively) and our approach (p=0.0001 and p=0.0092, respectively). Additionally, the distance between outlines in the fetal brain and fetal liver decreased after using non-rigid B-Spline transformations compared to the rigid motion correction approach (p=0.0014 and p=0.0033, respectively).
Figure 5.
Motion correction results for the placenta, fetal brain and fetal liver in 10 different subjects. Volume overlap, as measured by the Dice coefficient, and the distance between the boundaries, as captured by the Hausdorff distance, are reported in A and B for overall volumes and in A1-3 and B1-3 for individual subjects. Paired t-tests are used to compare the methods for each organ and reported in A and B: *p < 0.05, **p < 0.01, ***p < 0.001, ****p < 0.0001.
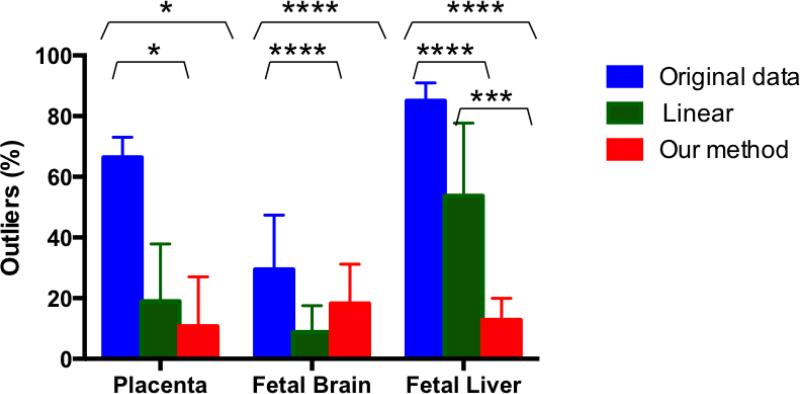
Figure 6 summarizes the outlier statistics. Both our method and the rigid motion correction approach significantly decreased the percentage of the outliers for placenta (p=0.0305 and p=0.0173, respectively), fetal brain (p=0.0104 and p=0.001, respectively), and fetal liver (p<0.0001 and p<0.0001, respectively). However, the percentage of outliers for fetal liver significantly decreased with our method compared to the rigid motion correction approach (p=0.0002). The fetal brains are characterized by the highest overall percentage of the outlier volumes excluded from the analysis after our method (13.70±12.47 %). These were mostly excluded due to the over-deformation after intra-volume motion correction step.
Figure 6.
Overall percentage of rejected outlier volumes in the analysis of the placenta, fetal brain, and fetal liver in the original data, after applying the rigid motion correction method and our method.
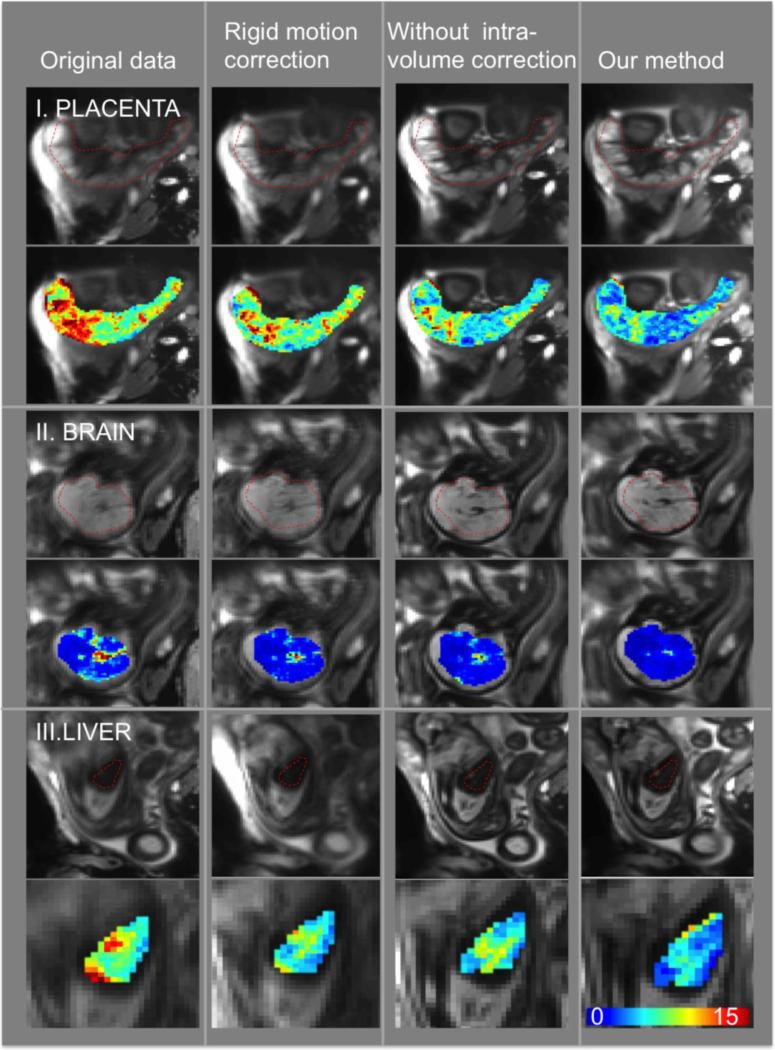
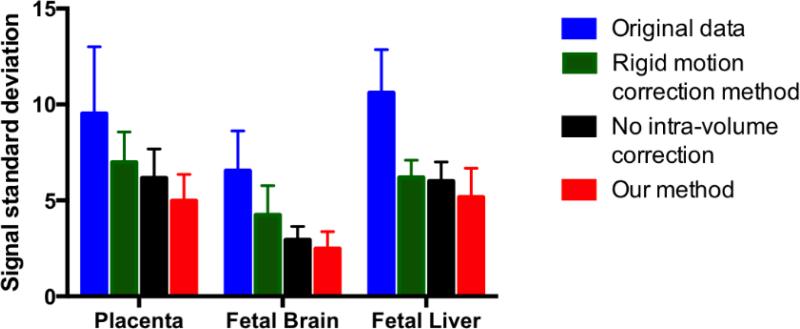
Figure 7 illustrates the intensity mean and standard deviation during the first normoxia epoch after applying different motion correction methods in one subject. We observe that signal fluctuations are reduced substantially when using non-rigid motion correction. In addition, the improvement in image registration can be appreciated by observing the increasing sharpness of the placenta, brain and liver from left to right of the figure as different algorithms are applied. As summarized in Figure 8, the standard deviation of the signal in the placentae, fetal brain and liver decreased significantly after applying the proposed analysis pipeline compared to the baseline rigid motion correction method (p=0.0006 for the placenta, p=0.0001 for the brain, p=0.0259 for the liver). The same figure highlights the importance of intra-volume motion correction step in the pipeline. In particular, the voxel-wise standard deviation of the signal decreases significantly after applying the proposed analysis pipeline compared to the pipeline without intra-volume correction step, for placenta, fetal brain and liver (p<0.0001, p=0.0016, and p=0.0046, respectively). These comparisons were performed after removing the outlier volumes (See supplementary movies for the comparison of the original and registered brain, liver and placenta data).
Figure7.
Example slice in the average volume (first row) and voxel-wise standard deviation of the signal during the first normoxia period (second row) for placenta, fetal brain and liver. The columns correspond to the original data, rigid motion correction, non-rigid inter-volume motion correction without intra-volume motion correction and our method that performs intra-volume motion correction followed by a rigid and non-rigid inter-volume motion correction.
Figure 8.
Standard deviation of the average signal during the first normoxia epoch in the placenta, fetal brain and fetal liver to compare the measures in the original data, after rigid motion correction, after inter-volume motion correction without intra-volume motion correction, and after our pipeline.
Biological Plausibility
Figure 9 illustrates the importance of the accurate regional alignment between time frames for the analysis of the tissue response to the oxygenation in a specific region. When we used the time activity curves generated after the proposed pipeline, the rate of oxygenation change increased while moving to the center, as expected. This finding was not apparent when applying rigid registration approach.
Figure 9.
Regional analysis of signal change: A. Original data, B. After rigid motion correction, C. Our method. Signal change over time is reported for a peripheral region (red), a middle region (green), and a central region (blue) in a single cotyledon. Our method produces the expected gradual increase in the signal change rate, which would have been missed if the baseline alignment method had been used.
DISCUSSION
We describe a computational analysis pipeline to minimize signal non-uniformities and to mitigate intra-volume and inter-volume motion artifacts. Our goal is to improve the quantitative accuracy of placental and fetal organ signal change due to maternal hyperoxygenation. We demonstrated significant decreases in the signal fluctuations within the first normoxia epoch, improved anatomical alignment of important ROIs across volumes in the time series and obtained biologically plausible data from cotyledon regions.
For signal non-uniformity correction, we investigated the widely used 3D and 4D N4ITK methods when applied to MRI time series analysis. Our results suggested that when 4D N4ITK method was used, the averaged signal within ROIs during the hyperoxia episode was suppressed. This observation raised concern about potential distortion of the signal change with hyperoxia if the 4D N4ITK approach was used. Therefore, we proceeded with the 3D N4ITK approach that estimates a single bias field map from an average of the MRI volumes in the resting state and employs it for signal non-uniformity correction of all volumes in the series. Estimating separate bias field correction maps for each volume in a single data set by modeling the signal intensity change due to maternal hyperoxia in the uterus represents an interesting future research direction.
Intra-volume motion was corrected by following an approach based on the non-rigid body registration of sub-volumes formed with even and odd slices (16), by assuming that fetal and maternal motions are non-trivial between consecutive slices. While this method ignores through-plane motion between even slices and odd slices, intra-volume motion correction substantially decreased the signal fluctuations. Future acceleration in image acquisition is needed to minimize through-plane motion.
We evaluated the proposed inter-volume motion correction method by quantifying the alignment of ROI delineations. We demonstrated improved anatomical alignment over a baseline rigid motion correction algorithm (13).
In intra-volume motion correction steps, non-rigid transformations were applied to the whole uterus ROI with the parameters adjusted for deformable tissues. In order to eliminate the effect of over-deformation, we adjusted thresholds in the outlier detection procedure. In particular, rigid body motion can be assumed for brain so lower thresholds were set for brain where lower expansion or compression is expected when non-rigid body motion correction is applied. While the fraction of outliers for brain after our method is higher than the rigid motion correction approach, after the outlier rejection step, the standard deviation of the brain signal along first normoxia epoch is significantly lower compared to the baseline rigid motion correction approach (13), which can be critical for the analysis of the brain response to the oxygenation change. Our results for fetal brain were not compared with the more sophisticated approaches previously proposed in (11, 12). In the future, these methods can be added to our algorithm to optimally align different organs of interest.
Our study has several limitations. Firstly, not having a reference standard for in vivo placental function limits the evaluation of our signal non-uniformity and motion correction methods. Secondly, the approach was tested in a limited number of subjects. Another limitation is that the processing time of our proposed method is an order of magnitude slower than the approach proposed in (13). Computational efficiency was not the main focus of this study, and will be addressed by future work. Lastly, the proposed approach employs the same B-spline transformation parameters for all deformable tissues in intra-volume and inter-volume motion correction steps. Future research will focus on variable deformation regularization across regions to further improve the accuracy of estimated deformations.
In conclusion, this work represents the first step towards generating robust correspondences across volumes in MRI time series. Such correspondences will enable region-based analysis of hemodynamics in BOLD MRI time series acquired during a maternal oxygen challenge as well as resting state fMRI and many other applications of dynamic MRI imaging of function and physiology.
Supplementary Material
Acknowledgements
We would like to thank Dr. Arvind Palanisamy, Dr. Clare Tempany, Dr. Carol Barnewolt, and Dr. Judy Estroff.
Grant Support: This project is supported by NIH U01 HD087211, NIH R01 EB017337 and the Consejeria de Educacion, Juventud y Deporte de la Comunidad de Madrid (Spain) through the Madrid-MIT M+Vision Consortium.
References
- 1.Gardosi J, Madurasinghe V, Williams M, Malik A, Francis A. Maternal and fetal risk factors for stillbirth: population based study. BMI. 2013 Jan 24;346:f108. doi: 10.1136/bmj.f108. [DOI] [PMC free article] [PubMed] [Google Scholar]
- 2.Sorensen A, Peters D, Fründ E, Lingman G, Christiansen O, Uldbjerg N. Changes in human placental oxygenation during maternal hyperoxia estimated by blood oxygen leveldependent magnetic resonance imaging (BOLD MRI). Ultrasound in Obstetrics & Gynecology. 2013;42:310–4. doi: 10.1002/uog.12395. [DOI] [PubMed] [Google Scholar]
- 3.Sorensen A, Peters D, Simonsen C, Pedersen M, StausbolGron B, Christiansen OB, Lingman G, Uldbjerg N. Changes in human fetal oxygenation during maternal hyperoxia as estimated by BOLD MRI. Prenatal diagnosis. 2013;33:141–5. doi: 10.1002/pd.4025. [DOI] [PubMed] [Google Scholar]
- 4.Studholme C. Mapping fetal brain development in utero using MRI: the big bang of brain mapping. Annual review of biomedical engineering. 2011;13:345. doi: 10.1146/annurev-bioeng-071910-124654. [DOI] [PMC free article] [PubMed] [Google Scholar]
- 5.Malamateniou C, Malik SJ, Counsell SJ, Allsop JM, McGuinness AK, Hayat T, Broadhouse K, Nunes RG, Ederies AM, Hajnal JV, Rutherford MA. Motion-compensation techniques in neonatal and fetal MR imaging. American Journal of Neuroradiology. 2013;34:1124–36. doi: 10.3174/ajnr.A3128. [DOI] [PMC free article] [PubMed] [Google Scholar]
- 6.Rousseau F, Glenn OA, Iordanova B, Rodriguez-Carranza C, Vigneron DB, Barkovich JA, Studholme C. Registration-based approach for reconstruction of high-resolution in utero fetal MR brain images. Academic radiology. 2006;13:1072–81. doi: 10.1016/j.acra.2006.05.003. [DOI] [PubMed] [Google Scholar]
- 7.Jiang S, Xue H, Glover A, Rutherford M, Rueckert D, Hajnal JV. MRI of moving subjects using multislice snapshot images with volume reconstruction (SVR): application to fetal, neonatal, and adult brain studies. Medical Imaging, IEEE Transactions on. 2007;26:967–80. doi: 10.1109/TMI.2007.895456. [DOI] [PubMed] [Google Scholar]
- 8.Kim K, Habas PA, Rajagopalan V, Scott JA, Corbett-Detig JM, Rousseau F, Barkovich AJ, Glenn OA, Studholme C. Bias fıeld inconsistency correction of motion-scattered multislice MRI for improved 3D image reconstruction. Medical Imaging, IEEE Transactions on. 2011;30:1704–12. doi: 10.1109/TMI.2011.2143724. [DOI] [PMC free article] [PubMed] [Google Scholar]
- 9.Seshamani S, Fogtmann M, Cheng X, Thomason M, Gatenby C, Studholme C. Cascaded slice to volume registration for moving fetal FMRI. Biomedical Imaging (ISBI), 2013 IEEE 10th International Symposium on 2013. :796–799. [Google Scholar]
- 10.McDaniel P, Gagoski B, Tisdall MD, Kouwe AJW, van der, Grant PE, Wald LL, Adalsteinsson E. Quantifıation of Fetal Motion Tracked with Volumetric Navigator MRI Acquisitions.. Proceedings of the 23rd Annual Meeting of ISMRM; Toronto, Ontario, Canada. 2015. [Google Scholar]
- 11.Ferrazzi G, Murgasova MK, Arichi T, Malamateniou C, Fox MJ, Makropoulos A, Allsop J, Rutherford M, Malik S, Aljabar P, Hajnal JV. Resting State fMRI in the moving fetus: a robust framework for motion, bias field and spin history correction. Neuroimage. 2014;101:555–68. doi: 10.1016/j.neuroimage.2014.06.074. [DOI] [PubMed] [Google Scholar]
- 12.Seshamani S, Cheng X, Fogtmann M, Thomason ME, Studholme C. A method for handling intensity inhomogenieties in fMRI sequences of moving anatomy of the early developing brain. Medical image analysis. 2014;18:285–300. doi: 10.1016/j.media.2013.10.011. [DOI] [PMC free article] [PubMed] [Google Scholar]
- 13.You W, Evangelou IE, Zun Z, Andescavage N, Limperopoulos C. Robust preprocessing for stimulus-based functional MRI of the moving fetus. Journal of Medical Imaging. 2016 30 Apr;3(2):026001. doi: 10.1117/1.JMI.3.2.026001. [DOI] [PMC free article] [PubMed] [Google Scholar]
- 14.Tustison NJ, Avants BB, Cook PA, Zheng Y, Egan A, Yushkevich PA, Gee JC. N4ITK: improved N3 bias correction. Medical Imaging, IEEE Transactions on. 2010;29:1310–20. doi: 10.1109/TMI.2010.2046908. [DOI] [PMC free article] [PubMed] [Google Scholar]
- 15.Sled JG, Zijdenbos AP, Evans AC. A nonparametric method for automatic correction of intensity nonuniformity in MRI data. Medical Imaging, IEEE Transactions on. 1998;17:87–97. doi: 10.1109/42.668698. [DOI] [PubMed] [Google Scholar]
- 16.Guyader JM, Bernardin L, Douglas NH, Poot DH, Niessen WJ, Klein S. Influence of image registration on apparent diffusion coefficient images computed from freebreathing diffusion MR images of the abdomen. Journal of Magnetic Resonance Imaging. 2015;42:315–30. doi: 10.1002/jmri.24792. [DOI] [PubMed] [Google Scholar]
- 17.Avants BB, Tustison N, Song G. Advanced normalization tools (ANTS). Insight J. 2009;2:1–35. [Google Scholar]
- 18.Klein S, Staring M, Murphy K, Viergever MA, Pluim JP. Elastix: a toolbox for intensity-based medical image registration. Medical Imaging, IEEE Transactions on. 2010;29:196–205. doi: 10.1109/TMI.2009.2035616. [DOI] [PubMed] [Google Scholar]
- 19.Yushkevich PA, Piven J, Hazlett HC, Smith RG, Ho S, Gee JC, Gerig G. User-guided 3D active contour segmentation of anatomical structures: significantly improved efficiency and reliability. Neuroimage. 2006;31:1116–28. doi: 10.1016/j.neuroimage.2006.01.015. [DOI] [PubMed] [Google Scholar]
- 20.Dice LR. Measures of the amount of ecologic association between species. Ecology. 1945;26:297–302. [Google Scholar]
- 21.Huttenlocher DP, Klanderman GA, Rucklidge WJ. Comparing images using the Hausdorff distance. IEEE Transactions on pattern analysis and machine intelligence. 1993 Sep;15(9):850–63. [Google Scholar]
Associated Data
This section collects any data citations, data availability statements, or supplementary materials included in this article.


