Abstract
Huntington’s disease is characterized by a complex and heterogeneous pathogenic profile. Studies have shown that disturbance in lipid homeostasis may represent a critical determinant in the progression of several neurodegenerative disorders. The recognition of perturbed lipid metabolism is only recently becoming evident in HD. In order to provide more insight into the nature of such a perturbation and into the effect its modulation may have in HD pathology, we investigated the metabolism of Sphingosine-1-phosphate (S1P), one of the most important bioactive lipids, in both animal models and patient samples. Here, we demonstrated that S1P metabolism is significantly disrupted in HD even at early stage of the disease and importantly, we revealed that such a dysfunction represents a common denominator among multiple disease models ranging from cells to humans through mouse models. Interestingly, the in vitro anti-apoptotic and the pro-survival actions seen after modulation of S1P-metabolizing enzymes allows this axis to emerge as a new druggable target and unfolds its promising therapeutic potential for the development of more effective and targeted interventions against this incurable condition.
Introduction
Huntington’s disease (HD), the most common dominantly inherited neurodegenerative disorder affecting an estimated 3 to 7 per 100,000 people, is associated with progressive motor, cognitive and behavioral disturbances1. The disease-causing mutation is an expansion of CAG trinucleotide repeats (>36 repeats) within the HTT gene encoding a polyglutamine (polyQ) stretch in the N-terminal region of Huntingtin (Htt), a ubiquitous protein whose function is still unclear2. Expansion of the polyQ stretch endows mutant Htt (mHtt) with toxic properties and results in a range of cellular abnormalities3 including aberrant metabolism of brain lipids4–9.
Sphingolipids represent the major lipid component of biological membranes and regulate a number of important cellular functions10. Ceramide (Cer), sphingosine (Sph) and its phosphorylated form Sphingosine-1-phosphate (S1P) are key intermediates in the sphingolipid metabolism10,11 (Fig. 1) and thus tightly regulated. S1P is found both within the intracellular and extracellular compartments12–14 and outside the cell, it acts as a high affinity agonist at five known G protein-coupled receptors, which are highly expressed in the brain12,15.
Figure 1.
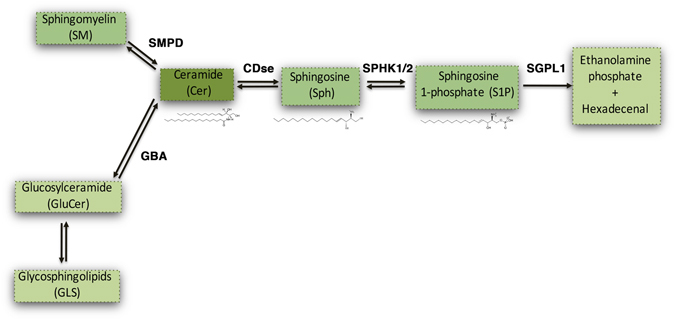
Simplified sphingolipid metabolic pathway. Ceramide (Cer) is generated through the degradation of either Sphingomyelin (SM) or Glycosphingolipids(GLS) by Sphingomyelin Phosphodiesterase (SMPD) and GlucosylCeramidase (GBA) respectively. Cer is subsequently metabolized by Ceramidase (CDse) to generate Sphingosine (Sph), which in turn produces Sphingosine-1-Phosphate (S1P) through phosphorylation by Sphingosine Kinase-1 and Sphingosine Kinase-2 (SPHK1/2). All these reactions are reversible. S1P can be catabolized into hexadecenal and phospho-ethanolamine by S1P Lyase (SGPL1).
S1P metabolism is a complex process and normally implicates a number of different enzymes (see Fig. 1). Sphingosine kinase 1 and 2 (SPHK1/2) catalyze the phosphorylation of Sph to generate S1P16. Under normal conditions, SPHK1 activity is associated with cell survival17,18, while SPHK2 has a more complex effect – coordinating a number of intracellular pathways such that it leads to loss of cell growth and apoptosis when altered18–22. On the other hand, the degradative enzyme Sphingosine-1-phosphate Lyase1 (SGPL1) plays a key role in maintaining the right balance between S1P levels and other sphingolipid intermediates all of which affect cell growth, proliferation and cell death23. Indeed, uncontrolled up-regulation of SGPL1 results in a reduced availability of the bioactive lipid and a concomitant release of hexadecenal whose accumulation is cytotoxic in vitro24. Up-regulation of SGPL1 along with reduced levels of SPHK1 and subsequent decreased content of S1P has been found to be also associated with neurodegeneration in Alzheimer’s disease (AD)25–27.
Abnormal levels of both SPHK1 and 2 have been, indeed, described in experimental models of Parkinson’s disease (PD)28. Expression of SPHK1 has been reported to be significantly decremented also in a mouse model of HD29. Whether an imbalance in the S1P-metabolizing enzymes may further contribute to the worsening of the disease is still unclear, however, recent evidence demonstrates that either overexpression of SPHK1 or inhibition of SPHK2 is beneficial in an in vitro model of the disease30,31. Further support for the importance of this pathway to HD comes from the evidence that there is a reduced content of S1P in HD mouse striatal-derived cell lines (STHdh)32. Along this line, previous findings from our group and others have shown that administration of sphingolipids or sphingomimetic molecules mitigates the toxic effect of mHtt both in in vitro and in vivo33–35, all of which adds further weight to the hypothesis that aberrant sphingolipid metabolism is a key feature of the disease.
In summary, there is clear evidence for alteration of the sphingolipid metabolism in AD and PD36–39 but with only limited evidence to suggest this may also be the case in HD.
We therefore sought to further investigate whether deregulated metabolism of these lipids is a critical abnormality in HD using both animal models and patient samples. We report not only that such abnormalities are found in all cases and importantly early in the disease, but that pharmacological interventions aimed at modulating the activity of the sphingolipid metabolizing-enzymes may likely have disease-modifying effects in vivo.
Material and Methods
Human brain tissues
The “Cambridge Brain Bank” (Cambridge, UK) provided anonymous post-mortem brain samples (fresh frozen and paraffin-embedded tissues) from HD cases and healthy age-matched controls. All studies on human post-mortem brain tissues were approved by Neuromed Ethic Commitee (IRCCS Neuromed, RI 002012). The pathological severity of HD was scored according to the Vonsattel grading system40. Subjects’ clinical and genetic data are reported in Table 1. Total lysate preparation Tissues were homogenized in lysis buffer containing 20 mMTris, pH 7.4, 1% Nonidet P-40, 1 mM EDTA, 20 mMNaF, 2 mM Na3V04, and protease inhibitor mixture (Santa Cruz, Cat N. sc-29131) and sonicated with 2 × 10 s pulses. Immunohistochemistry. Deparaffinized striatal and cortical tissue sections were soaked in 3% hydrogen peroxide to block endogenous peroxidase activity, incubated for 15 min in boiling citric acid buffer (10 mM, pH 6.0) and allowed to cool down at room temperature for 20 minutes. Slides were then washed in TBS and incubated with goat serum for 1 hour at room temperature. Sections were then incubated with anti-SGPL1 antibody (1:50) (Santa Cruz, Cat. N. sc-67368) overnight at 4 °C. Slides were washed in TBS and then incubated with biotinylated anti-rabbit IgG secondary antibody (Vectors Laboratories, Cat. N. BA-1000) for 1 hour at room temperature followed by horseradish peroxidase streptavidin (Vectors Laboratories, Cat. N. SA-5004). 3,3′-Diaminobenzidine tetrachloride (DAB) (Sigma Aldrich, Cat. N. D4293-50SET) was used for visualization. Control staining was performed without any primary antibody.
Table 1.
Clinical and genetic data of human post-mortem brain tissues.
| Cases | Age | Gender | Vonsattel’ neuropathology grade | CAGs (normal/expanded) | |
|---|---|---|---|---|---|
| 1 | Healthy Control | 67 | M | CTRL | N/A |
| 2 | Healthy Control | 75 | M | CTRL | N/A |
| 3 | Healthy Control | 72 | M | CTRL | N/A |
| 4 | Manifest HD | 66 | M | III | 17/45 |
| 5 | Manifest HD | 73 | M | III | 21/45 |
| 6 | Manifest HD | 68 | M | IV | 19/45 |
Animal models
Mouse colonies were maintained in the animal facility at IRCCS Neuromed. All animal studies were performed in accordance with approved protocols by the IRCCS Neuromed Animal Care Review Board and by “Istituto Superiore di Sanità” (permit number: 1163/2015- PR) and were conducted according to EU Directive 2010/63/EU for animal experiments. All the analyses were performed on manifest early manifest (6 week old) and on manifest (11 week old) R6/2 and manifest (9 month old) YAC128 HD mice and age-matched wild-type (WT) littermates. R6/2 mouse model, overexpressing the exon 1 of the human HD gene (HTT) with more than 150 CAG-repeat-expansion41,42, is one of the best-characterized and the most widely used animal model which recapitulates many of the features of HD human pathology and frequently used in preclinical studies. Motor symptoms usually start at 6 weeks of age and progressively worsen over the weeks41,42. YAC128 mice represent another best-characterized animal model of HD, expressing the entire human HD gene (including promoter region) with 128 CAG repeats. Even YAC128 mice display an array of motor and neuropathological changes that largely recapitulate the human pathology43. Hyperkinesia begins at 3 months of age with progressive motor impairment appearing at 6 months of age.
Total lysate preparation
Mice were sacrificed by cervical dislocation and the entire brain regions (striatum and cortex) were dissected out, snap frozen in liquid N2 and pulverized in a mortar with a pestle and the lysate obtained as reported above.
Mass Spectrometry
Snap frozen brain tissues were transferred into glass tubes and stored at −80 °C until lipid extraction. Lipids were extracted using a modified Bligh and Dyer method. Briefly, brain tissues were homogenized in 2 mL CHCl3/MeOH (1:2, v/v) with 0.1% TFA containing internal standards. Then 600 µL of both chloroform and water were added with intermittent mixing for 30 sec. The samples were then centrifuged for 10 min at 3000 rpm at 4 °C. The organic extracts were divided into two equal parts. One part was evaporated under nitrogen stream and reconstituted in 100 µL MeOH/CHCl3 (9:1, v/v) for LCMS analysis of Sphingomyelins, Sphingolipid bases and their phosphate metabolites. The other part was fractionated by Silica Gel G (60-Å 230–400 Mesh ASTM; Sigma-Aldrich, Milan, Italy) column chromatography. Ceramides were eluted with 2 ml of CHCl3/MeOH (9:1, v/v), then hexosylceramides were eluted with 1 ml of CHCl3/MeOH (8:2, v/v). Both the fractions were pooled together and evaporated under nitrogen stream and dried pellets were reconstituted in 100 µl of MeOH/CHCl3 (9:1, v/v) and transferred to glass vials for LC/MS analyses. LC-MS/MS analyses of the samples were carried out on the Acquity UPLC system coupled with a Xevo TQ-MS triple-quadrupole mass spectrometer as previously described44.
Analysis of ceramide by immunohistochemistry
For analysis of ceramide, mice were decapitated and the entire brain removed and frozen in cool isopentane (−80 °C). Each brain was cut serially with a Jung CM1900 Cryostat (Leica Instruments, Germany) in 20 μm thick sections. Brain sections were incubated with anti-Ceramide (MID 15B4) (1:200) (Enzo, Cat. N. ALX-804-196; lot number: 06061610)45 over-night at 4 °C and then with biotinylated anti-mouse IgG secondary antibody (Vectors Laboratories, Cat. N. BA-2000) for 1 hour at room temperature followed by horseradish peroxidase streptavidin (Vectors Laboratories, Cat. N. SA-5004). 3,3′-Diaminobenzidine tetrachloride (DAB) (Sigma Aldrich, Cat. N. D4293-50SET) was used for detection.
Analysis of ceramide by Dot Blotting
After tissue lysis protein quantitation was first assessed by Bradford method. Next, to assure that equal amount of homogenate was analyzed, each sample tissue lysate was serially diluted and protein concentration was re-assessed by NanoDrop Spectrophotometer9. Fifty nanograms of total protein lysates, from HD and control mice were then spotted in quadruplicates on nitrocellulose membrane and, dot-blotting analysis was performed as previously reported9. Ceramides was detected with anti-ceramide (1:200) (Enzo, Cat. N. ALX-804-196; lot number: 06061610). A goat anti-mouse HRP-conjugated secondary antibody (1:5000) (Santa Cruz, Cat. N. sc-2005; lot number: B0813) was used. Ceramide spots were detected by ECL Prime (GE Healthcare) and quantitated with Quantity One (Bio-Rad Laboratories).
Chemicals
(2R, 3S, 4E)-N-methyl-5-(4′-pentylphenyl)-2-aminopent-4-ene-1,3-diol (SK1-I) (Enzo, Cat. N. BML-EI411); 2-acetyl-4-(tetrahydroxybutyl)-imidazole (THI) (Cayman, Cat. N. 13222), K145 (Sigma-Aldrich, Cat. N. SML1003-5MG), EMD567731 (Cayman, Cat. N. 567731), N,N-Dimethylsphingosine (DMS) (Enzo, Cat. N. BML-SL105) and K6PC-5 (NeoPharm, Korea) were dissolved according to the manufacturer’s instruction.
Cell models
Conditionally immortalized mouse striatal knock-in cells expressing endogenous levels of wild-type (STHdh7/7) or mHtt (STHdh111/111) were purchased from the Coriell Cell Repositories (Coriell Institute for Medical Research, Camden, NJ, USA) and maintained as previously described4. Lysate preparation. Cells were lysed in lysis buffer as reported above.
Human iPSC-derived neurons
Neurons were differentiated from previously published representative HD hiPSC lines, HD58-3 (58 CAG-repeat expansion), that have been validated to be pluripotent and exhibit cellular features consistent with HD46. Cortical glutamatergic differentiation was done using a 11day dual SMAD neural induction protocol, as previously described47,48, except that LDN (4 µM) (Stemgent Cat. N. 04-0074) and SB431542 (10 µM) (Stemgent Cat. N.04-0010) was added to the medium throughout the 11 days. Neural induction was followed by terminal differentiation and maturation in neural differentiation medium consisting of a 1:1 mixture of N-2 medium (DMEM/F-12 GlutaMAX, N-2 supplement (1x), 100 µm nonessential amino acids, 100 μM 2-mercaptoethanol, 2000 U/ml penicillin and 2000 µg/ml streptomycin) and B-27-containing neurobasal medium (Neurobasal medium, B-27 supplement (1x), 2 mM Glutamax)49,50. We have previously confirmed expression (protein and/or mRNA) of cortical glutamatergic markers (e.g. vGlut1, glutamate, Sox1, Pax6, FoxG1, synapsin, homer along appropriate) using this protocol (data not shown). By day 33 in culture, neuronal processes positive for ß3-Tubulin and MAP2 were observed (Supplementary Fig. 1). HD58-3 hiPSC-derived cortical neurons were further differentiated to day 63. On day 63 of differentiation, the neurons were treated with accutase (Innovative Cell Technologies Cat. N. AT-104) and re-plated at a density of 1 million cells per 10 cm2 in neural differentiation medium containing 10 µM Rock-inhibitor. In K6PC-5 experiments, HD58-3 hiPSCs were re-plated from independent wells to provide three experimental replicates. On day 64, the media was changed to remove the ROCK inhibitor and the cortical neurons exposed on day 65 to 50 µM K6PC-5 for 30 minutes. Lysate preparation. Neuronal cultures were washed once with ice cold PBS and then lysed in 100 µl of RIPA buffer containing protease (Sigma- Aldrich Cat. N. P8340) and phosphatase inhibitor cocktails 2 and 3 (Sigma-Aldrich Cat. N. P5726, Cat. N. P0044), and the lysates centrifuged at 4 °C for 20 min at 20,000 g. The protein concentration of the resulting supernatant was quantified using the Pierce BCA Protein Assay (Thermo Scientific). Twenty-five micrograms of neuronal proteins were loaded for each sample on a 4–20% pre-cast SDS-PAGE gel (BioRad) and run for 3 hours at 90 V. Proteins were then transferred onto nitrocellulose membranes using iBlot Gel Transfer Device (Life Technologies) and the gel was stained with Coomassie (BioRad) for 1 hour. The nitrocellulose membrane was blocked in Odyssey Blocking Buffer for 1 hour, and then incubated with anti phospho-AKT and AKT and anti phospho-ERK and ERK antibodies as reported below. Protein bands were detected by ECL Prime (GE Healthcare) and quantitated with Quantity One Software (Bio-Rad Laboratories).
Immunoblottings
For SGPL1, SPHK1, SPHK2, twenty-five micrograms of total protein lysate were immunoblotted with the following antibodies: anti-SGPL1 (1:1000) (Santa Cruz, Cat. N. sc-67368), anti-SPHK1 (1:1000) (Abcam, Cat. N. ab71700; lot numbers: GR17790-4 and GR17790-24) and anti-SPHK2 (1:1000) (Abcam, Cat. N. ab37977; lot numbers: GR31063-12 and GR31063-39). For phospho-AKT, AKT, phospho-ERK and ERK, total lysate was immunoblotted with the following antibodies: anti-phospho-AKT (1:1000) (Cell Signaling, Cat. N. 9271), anti-AKT (1:1000) (Cell Signaling Cat. N. 2920), anti-phospho-ERK (1:1000) (Cell Signaling Cat. N. 9101), anti-ERK (1:1000) (Cell Signaling Cat. N. 9102), and anti-ERK (1:1000) (Cell Signaling Cat. N. 4696). For protein normalization, anti-Actin (1:5000) (Sigma Aldrich, Cat. N. A5441) or anti-Cyclophilin (1:3000) (Abcam, Cat. N. ab16045) was used. Protein bands were detected by ECL Prime (GE Healthcare) and quantitated with Quantity One Software (Bio-Rad Laboratories).
RNA extraction and analysis of gene expression by real-time PCR
Total RNA was extracted using RNeasy kit (Qiagen) according to the manufacturer’s instructions. One microgram of total RNA was reverse-transcribed using Superscript II reverse transcriptase (Invitrogen) and oligo-dT primer, and the resulting cDNAs were amplified using Power SYBR Green PCR Master Mix (Applied Biosystems) following the manufacturers’ instructions. Quantitative PCR analysis will be performed on a StepOne instrument (Applied Biosystems) using specific the following primers:
mouse SGPL1 Fw: 5′-cattcgacaaagcagctcat-3′;
mouse SGPL1 Rev: 5′-ctcttcattgcctgcacatc-3′;
mouse SPHK1 Fw: 5′-tgtgaaccactatgctgggta-3′;
mouse SPHK1 Rev: 5′-cagcccagaagcagtgtg-3′;
mouse SPHK2 Fw: 5′-agacgggctgctttacga-3′;
mouse SPHK2 Rev: 5′-caggggaggacaccaatg-3′;
mouse Cyclophilin Fw: 5′-tccaaagacagcagaaaactttcg-3′;
mouse Cyclophilin Rev: 5′-tcttcttgctggtcttgccattcc-3′.
Analysis of apoptosis
Apoptosis was assessed as previously described34. In THI experiments, cells were cultured in standard growth medium for three days in the presence and absence of THI, then they were placed at 39 °C for five hours in SFM. In K145, EMD567731, SK1-I and DMS experiments, cells were pre-treated with each inhibitor at 33 °C for 1 hour in serum-free medium (SFM) and then placed at 39 °C for five hours. In K6PC-5 experiments, cells were incubated in SFM and placed at 39 °C for five hours in the presence and absence of the SPHK1 activator. At the end of each treatment, cells were collected and incubated with FITC-conjugated Annexin V (BD, Cat. N. 556419), according to the manufacturer’s instructions. Fluorescence-activated cell sorting (FACS) analysis was performed as previously described34.
Statistics
Two side Paired and Unpaired t-tests were used as indicated. Data are expressed as mean ± SD.
Results
Expression of sphingolipid-metabolizing enzymes is aberrant in HD human post-mortem brains
Deregulated expression and activity of sphingolipid-metabolizing enzymes have been recently described in animal models and patients with a range of chronic neurodegenerative conditions25,26,28,51. Here, in order to investigate whether similar biochemical defects also occur in HD, we analyzed post-mortem striatal and cortical specimens from patients with advanced HD (grade III-IV)40 compared to gender and age-matched healthy controls (Table 1). Immunoblotting analysis showed that the expression of SGPL1 was robustly increased in both the striatum and cortex of these HD patients (Fig. 2A and E) and this was further confirmed by immunohistochemistry (Fig. 2B and F). In line with the hypothesis that there is a major disturbance in the regulation of either the synthesis or degradation of sphingolipids, increased SGPL1 was associated with a significant reduction of SPHK1 in the striatum of the same HD patients when compared to healthy controls (Fig. 2C). Although a trend towards a similar reduction of SPHK1 protein expression in the cortex was seen, this did not reach statistical significance (Fig. 2G). No changes in the expression profile of multiple isoforms52–54 of SPHK2 could be detected neither in the striatum nor in the cortex (Fig. 2D and H).
Figure 2.
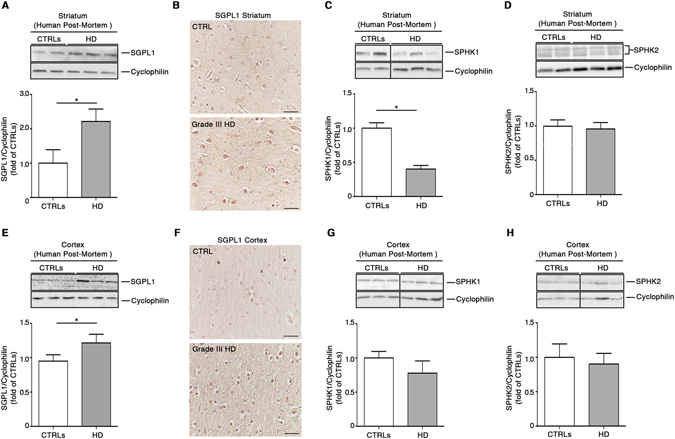
Expression of S1P metabolizing enzymes is abnormal in post-mortem brain tissues from HD patients. Cropped immunoblottings and densitometric analysis (A) along with representative immunohistochemical micrographs (B) of SGPL1 expression in the striatum from post-mortem human brains of manifest HD patients and age- and gender-matched healthy controls (see Table 1). Cropped immunoblottings and densitometric analysis of SPHK1(C) and SPHK2 isoform expression (D) in the striatum from post-mortem human brains of the same subjects. Cropped immunoblottings and densitometric analysis (E) along with representative immunohistochemical micrographs (F) of SGPL1 in the cortex from human post-mortem brains of manifest HD patients and age- and gender-matched healthy controls. Cropped immunoblottings and densitometric analysis of SPHK1(G) and SPHK2 isoform expression (H) in the cortex from post-mortem human brains of the same subjects. Scale bar in each micrograph represents 100 µm. In each immunoblotting, all samples were run on the same gel. Non-adjacent samples were separated by a black line. Values are mean ± SD. N = 2–3 for each group of patients. *p < 0.05 (Unpaired t-test).
S1P-metabolizing enzymes in HD animal models showed an expression profile similar to that seen in the HD human post-mortem samples
In order to clarify whether alterations in the sphingolipid metabolic pathways are relevant to the neurodegenerative process in HD, we examined brain tissues from two different HD mouse models (YAC128 and R6/2 mice).
Biochemical analysis of all three SGPL1, SPHK1 and SPHK2 proteins, in the striatal tissues from manifest YAC128 mice, showed expression profiles similar to that in human tissues (Fig. 3A–C). While expression of SGPL1 was significantly increased (Fig. 3A), levels of multiple isoforms52,53,55 of SPHK1 were markedly reduced in these HD mice when compared to wild-type (WT) littermates (Fig. 3B). No changes in the expression of SPHK2 isoforms were, indeed, observed (Fig. 3C). When cortical tissues were analyzed, no variation was observed in any of the three proteins (Fig. 3D–F).
Figure 3.
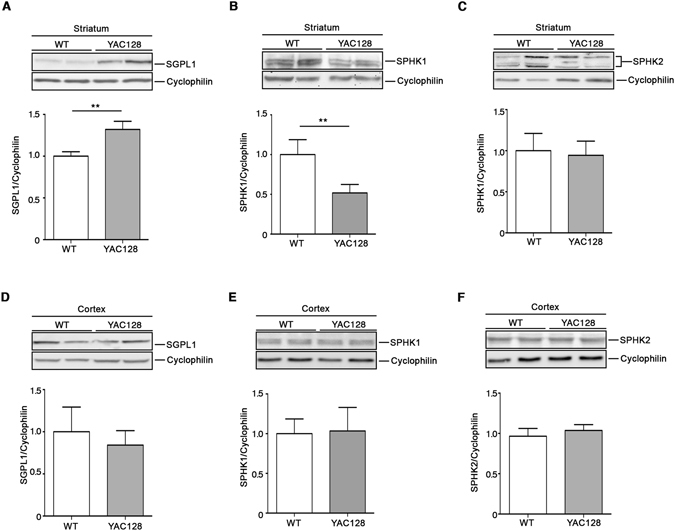
Expression of S1P-metabolizing enzymes is defective in the striatum of YAC128 HD mice. Representative cropped immunoblottings and densitometric analysis of SGPL1 and SPHK1/2 isoform expression in striatal (A–C) and cortical (D,E) tissues from manifest (9 month old) YAC128 mice and WT littermates. Value are represented as mean ± SD. N = 5 for each group of mice. *p < 0.05; **p < 0.001 (Unpaired t-test).
To further investigate the aberrant sphingolipid metabolism in HD, biochemical analyses were extended to brain tissues from manifest R6/2 mice (Fig. 4) which express exon 1 of human HTT with over 150 poly-Q. Importantly, protein expression profiles of either SGPL1 or SPHK1 in these mice mirrored the pattern seen in YAC128 mice and human samples in both striatum and cortex (Fig. 4A,B). Indeed, SPHK2 expression showed a slight, but not significant trend toward the increase in the striatum (Fig. 4C) and was considerably incremented in the cortex (Fig. 4F).
Figure 4.
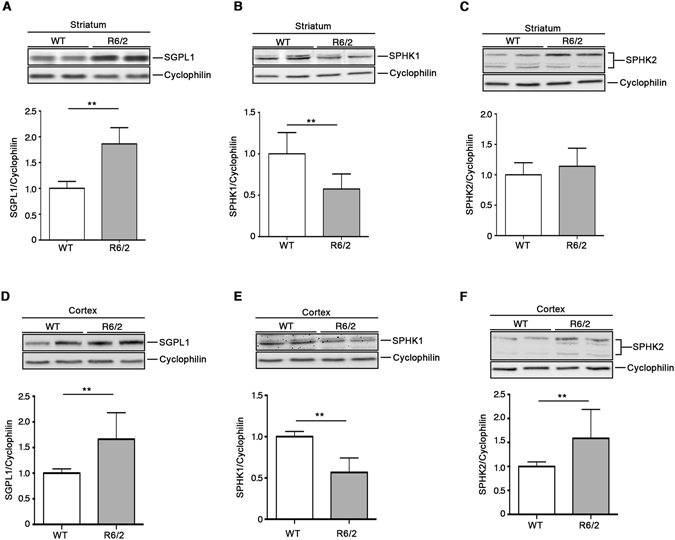
Expression of S1P metabolizing enzymes is defective in brain tissues from R6/2 HD mice. Representative cropped immunoblottings and densitometric analysis of SGPL1 and SPHK1/2 isoform expression in striatal (A–C) and cortical (D,E) tissues from manifest (11 week old) R6/2 mice and WT littermates. Values are represented as mean ± SD. N = 6–9 for each group of mice. **p < 0.001 (Unpaired t-test).
Brain tissues of manifest R6/2 mice showed perturbed bioavailability of essential sphingolipids
Expression levels of either SGPL1 or SPHKs have been previously associated with an altered bioavailability of the bioactive sphingolipid, S1P56,57. In order to verify whether a similar association exists in HD, sphingolipid content in R6/2 mouse brains was determined by a targeted sphingolipidomic analysis44. Consistent with the immunoblotting analyses, mass spectrometry revealed a significant reduction of S1P content in both striatum and cortex of manifest R6/2 mice (Fig. 5A and D).
Figure 5.
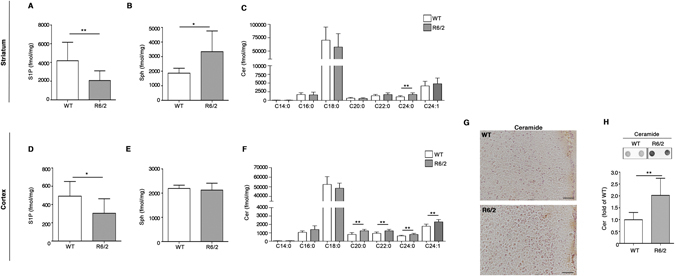
Levels of essential sphingolipids are defective in brain tissues from R6/2 mice. Lipidomic analysis by LC-MS/MS of S1P, Sph and Cer content in striatal (A–C) and cortical (D,F) tissues from manifest (11 week old) R6/2 mice and WT littermates. Values are represented as mean ± SD. N = 7–10 for each group of mice. *p < 0.05; **p < 0.001; ***p < 0.0001 (Unpaired t-test). Representative immunohistochemical micrograph (G) and dot blotting and densitometric analysis (H) of Cer content in the cortex of manifest R6/2 mice and WT littermates. Scale bar in each micrograph represents 100 µm. Data are represented as mean ± SD. N = 5 for each group of mice. **p < 0.001 (Unpaired t-test).
Beside the defective expression of the metabolizing enzymes, SPGL1 and SPHKs (Fig. 4), reduced levels of S1P in the brain tissues of R6/2 mice may be attributable to altered levels of Sph or to an overall imbalanced sphingolipids rheostat. Accordingly, quantitative analysis by Mass Spectrometry highlighted a significant increase of Sph in the striatum of R6/2 mice (Fig. 5B), however no changes were observed in the cortex (Fig. 5E). Mass spectral data revealed also a complex Cer profile in these two specific brain regions. Although the striatal tissues displayed increased levels of only one Cer species (C24:0), cortical tissues showed accumulation of different molecular species of the same lipid (C20:0, C22:0, C24:0 and C24:1) (Fig. 5C–F). Accumulation of Cer in the cortex was confirmed by immunohistochemical and dot blotting analysis (Fig. 5G–H). This accumulation was also associated with a reduction of some GluCer species as shown in Fig. 6.
Figure 6.
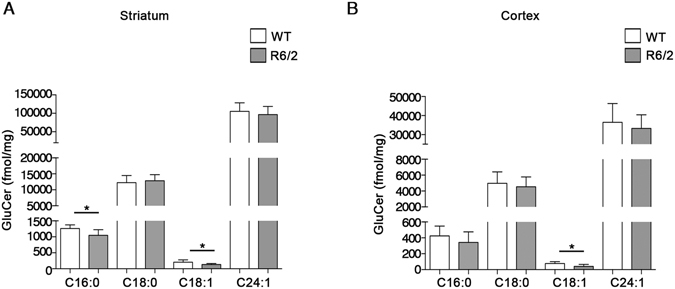
Levels of Glucosylceramides (GluCer) are reduced in brain tissues from R6/2 mice. Lipidomic analysis by LC-MS/MS of GluCer content in the striatal (A) and cortical (B) tissues from manifest (11 week old) R6/2 mice and WT littermates. Values are represented as mean ± SD. N = 7 for each group of mice. **p < 0.001(Unpaired t-test).
Sphingolipid metabolism is aberrant at early stage of the disease in brain tissues from R6/2 mice
In order to assess whether alteration of sphingolipid metabolism may represent an early biological event, potentially underlying HD pathophysiology, we investigated the expression of S1P-metabolizing enzymes in both striatal and cortical tissues from early manifest (6 week old) R6/2 mice. Importantly, immunoblotting analysis showed a significant increase of SGPL1 levels in both regions already at such early stage of the disease. No difference in SPHK1 and 2 expression was indeed detectable (Fig. 7A–F). Interestingly, semi-quantitative analysis by dot blotting pointed out also a robust increase of Cer content in the cortex of the same mice (Fig. 8A). This result was confirmed by immuhistochemical analysis (Fig. 8B).
Figure 7.
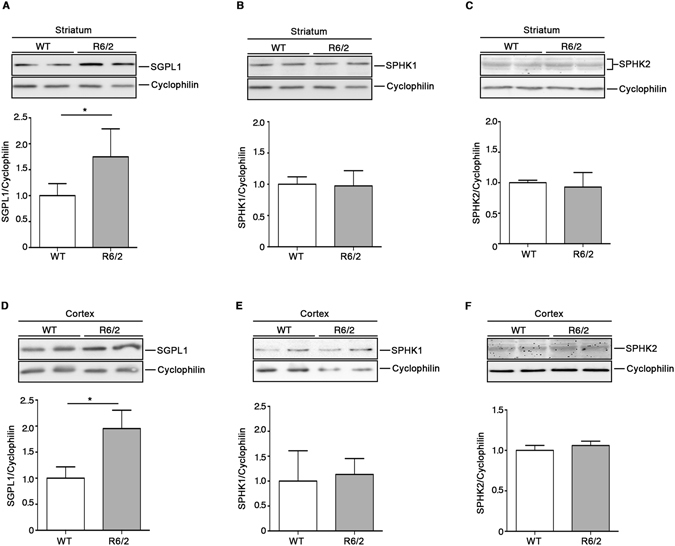
Levels of both SGPL1 are defective in brain tissues from R6/2 mice at early stages of the disease. Representative cropped immunoblottings and densitometric analysis of SGPL1 and SPHK1/2 isoform expression in striatal (A–C) and cortical (D,E) tissues from early manifest (6 week old) R6/2 mice and WT littermates. Values are represented as mean ± SD. N = 5 for each group of mice. **p < 0.001 (Unpaired t-test).
Figure 8.
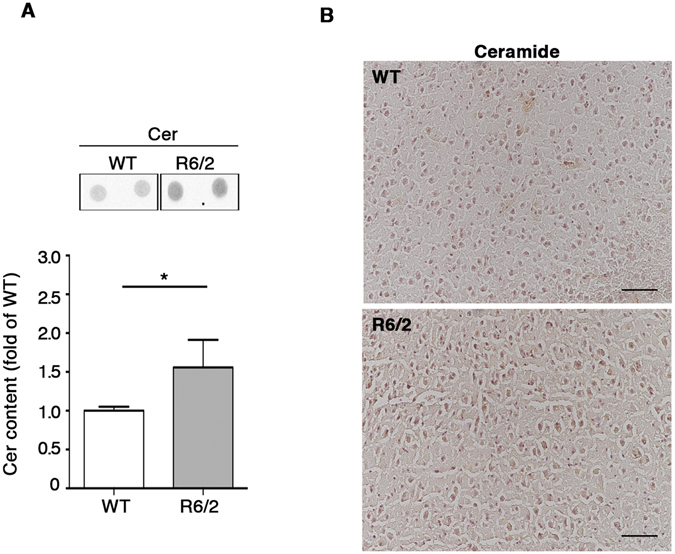
Levels of ceramides are increased in cortical tissue from R6/2 mice at early stages of the disease. Representative dot blotting and densitometric analysis (A) and immunohistochemical micrograph. Scale bar in each micrograph represents 100 µm. (B) of Cer content in the cortex of early manifest (6 week old) R6/2 mice and WT littermates. Data are represented as mean ± SD. N = 5 for each group of mice. *p < 0.05 (Unpaired t-test).
Pharmacological modulation of S1P-metabolizing enzyme activity regulates pro-survival pathways in HD cells
Modulation of sphingolipid metabolizing-enzyme activity has been widely described to alter the bioavailability of S1P and by so doing cellular homeostasis and survival58,59.
In order to investigate the potential role of all three S1P-metabolizing enzymes in HD cellular homeostasis, we undertook pharmacological studies (Fig. 9D) in mice striatal-derived knock in cell lines expressing endogenous levels of wild type (STHdh7/7) or mHtt (STHdh111/111) and where levels of S1P have been previously reported to be reduced32.
Figure 9.
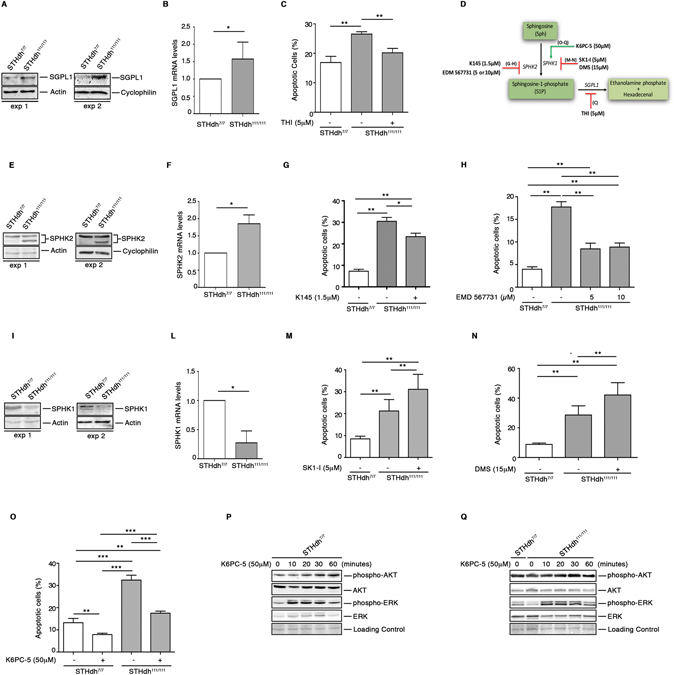
Pharmacological modulation of S1P metabolizing enzyme activity regulates cell survival in HD striatal derived cells. Cropped immunoblotting of SGPL1 protein (A) and mRNA expression levels (B) from STHdh7/7 and STHdh111/111 cells. Values are mean ± SD of three experiments performed in triplicate. *p < 0.05 (Unpaired t-test). Analysis of apoptosis in STHdh cell lines first cultured for three days in complete medium in the absence and presence of 5 μM THI and then incubated for five hours in serum free medium to induce apoptosis (C). Values are mean ± SD of two experiments performed in quadruplicate. **p < 0.001(Unpaired t-test). Schematic representation of the pharmacological interventions to modulate the activity of S1P-metabolizing enzymes (D). Cropped immunoblotting of SPHK2 protein (E) and mRNA expression levels (F) from STHdh7/7 and STHdh111/111 cells. Values are mean ± SD of three experiments performed in triplicate. *p < 0.05 (Unpaired t-test). Analysis of apoptosis in STHdh cell lines incubated for five hours in serum free media in the presence or absence of either 1.5 μM K145 (G) or 5 and 10 μM EMD567731 (H) SPHK2 inhibitors. Values are mean ± SD of three experiments, each performed in triplicate. *p < 0.05; **p < 0.001 (Unpaired t-test). Cropped immunoblotting of SPHK1 protein (I) and mRNA expression levels (L) from STHdh7/7 and STHdh111/111 cells. Values are mean ± SD of three experiments performed in triplicate. *p < 0.05 (Unpaired t-test). Analysis of apoptosis in STHdh cell lines incubated for five hours in serum free media in the presence or absence of 5 μM SK1-I (2R, 3S, 4E)-N-methyl-5-(4′-pentylphenyl)-2-aminopent-4-ene-1,3-diol) (M) and 15 μM DMS (N,N-Dimethylsphingosine) (N). Data are mean ± SD of three experiments, each performed in triplicate. **p < 0.001 (Unpaired t-test). Apoptosis in STHdh cell lines incubated for five hours in serum-free medium in the presence or absence of 50 μM K6PC-5 (O). Data are mean ± SD of three experiments, each performed in triplicate. **p < 0.001; ****p < 0.0001 (Unpaired t-test). Cropped immunoblotting of AKT and ERK phosphorylation in cellular protein extracts from STHdh7/7 (P) and STHdh111/111 (Q) cell lines measured at different time points after K6PC-5 treatment.
In line with our earlier data, both protein and gene expression of these enzymes was markedly abnormal in these cells (Fig. 9A,B,E,F and I–L). While higher levels of SGPL1 in the mHtt cells were associated with an increased susceptibility to apoptosis (Fig. 9A–C), its pharmacological inhibition by 2-acetyl-4-(tetrahydroxybutyl) imidazole (5 μM THI) re-established the vulnerability of these cells to cell death to the extent that they behaved as WT cells (Fig. 9C). Increased expression of SGPL1 was paralleled by visibly higher levels of SPHK2 (Fig. 9E,F), and according to other studies31, its inhibition by either K145 (1.5 μM) or EMD567731 (5 and 10 μM) significantly protected cells form apoptosis (Fig. 9G,H).
Contrary to what was found for SGPL1 and SPHK2, levels of SPHK1 were significantly reduced in HD cells (Fig. 9I–L). Although the impact that such an imbalance may have on cell function is not clear yet, pharmacological inhibition of SPHK1 by either SK1-I (5 μM) or DMS (15 μM) further exacerbated the susceptibility of HD cells to apoptosis (Fig. 9M,N).
Finally, with the aim of elucidating the extent to which SPHK1 may influence cell survival in the presence of mHtt, we evaluated the potential beneficial effect of its pharmacological activation by using K6PC-5, a selective stimulator of SPHK1 activity60–62. Importantly, treatment with 50 μM K6PC-5 significantly mitigated the vulnerability of cells to apoptosis (Fig. 9O) and rapidly induced the activation of either AKT or ERK in both WT and HD cells as shown in Fig. 9P,Q. Importantly, administration of K6PC-5 triggered a slight, but significant increase of both phospho-AKT and phospho-ERK also in iPSC-derived cortical neurons from HD patients (Fig. 10A,B and Supplementary Fig. 2).
Figure 10.
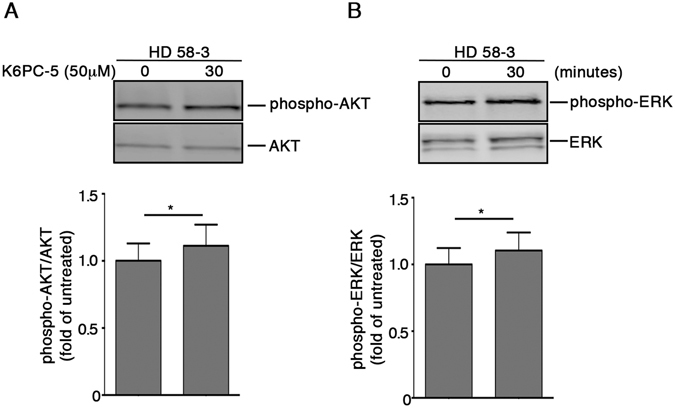
Pharmacological activation of SPHK1 evokes activation of pro-survival pathways in human iPSC-derived neurons. Representative cropped immunoblottings and densitometric analysis of AKT (A) and ERK (B) phosphorylation in iPSC-derived HD human neurons (day 65) after 30 minute of treatment with K6PC-5. Data are mean ± SD of three experiments, * p < 0.05 (Paired t-test).
Discussion
There is increasing evidence that links perturbed sphingolipid metabolism to a range of different neurodegenerative conditions including HD4,25,26,28.
In this study, we consolidated the evidence that sphingolipid metabolism is aberrant in HD and represents a common pathogenic denominator among multiple preclinical models of the disease and in human patients. Also, we demonstrated for the first time, that expression of S1P-metabolizing enzymes is significantly altered. In particular, we have found that such a defect shows some regional variation in the HD brain, with especially consistent expression profile abnormalities seen between SPGL1 and SPHK1 in the striatal tissues of all our HD human samples and animal models. Up-regulation of SGPL1 was consistently paralleled by down-regulation of SPHK1, which, under physiological conditions, is known to act as a pro-survival kinase in both CNS and peripheral tissues18,63,64.
The role of SPHK2 in HD, indeed, remains elusive. The significance of the differential expression of SPHK2 between brain tissues from R6/2 mice and YAC128 mice and HD patients is not straightforward, however it may be that SPHK2 has different roles depending on when and where it is expressed or on its subcellular localization65. Very recent findings reported a detrimental effect of SPHK2 in different in vitro models of the disease65. Thus, we speculate that elevation of its expression in brain tissues from R6/2 mice may be toxic and further contribute to the worsening of the disease in this mouse model.
Alteration in the expression of S1P-metabolizing enzymes may theoretically correlate with a defective availability of the bioactive lipids in HD. Accordingly, lipidomic analysis revealed a significant decrease in the levels of S1P in both striatum and cortex of manifest R6/2 mice. Our study also provides the first in vivo evidence of perturbed ceramide homeostasis, whose increased levels have been described to interfere with mitochondrial channel formation, exert pro-apoptotic actions66,67 and to be associated with different neurodegenerative conditions39,68,69.
Where the reduction of S1P content in the brain tissues of R6/2 mice comes from, is currently unclear. However, taking into account the abnormal increase of Sph levels in the striatum along with accumulation of different Cer species in the cortex of these mice and, considering also the increased levels of S1P-degradative enzyme, SGPL1, in both brain regions, disturbed S1P homeostasis may be due to a combination of poor conversion of Cer to S1P, through Sph production and/or to its enhanced degradation.
Importantly, abnormal expression of SGPL1 and higher levels of Cer, already detectable at early stage of disease in R6/2 mice, likely suggest that S1P metabolism is precociously affected in HD.
This finding corroborated our previous evidence demonstrating that perturbations of the sphingolipid metabolism occur early in the disease9. Moreover, the absence of defects in the expression of both SPHK1 and 2 proteins in early manifest mice also indicates that such alterations may progress with the worsening of the disease.
Although not investigated how huntington mutation may alter the expression of S1P-metabolizing enzymes, its early occurrence may likely be attributable to gene expression deregulations, as they may take place before disease onset70. To this regard, evidence indicates that SGPL1 gene expression is usually negatively regulated by the micro RNA - miRNA 125b71. Interestingly, expression of miRNA 125b is described being down-regulated in different pre-clinical models of HD including R6/2 mice72. In the light of that, we hypothesize that SGPL1 over-expression may be likely attributable to micro RNA dysregulation. However, our findings suggested that aberrant enzyme protein content likely depends on altered gene expression.
From our perspective, our findings provide first insights into perturbed S1P metabolism, which does not represent an epiphenomenon connected to the worsening of the disease, but rather a mutation-dependent biological event with a potential pathogenic role in HD.
Along this line, pharmacological interventions aimed at modulating S1P metabolism may pave the way for the development of more targeted and effective therapeutic strategies for the treatment of HD. Our results are in line with recent evidence showing the potential beneficial effect of modulation of SPHKs in vitro30,31, and strengthen our previous findings demonstrating a neuroprotective effect of the S1P receptor stimulation in vivo34. Importantly, the beneficial effects of pharmacological modulation of S1P-metabolizing enzymes in HD human iPSC-derived neurons, further support our hypothesis.
We believe that the novelty of our study lies in the evidence that alteration in S1P metabolism may represent a new hallmark of the disease as it is shared amongst preclinical models of HD and most importantly visible also in human post-mortem brains. In addition, its early occurrence corroborates the hypothesis that defective sphingolipid homeostasis may likely contribute to the development of HD. In conclusion, in our opinion what makes our findings attractive is the evidence that sphingolipid metabolism may represent a target for the discovery of novel therapeutic strategies in HD, especially given that drugs working through its related pathways are already in clinical trial for different other pathological conditions73,74.
Electronic supplementary material
Acknowledgements
This work was supported by “Fondazione Neuromed” and funded by Italian Ministry of Health “Ricerca Corrente” to V.M. and in part by NIH NIEHS RO1 ES016931 to A.B.B. V.M. was also supported by “Marie Curie” International Incoming Fellowship (PIIF-GA-2011-300197). The human post mortem tissue comes from the Cambridge Brain Bank that is partly supported by an NIHR grant to the Addenbrookes Hospital/University of Cambridge Biomedical Research Centre.
Author Contributions
V.M. conceived and designed the study. V.M. and A.D.P. jointly directed the study and co-wrote the manuscripts. R.A.B., A.B.B., R.V., M.D.N., A.A., S.K.J., A.F.D. and M.D.E. revised the manuscript. Human post-mortem brains: R.V. and R.B. Animal studies: A.D.P., E.A., S.C., F.E., F.S., M.M. and G.P. Biochemical studies: E.A. and V.M. Lipidomics: A.B., A.A. Human iPSC studies: P.J., M.D.N. and A.B.B. K6PC- 5 studies: S.K.J. and B.M.P. All the authors approved the manuscript.
Competing Interests
The authors declare that they have no competing interests.
Footnotes
A correction to this article is available online at https://doi.org/10.1038/s41598-018-23083-1.
Electronic supplementary material
Supplementary information accompanies this paper at doi:10.1038/s41598-017-05709-y
Publisher's note: Springer Nature remains neutral with regard to jurisdictional claims in published maps and institutional affiliations.
Change history
5/24/2018
A correction to this article has been published and is linked from the HTML and PDF versions of this paper. The error has been fixed in the paper.
References
- 1.Novak MJ, Tabrizi SJ. Huntington’s disease: clinical presentation and treatment. Int Rev Neurobiol. 2011;98:297–323. doi: 10.1016/B978-0-12-381328-2.00013-4. [DOI] [PubMed] [Google Scholar]
- 2.Saudou F, Humbert S. The Biology of Huntingtin. Neuron. 2016;89:910–926. doi: 10.1016/j.neuron.2016.02.003. [DOI] [PubMed] [Google Scholar]
- 3.Imarisio S, et al. Huntington’s disease: from pathology and genetics to potential therapies. Biochem J. 2008;412:191–209. doi: 10.1042/BJ20071619. [DOI] [PubMed] [Google Scholar]
- 4.Maglione V, et al. Impaired ganglioside metabolism in Huntington’s disease and neuroprotective role of GM1. J Neurosci. 2010;30:4072–4080. doi: 10.1523/JNEUROSCI.6348-09.2010. [DOI] [PMC free article] [PubMed] [Google Scholar]
- 5.Valenza M, et al. Dysfunction of the cholesterol biosynthetic pathway in Huntington’s disease. J Neurosci. 2005;25:9932–9939. doi: 10.1523/JNEUROSCI.3355-05.2005. [DOI] [PMC free article] [PubMed] [Google Scholar]
- 6.Carroll JB, et al. HdhQ111 Mice Exhibit Tissue Specific Metabolite Profiles that Include Striatal Lipid Accumulation. PLoS One. 2015;10:e0134465. doi: 10.1371/journal.pone.0134465. [DOI] [PMC free article] [PubMed] [Google Scholar]
- 7.Block RC, Dorsey ER, Beck CA, Brenna JT, Shoulson I. Altered cholesterol and fatty acid metabolism in Huntington disease. J Clin Lipidol. 2010;4:17–23. doi: 10.1016/j.jacl.2009.11.003. [DOI] [PMC free article] [PubMed] [Google Scholar]
- 8.Gao X, et al. Cholesterol Modifies Huntingtin Binding to, Disruption of, and Aggregation on Lipid Membranes. Biochemistry. 2016;55:92–102. doi: 10.1021/acs.biochem.5b00900. [DOI] [PMC free article] [PubMed] [Google Scholar]
- 9.Di Pardo A, Amico E, Maglione V. Impaired Levels of Gangliosides in the Corpus Callosum of Huntington Disease Animal Models. Front Neurosci. 2016;10:457. doi: 10.3389/fnins.2016.00457. [DOI] [PMC free article] [PubMed] [Google Scholar]
- 10.Gault CR, Obeid LM, Hannun YA. An overview of sphingolipid metabolism: from synthesis to breakdown. Adv Exp Med Biol. 2010;688:1–23. doi: 10.1007/978-1-4419-6741-1_1. [DOI] [PMC free article] [PubMed] [Google Scholar]
- 11.Goni FM, Sot J, Alonso A. Biophysical properties of sphingosine, ceramides and other simple sphingolipids. Biochem Soc Trans. 2014;42:1401–1408. doi: 10.1042/BST20140159. [DOI] [PubMed] [Google Scholar]
- 12.Mendelson K, Evans T, Hla T. Sphingosine 1-phosphate signalling. Development. 2014;141:5–9. doi: 10.1242/dev.094805. [DOI] [PMC free article] [PubMed] [Google Scholar]
- 13.Spiegel S, Milstien S. Sphingosine-1-phosphate: an enigmatic signalling lipid. Nat Rev Mol Cell Biol. 2003;4:397–407. doi: 10.1038/nrm1103. [DOI] [PubMed] [Google Scholar]
- 14.Maceyka M, Harikumar KB, Milstien S, Spiegel S. Sphingosine-1-phosphate signaling and its role in disease. Trends Cell Biol. 2012;22:50–60. doi: 10.1016/j.tcb.2011.09.003. [DOI] [PMC free article] [PubMed] [Google Scholar]
- 15.Proia RL, Hla T. Emerging biology of sphingosine-1-phosphate: its role in pathogenesis and therapy. J Clin Invest. 2015;125:1379–1387. doi: 10.1172/JCI76369. [DOI] [PMC free article] [PubMed] [Google Scholar]
- 16.Spiegel S, Milstien S. Functions of the multifaceted family of sphingosine kinases and some close relatives. J Biol Chem. 2007;282:2125–2129. doi: 10.1074/jbc.R600028200. [DOI] [PubMed] [Google Scholar]
- 17.Le Stunff H, Peterson C, Liu H, Milstien S, Spiegel S. Sphingosine-1-phosphate and lipid phosphohydrolases. Biochim Biophys Acta. 2002;1582:8–17. doi: 10.1016/S1388-1981(02)00132-4. [DOI] [PubMed] [Google Scholar]
- 18.Morozov VI, Sakuta GA, Kalinski MI. Sphingosine-1-phosphate: distribution, metabolism and role in the regulation of cellular functions. Ukr Biokhim Zh (1999) 2013;85:5–21. doi: 10.15407/ubj85.01.005. [DOI] [PubMed] [Google Scholar]
- 19.Strub GM, et al. Sphingosine-1-phosphate produced by sphingosine kinase 2 in mitochondria interacts with prohibitin 2 to regulate complex IV assembly and respiration. FASEB J. 2011;25:600–612. doi: 10.1096/fj.10-167502. [DOI] [PMC free article] [PubMed] [Google Scholar]
- 20.Gomez L, et al. A novel role for mitochondrial sphingosine-1-phosphate produced by sphingosine kinase-2 in PTP-mediated cell survival during cardioprotection. Basic Res Cardiol. 2011;106:1341–1353. doi: 10.1007/s00395-011-0223-7. [DOI] [PMC free article] [PubMed] [Google Scholar]
- 21.Riccio A. New endogenous regulators of class I histone deacetylases. Sci Signal. 2010;3:pe1. doi: 10.1126/scisignal.3103pe1. [DOI] [PubMed] [Google Scholar]
- 22.Maceyka M, et al. SphK1 and SphK2, sphingosine kinase isoenzymes with opposing functions in sphingolipid metabolism. J Biol Chem. 2005;280:37118–37129. doi: 10.1074/jbc.M502207200. [DOI] [PubMed] [Google Scholar]
- 23.Serra M, Saba JD. Sphingosine 1-phosphate lyase, a key regulator of sphingosine 1-phosphate signaling and function. Adv Enzyme Regul. 2010;50:349–362. doi: 10.1016/j.advenzreg.2009.10.024. [DOI] [PMC free article] [PubMed] [Google Scholar]
- 24.Kumar A, Byun HS, Bittman R, Saba JD. The sphingolipid degradation product trans-2-hexadecenal induces cytoskeletal reorganization and apoptosis in a JNK-dependent manner. Cell Signal. 2011;23:1144–1152. doi: 10.1016/j.cellsig.2011.02.009. [DOI] [PMC free article] [PubMed] [Google Scholar]
- 25.Couttas TA, et al. Loss of the neuroprotective factor Sphingosine 1-phosphate early in Alzheimer’s disease pathogenesis. Acta Neuropathol Commun. 2014;2:9. doi: 10.1186/2051-5960-2-9. [DOI] [PMC free article] [PubMed] [Google Scholar]
- 26.Ceccom J, et al. Reduced sphingosine kinase-1 and enhanced sphingosine 1-phosphate lyase expression demonstrate deregulated sphingosine 1-phosphate signaling in Alzheimer’s disease. Acta Neuropathol Commun. 2014;2:12. doi: 10.1186/2051-5960-2-12. [DOI] [PMC free article] [PubMed] [Google Scholar]
- 27.He X, Huang Y, Li B, Gong CX, Schuchman EH. Deregulation of sphingolipid metabolism in Alzheimer’s disease. Neurobiol Aging. 2010;31:398–408. doi: 10.1016/j.neurobiolaging.2008.05.010. [DOI] [PMC free article] [PubMed] [Google Scholar]
- 28.Sivasubramanian, M., Dheen, S. T. & Tay, S. S. W. Alteration in the sphingolipid metabolism leads to activation of the apoptotic cascade in the MPTP induced mouse model of Parkinson’s disease. Faseb Journal27 (2013).
- 29.Lee JM, et al. Unbiased gene expression analysis implicates the huntingtin polyglutamine tract in extra-mitochondrial energy metabolism. PLoS Genet. 2007;3:e135. doi: 10.1371/journal.pgen.0030135. [DOI] [PMC free article] [PubMed] [Google Scholar]
- 30.Moruno Manchon JF, et al. Cytoplasmic sphingosine-1-phosphate pathway modulates neuronal autophagy. Sci Rep. 2015;5:15213. doi: 10.1038/srep15213. [DOI] [PMC free article] [PubMed] [Google Scholar]
- 31.Moruno-Manchon JF, et al. Inhibiting sphingosine kinase 2 mitigates mutant Huntingtin-induced neurodegeneration in neuron models of Huntington disease. Hum Mol Genet. 2017;26:1305–1317. doi: 10.1093/hmg/ddx046. [DOI] [PMC free article] [PubMed] [Google Scholar]
- 32.Pirhaji L, et al. Revealing disease-associated pathways by network integration of untargeted metabolomics. Nat Methods. 2016;13:770–776. doi: 10.1038/nmeth.3940. [DOI] [PMC free article] [PubMed] [Google Scholar]
- 33.Di Pardo A, et al. Ganglioside GM1 induces phosphorylation of mutant huntingtin and restores normal motor behavior in Huntington disease mice. Proc Natl Acad Sci USA. 2012;109:3528–3533. doi: 10.1073/pnas.1114502109. [DOI] [PMC free article] [PubMed] [Google Scholar]
- 34.Di Pardo A, et al. FTY720 (fingolimod) is a neuroprotective and disease-modifying agent in cellular and mouse models of Huntington disease. Hum Mol Genet. 2014;23:2251–2265. doi: 10.1093/hmg/ddt615. [DOI] [PubMed] [Google Scholar]
- 35.Miguez A, et al. Fingolimod (FTY720) enhances hippocampal synaptic plasticity and memory in Huntington’s disease by preventing p75NTR up-regulation and astrocyte-mediated inflammation. Hum Mol Genet. 2015;24:4958–4970. doi: 10.1093/hmg/ddv218. [DOI] [PubMed] [Google Scholar]
- 36.Bras J, Singleton A, Cookson MR, Hardy J. Emerging pathways in genetic Parkinson’s disease: Potential role of ceramide metabolism in Lewy body disease. FEBS J. 2008;275:5767–5773. doi: 10.1111/j.1742-4658.2008.06709.x. [DOI] [PMC free article] [PubMed] [Google Scholar]
- 37.Mencarelli C, Martinez-Martinez P. Ceramide function in the brain: when a slight tilt is enough. Cell Mol Life Sci. 2013;70:181–203. doi: 10.1007/s00018-012-1038-x. [DOI] [PMC free article] [PubMed] [Google Scholar]
- 38.Filippov V, et al. Increased ceramide in brains with Alzheimer’s and other neurodegenerative diseases. J Alzheimers Dis. 2012;29:537–547. doi: 10.3233/JAD-2011-111202. [DOI] [PMC free article] [PubMed] [Google Scholar]
- 39.Jazvinscak Jembrek M, Hof PR, Simic G. Ceramides in Alzheimer’s Disease: Key Mediators of Neuronal Apoptosis Induced by Oxidative Stress and Abeta Accumulation. Oxid Med Cell Longev. 2015;2015:346783. doi: 10.1155/2015/346783. [DOI] [PMC free article] [PubMed] [Google Scholar]
- 40.Vonsattel JP, et al. Neuropathological classification of Huntington’s disease. J Neuropathol Exp Neurol. 1985;44:559–577. doi: 10.1097/00005072-198511000-00003. [DOI] [PubMed] [Google Scholar]
- 41.Mangiarini L, et al. Exon 1 of the HD gene with an expanded CAG repeat is sufficient to cause a progressive neurological phenotype in transgenic mice. Cell. 1996;87:493–506. doi: 10.1016/S0092-8674(00)81369-0. [DOI] [PubMed] [Google Scholar]
- 42.Carter RJ, et al. Characterization of progressive motor deficits in mice transgenic for the human Huntington’s disease mutation. J Neurosci. 1999;19:3248–3257. doi: 10.1523/JNEUROSCI.19-08-03248.1999. [DOI] [PMC free article] [PubMed] [Google Scholar]
- 43.Slow EJ, et al. Selective striatal neuronal loss in a YAC128 mouse model of Huntington disease. Hum Mol Genet. 2003;12:1555–1567. doi: 10.1093/hmg/ddg169. [DOI] [PubMed] [Google Scholar]
- 44.Basit A, Piomelli D, Armirotti A. Rapid evaluation of 25 key sphingolipids and phosphosphingolipids in human plasma by LC-MS/MS. Anal Bioanal Chem. 2015;407:5189–5198. doi: 10.1007/s00216-015-8585-6. [DOI] [PMC free article] [PubMed] [Google Scholar]
- 45.Kim S, Steelman AJ, Zhang Y, Kinney HC, Li J. Aberrant upregulation of astroglial ceramide potentiates oligodendrocyte injury. Brain Pathol. 2012;22:41–57. doi: 10.1111/j.1750-3639.2011.00501.x. [DOI] [PMC free article] [PubMed] [Google Scholar]
- 46.Tidball AM, et al. Genomic Instability Associated with p53 Knockdown in the Generation of Huntington’s Disease Human Induced Pluripotent Stem Cells. PLoS One. 2016;11:e0150372. doi: 10.1371/journal.pone.0150372. [DOI] [PMC free article] [PubMed] [Google Scholar]
- 47.Chambers SM, et al. Highly efficient neural conversion of human ES and iPS cells by dual inhibition of SMAD signaling. Nat Biotechnol. 2009;27:275–280. doi: 10.1038/nbt.1529. [DOI] [PMC free article] [PubMed] [Google Scholar]
- 48.Neely MD, et al. DMH1, a highly selective small molecule BMP inhibitor promotes neurogenesis of hiPSCs: comparison of PAX6 and SOX1 expression during neural induction. ACS Chem Neurosci. 2012;3:482–491. doi: 10.1021/cn300029t. [DOI] [PMC free article] [PubMed] [Google Scholar]
- 49.Brown JA, et al. Recreating blood-brain barrier physiology and structure on chip: A novel neurovascular microfluidic bioreactor. Biomicrofluidics. 2015;9:054124. doi: 10.1063/1.4934713. [DOI] [PMC free article] [PubMed] [Google Scholar]
- 50.Shi Y, Kirwan P, Livesey FJ. Directed differentiation of human pluripotent stem cells to cerebral cortex neurons and neural networks. Nat Protoc. 2012;7:1836–1846. doi: 10.1038/nprot.2012.116. [DOI] [PubMed] [Google Scholar]
- 51.Takasugi N, et al. BACE1 activity is modulated by cell-associated sphingosine-1-phosphate. J Neurosci. 2011;31:6850–6857. doi: 10.1523/JNEUROSCI.6467-10.2011. [DOI] [PMC free article] [PubMed] [Google Scholar]
- 52.Hatoum D, Haddadi N, Lin Y, Nassif NT, McGowan EM. Mammalian sphingosine kinase (SphK) isoenzymes and isoform expression: challenges for SphK as an oncotarget. Oncotarget. 2017 doi: 10.18632/oncotarget.16370. [DOI] [PMC free article] [PubMed] [Google Scholar]
- 53.Venkataraman K, et al. Extracellular export of sphingosine kinase-1a contributes to the vascular S1P gradient. Biochem J. 2006;397:461–471. doi: 10.1042/BJ20060251. [DOI] [PMC free article] [PubMed] [Google Scholar]
- 54.Weigert A, et al. Cleavage of sphingosine kinase 2 by caspase-1 provokes its release from apoptotic cells. Blood. 2010;115:3531–3540. doi: 10.1182/blood-2009-10-243444. [DOI] [PubMed] [Google Scholar]
- 55.Schnitzer SE, Weigert A, Zhou J, Brune B. Hypoxia enhances sphingosine kinase 2 activity and provokes sphingosine-1-phosphate-mediated chemoresistance in A549 lung cancer cells. Mol Cancer Res. 2009;7:393–401. doi: 10.1158/1541-7786.MCR-08-0156. [DOI] [PubMed] [Google Scholar]
- 56.Hagen-Euteneuer N, Lutjohann D, Park H, Merrill AH, Jr., van Echten-Deckert G. Sphingosine 1-phosphate (S1P) lyase deficiency increases sphingolipid formation via recycling at the expense of de novo biosynthesis in neurons. J Biol Chem. 2012;287:9128–9136. doi: 10.1074/jbc.M111.302380. [DOI] [PMC free article] [PubMed] [Google Scholar]
- 57.Berdyshev EV, et al. Intracellular S1P generation is essential for S1P-induced motility of human lung endothelial cells: role of sphingosine kinase 1 and S1P lyase. PLoS One. 2011;6:e16571. doi: 10.1371/journal.pone.0016571. [DOI] [PMC free article] [PubMed] [Google Scholar]
- 58.Nguyen-Tran DH, et al. Molecular mechanism of sphingosine-1-phosphate action in Duchenne muscular dystrophy. Dis Model Mech. 2014;7:41–54. doi: 10.1242/dmm.013631. [DOI] [PMC free article] [PubMed] [Google Scholar]
- 59.Gassowska M, Cieslik M, Wilkaniec A, Strosznajder JB. Sphingosine kinases/sphingosine-1-phosphate and death Signalling in APP-transfected cells. Neurochem Res. 2014;39:645–652. doi: 10.1007/s11064-014-1240-3. [DOI] [PMC free article] [PubMed] [Google Scholar]
- 60.Ji F, et al. K6PC-5, a novel sphingosine kinase 1 (SphK1) activator, alleviates dexamethasone-induced damages to osteoblasts through activating SphK1-Akt signaling. Biochem Biophys Res Commun. 2015;458:568–575. doi: 10.1016/j.bbrc.2015.02.007. [DOI] [PubMed] [Google Scholar]
- 61.Hong JH, et al. K6PC-5, a direct activator of sphingosine kinase 1, promotes epidermal differentiation through intracellular Ca2+ signaling. J Invest Dermatol. 2008;128:2166–2178. doi: 10.1038/jid.2008.66. [DOI] [PubMed] [Google Scholar]
- 62.Shao JJ, Peng Y, Wang LM, Wang JK, Chen X. Activation of SphK1 by K6PC-5 Inhibits Oxygen-Glucose Deprivation/Reoxygenation-Induced Myocardial Cell Death. DNA Cell Biol. 2015;34:669–676. doi: 10.1089/dna.2015.2959. [DOI] [PMC free article] [PubMed] [Google Scholar]
- 63.Le Stunff H, Galve-Roperh I, Peterson C, Milstien S, Spiegel S. Sphingosine-1-phosphate phosphohydrolase in regulation of sphingolipid metabolism and apoptosis. J Cell Biol. 2002;158:1039–1049. doi: 10.1083/jcb.200203123. [DOI] [PMC free article] [PubMed] [Google Scholar]
- 64.Kanno T, et al. Regulation of synaptic strength by sphingosine 1-phosphate in the hippocampus. Neuroscience. 2010;171:973–980. doi: 10.1016/j.neuroscience.2010.10.021. [DOI] [PubMed] [Google Scholar]
- 65.Moruno-Manchon, J. F. et al. Inhibiting sphingosine kinase 2 mitigates mutant huntingtin-induced neurodegeneration in neuron models of Huntington disease. Hum Mol Genet, doi:10.1093/hmg/ddx046 (2017). [DOI] [PMC free article] [PubMed]
- 66.Huang C, Freter C. Lipid metabolism, apoptosis and cancer therapy. Int J Mol Sci. 2015;16:924–949. doi: 10.3390/ijms16010924. [DOI] [PMC free article] [PubMed] [Google Scholar]
- 67.Stiban J, Perera M. Very long chain ceramides interfere with C16-ceramide-induced channel formation: A plausible mechanism for regulating the initiation of intrinsic apoptosis. Biochim Biophys Acta. 2015;1848:561–567. doi: 10.1016/j.bbamem.2014.11.018. [DOI] [PubMed] [Google Scholar]
- 68.Adibhatla RM, Hatcher JF. Altered lipid metabolism in brain injury and disorders. Subcell Biochem. 2008;49:241–268. doi: 10.1007/978-1-4020-8831-5_9. [DOI] [PMC free article] [PubMed] [Google Scholar]
- 69.Ben-David O, Futerman AH. The role of the ceramide acyl chain length in neurodegeneration: involvement of ceramide synthases. Neuromolecular Med. 2010;12:341–350. doi: 10.1007/s12017-010-8114-x. [DOI] [PubMed] [Google Scholar]
- 70.Cha JH. Transcriptional signatures in Huntington’s disease. Prog Neurobiol. 2007;83:228–248. doi: 10.1016/j.pneurobio.2007.03.004. [DOI] [PMC free article] [PubMed] [Google Scholar]
- 71.Yang W, et al. miR-125b Enhances IL-8 Production in Early-Onset Severe Preeclampsia by Targeting Sphingosine-1-Phosphate Lyase 1. PLoS One. 2016;11:e0166940. doi: 10.1371/journal.pone.0166940. [DOI] [PMC free article] [PubMed] [Google Scholar]
- 72.Ghose J, Sinha M, Das E, Jana NR, Bhattacharyya NP. Regulation of miR-146a by RelA/NFkB and p53 in STHdh(Q111)/Hdh(Q111) cells, a cell model of Huntington’s disease. PLoS One. 2011;6:e23837. doi: 10.1371/journal.pone.0023837. [DOI] [PMC free article] [PubMed] [Google Scholar]
- 73.Gonzalez-Cabrera PJ, Brown S, Studer SM, Rosen H. S1P signaling: new therapies and opportunities. F1000Prime Rep. 2014;6:109. doi: 10.12703/P6-109. [DOI] [PMC free article] [PubMed] [Google Scholar]
- 74.Chew WS, Wang W, Herr DR. To fingolimod and beyond: The rich pipeline of drug candidates that target S1P signaling. Pharmacol Res. 2016;113:521–532. doi: 10.1016/j.phrs.2016.09.025. [DOI] [PubMed] [Google Scholar]
Associated Data
This section collects any data citations, data availability statements, or supplementary materials included in this article.


