

Abstract
Key points
A functional coupling between extrasynaptic NMDA receptors (eNMDARs) and the A‐type K+ current (I A) influences homeostatic firing responses of magnocellular neurosecretory cells (MNCs) to a physiological challenge. However, whether an altered eNMDAR–I A coupling also contributes to exacerbated MNC activity and neurohumoral activation during disease states is unknown.
We show that activation of eNMDARs by exogenously applied NMDA inhibited I A in MNCs obtained from sham, but not in MNCs from renovascular hypertensive (RVH) rats.
Neither the magnitude of the exogenously evoked NMDA current nor the expression of NMDAR subunits were altered in RVH rats.
Conversely, we found that a larger endogenous glutamate tone, which was not due to blunted glutamate transport activity, led to the sustained activation of eNMDARs that tonically inhibited I A, contributing in turn to higher firing activity in RVH rats.
Our studies show that exacerbated activation of eNMDARs by endogenous glutamate contributes to tonic inhibition of I A and enhanced MNC excitability in RVH rats.
Abstract
We recently showed that a functional coupling between extrasynaptic NMDA receptors (eNMDARs) and the A‐type K+ current (I A) influences the firing activity of hypothalamic magnocellular neurosecretory neurons (MNCs), as well as homeostatic adaptive responses to a physiological challenge. Here, we aimed to determine whether changes in the eNMDAR–I A coupling also contributed to exacerbated MNC activity during disease states. We used a combination of patch‐clamp electrophysiology and real‐time PCR in MNCs in sham and renovascular hypertensive (RVH) rats. Activation of eNMDARs by exogenously applied NMDA inhibited I A in sham rats, but this effect was largely blunted in RVH rats. The blunted response was not due to changes in eNMDAR expression and/or function, since neither NMDA current magnitude or reversal potential, nor the levels of NR1‐NR2A–D subunit expression were altered in RVH rats. Conversely, we found a larger endogenous glutamate tone, resulting in the sustained activation of eNMDARs that tonically inhibited I A and contributed also to higher ongoing firing activity in RVH rats. The enhanced endogenous glutamate tone in RVH rats was not due to blunted glutamate transporter activity. Rather, a higher transporter activity was observed, which possibly acted as a compensatory mechanism in the face of the elevated endogenous tone. In summary, our studies indicate that an elevated endogenous glutamate tone results in an exacerbated activation of eNMDARs, which in turn contributes to diminished I A magnitude and increased firing activity of MNCs from hypertensive rats.
Keywords: glutamate, hypothalamus, NMDA, potassium current
Key points
A functional coupling between extrasynaptic NMDA receptors (eNMDARs) and the A‐type K+ current (I A) influences homeostatic firing responses of magnocellular neurosecretory cells (MNCs) to a physiological challenge. However, whether an altered eNMDAR–I A coupling also contributes to exacerbated MNC activity and neurohumoral activation during disease states is unknown.
We show that activation of eNMDARs by exogenously applied NMDA inhibited I A in MNCs obtained from sham, but not in MNCs from renovascular hypertensive (RVH) rats.
Neither the magnitude of the exogenously evoked NMDA current nor the expression of NMDAR subunits were altered in RVH rats.
Conversely, we found that a larger endogenous glutamate tone, which was not due to blunted glutamate transport activity, led to the sustained activation of eNMDARs that tonically inhibited I A, contributing in turn to higher firing activity in RVH rats.
Our studies show that exacerbated activation of eNMDARs by endogenous glutamate contributes to tonic inhibition of I A and enhanced MNC excitability in RVH rats.
Abbreviations
- eNMDAR
extrasynaptic NMDA receptor
- IA
A‐type K+ current
- Iholding
holding current
- INMDA
NMDA current
- MNC
magnocellular neurosecretory neuron
- NMDAR
N‐methyl‐d‐aspartate receptor
- PVN
paraventricular nucleus
- RVH rat
renovascular hypertensive rat
- SON
supraoptic nucleus
Introduction
Magnocellular neurosecretory cells (MNCs) of the hypothalamic supraoptic (SON) and paraventricular (PVN) nuclei synthesize vasopressin or oxytocin neuropeptides and play critical roles in fluid balance, and cardiovascular and reproductive homeostasis (Silverman & Zimmerman, 1983). Moreover, it is now increasingly recognized that overactivation of the magnocellular system is a major component in neurohumoral activation, a pathophysiological process characteristic of prevalent neurogenic cardiovascular diseases such as heart failure and hypertension (Riegger et al. 1985; Packer et al. 1987; Packer, 1988; Yemane et al. 2010; Littlejohn et al. 2013). This includes renovascular forms of hypertension, in which elevated levels of circulating vasopressin have been shown to contribute to hypertension in experimental animal models (Mohring et al. 1978; Woods & Johnston, 1982; Ichikawa et al. 1983; Johnston, 1985; Hinojosa et al. 1986; Lariviere et al. 1988). Given the direct correlation between neurohumoral activation and morbidity/mortality in these diseases (Cohn et al. 1984; Yemane et al. 2010), elucidating the cellular and molecular mechanisms underlying altered MNC activity in hypertension is of critical importance.
The firing activity of MNCs, which directly correlates with circulating levels of vasopressin and oxytocin (Cazalis et al. 1985), is controlled by a fine‐tuned balance between intrinsic properties and extrinsic synaptic inputs, as well as by the activity of neighbouring astrocytes (Tasker et al. 2012; Brown et al. 2013). One of the key intrinsic voltage‐dependent subthreshold currents in MNCs is the A‐type potassium current (I A), which strongly affects MNC firing by determining spike onset and interspike interval during repetitive firing (Bourque, 1988; Luther & Tasker, 2000).
Among the various neurotransmitters that influence MNCs, glutamate is the major excitatory one (van den Pol et al. 1990). Acting primarily on ionotropic NMDA receptors (NMDARs), glutamate increases MNC activity, and also promotes bursting firing, which optimizes neurosecretory secretion at neurohypophysial terminals (Hu & Bourque, 1992; Nissen et al. 1995). Moreover, we recently showed that in addition to their conventional synaptic distribution, MNCs also express a molecularly and functionally distinct pool of NMDARs that are located extrasynaptically (eNMDARs) (Fleming et al. 2011; Potapenko et al. 2012b; Naskar & Stern, 2014). These receptors are predominantly composed of NR1/NR2B subunits (Tovar & Westbrook, 1999; Li et al. 2002), and upon binding extracellular glutamate, they mediate a tonic, sustained excitatory modality that strongly drives firing activity in MNCs (Fleming et al. 2011). We also showed that the magnitude of eNMDAR activation is tightly controlled by glutamate transporters expressed in enwrapping astroglial processes, which efficiently buffer extracellular glutamate, restricting in turn activation of eNMDARs (Fleming et al. 2011).
Importantly, changes in I A and glutamate excitatory function within the SON and PVN have been shown to contribute to neurohumoral activation. For example, a diminished expression and function of I A contributes to increased hypothalamic neuronal excitability during renovascular hypertension (Sonner et al. 2008, 2011). Conversely, an elevated glutamate excitatory function was reported in the SON/PVN of hypertensive and heart failure rats, which included both an elevated glutamate tone (Li & Pan, 2007; Gabor & Leenen, 2012), as well as an enhanced expression of NMDARs (Zheng et al. 2011; Li et al. 2014; Glass et al. 2015).
We recently showed that in MNCs, eNMDARs and I A are functionally coupled in a way that activation of eNMDARs results in a Ca2+‐dependent inhibition of I A and increased firing activity (Naskar & Stern, 2014). Moreover, we showed that eNMDAR activation and its coupling to I A are important in mediating homeostatic adjustments in MNC activity in response to an osmotic physiological challenge (Fleming et al. 2011; Naskar & Stern, 2014). However, whether changes in I A and NMDAR function during hypertension are functionally and/or causally interrelated through a similar mechanism remains unknown. Thus, in this study we tested the hypothesis that exacerbated activation of eNMDARs contributes to tonic inhibition of I A and enhanced MNC excitability in hypertensive rats. To address this question, we used a combination of patch‐clamp electrophysiology and real‐time PCR in MNCs of the SON of sham and renovascular hypertensive (RVH) rats.
Methods
Ethical approval
All experimental procedures were in strict compliance with NIH guidelines, and were approved by the Augusta University Institutional Animal Care and Use Committee.
Animals
Male Wistar rats purchased from Harlan (Indianapolis, IN, USA) (4–5 weeks old) were housed under standardized conditions (12 h:12 h light–dark cycle) with food and water available ad libitum. Rats weighing between 150 and 180 g (approximately 5–6 weeks old) were used to induce the renovascular 2K1C Goldblatt hypertension model (RVH), a well characterized and widely used model. Rats were anaesthetized with isoflurane (3%) throughout the surgery. Following an abdominal incision, the left kidney was exposed, and a 0.2 mm clip was placed over the left renal artery, partially occluding it. Sham rats were subjected to the same surgical procedure, although the artery was not occluded. Post‐operative care included proper management of associated pain (buprenorphine, 0.25 mg kg−1, subcutaneous, as needed). Systolic blood pressure was measured at the beginning of the sixth week post‐surgery, using a tail‐cuff method. Mean systolic blood pressure values for sham and RVH were 145.7 ± 2.2 mmHg (n = 35) and 208.5 ± 1.9 mmHg (n = 40), respectively. All rats were used for experiments during the sixth–seventh week post‐surgery.
Hypothalamic slices
Rats were anaesthetized with pentobarbital (50 mg kg−1 i.p.), quickly decapitated, and brains were dissected out. Coronal slices were cut (250 μm thick) using a vibroslicer (Leica VT1200s, Leica Microsystems, Buffalo Grove, IL, USA) as previously described (Jackson et al. 2005). An oxygenated ice cold artificial cerebrospinal fluid (ACSF) was used during slicing (containing in mm): 119 NaCl, 2.5 KCl, 1 MgSO4, 26 NaHCO3, 1.25 NaH2PO4, 20 d‐glucose, 0.4 ascorbic acid, 2.0 CaCl2 and 2.0 pyruvic acid; pH 7.4; 295–305 mosmol l−1. After sectioning, slices were placed in a holding chamber containing ACSF and kept at room temperature (22°C) until used.
Drugs
Tetrodotoxin (TTX) and dl‐2‐amino‐5‐phosphopentenoic acid (dl‐APV) were purchased from Abcam Biochemicals (Cambridge, MA, USA); N‐methyl‐d‐aspartate (NMDA), glycine, tetraethylammonium chloride (TEA), and all chemicals for ACSF except pyruvic acid were purchased from Sigma‐Aldrich (St Louis, MO, USA). Pyruvic acid was purchased from Amresco (Solon, OH, USA). Fluo‐5F pentapotassium salt was purchased from Thermo Fisher Scientific (Waltham, MA, USA). (3S)‐3‐[[3‐[[4‐(Trifluoromethyl)benzoyl]amino]phenyl]methoxy]‐l‐aspartic acid (TF‐TBOA) was purchased from Tocris Bioscience (Bristol, UK).
Electrophysiological recordings
Slices were placed in a submersion style recording chamber and bathed with solutions (3.0 ml min−1) that were bubbled continuously with a gas mix of 95% O2–5% CO2, and maintained at near physiological temperature (32°C). Thin‐walled (1.5 mm o.d., 1.17 mm i.d.) borosilicate glass (G150TF‐3, Warner Instruments, Sarasota, FL, USA) was used to pull patch pipettes (3–5 MΩ) on a horizontal Flaming/Brown micropipette puller (P‐97, Sutter Instruments, Novato, CA, USA). Whole‐cell patch‐clamp recordings from SON neurons whose somata were located within the second layer of neurons in the slice were visually made using differential interference contrast (DIC) videomicroscopy as previously described (Fleming et al. 2011). Recordings were obtained with a Multiclamp 700A amplifier (Axon Instruments, Union City, CA, USA).
Voltage clamp
The voltage output was digitized at 16‐bit resolution, 10 kHz (Digidata 1440, Axon Instruments), and saved on a computer to be analysed offline using pCLAMP10 software (Axon Instruments). Mean series resistance was 12.5 ± 0.4 MΩ and experiments were discarded in cases in which the series resistance was unstable or changed >20%. The internal solution contained (in mm): 140 potassium gluconate, 0.2 EGTA, 10 Hepes, 10 KCl, 0.9 MgCl2, 4 MgATP, 0.3 NaGTP and 20 phosphocreatine (Na+); pH was adjusted to 7.2–7.3 with 1 mm KOH and the osmolarity was 280–290 mosmol l−1. The ACSF for voltage‐clamp experiments contained (in mm): 85.09 NaCl, 30 TEA, 2.5 KCl, 26 NaHCO3, 1.25 NaH2PO4, 20 d‐glucose, 0.4 ascorbic acid, 2.0 CaCl2 and 2.0 pyruvic acid. Tetrodotoxin (0.5 μm) was added to prevent generation of action potentials. All recordings were obtained in a low Mg2+ (10 μm MgSO4) and in the presence of glycine (10 μm) in order to facilitate measurements of NMDA currents (I NMDA), as we previously reported (Fleming et al. 2011). I NMDA was activated either by focal, transient application of NMDA via a picospritzer or via bath application of NMDA. I NMDA was also activated by inducing buildup of extracellular glutamate levels following blockade of glutamate transporters with (3S)‐3‐[[3‐[[4‐(trifluoromethyl)benzoyl]amino]phenyl]methoxy]‐l‐aspartic acid (TF‐TBOA, 500 nm). I NMDA was quantified as the change in the holding current measured as the average of a 2 min segment of steady‐state baseline obtained before and after a 10 min application of NMDA, APV or TF‐TBOA. The voltage‐dependent properties of activation of I A were assessed before and after NMDA, APV or TF‐TBOA application (when a new steady‐state current was achieved), using conventional protocols (depolarizing command steps from −70 to +20 mV in 10 mV increments, for 200 ms, which were preceded by a hyperpolarizing preconditioning pulse to −100 mV for 500 ms) (see Fig. 1 Ba and Sonner et al. 2008). To better isolate I A from other outward K+ currents (e.g. delayed rectifier K+ current) recordings of I A were obtained in the presence of tetraethylammonium (TEA) (Sonner et al. 2008, 2011). To determine the I A half‐activation potential, current amplitudes normalized to the maximum peak were plotted as a function of the command step potentials and fitted with a Boltzmann function. I A and I NMDA current densities were determined by dividing the current amplitude by the cell capacitance, obtained by integrating the area under the transient capacitive phase of a 5 mV depolarizing step pulse, in voltage clamp mode.
Figure 1. NMDAR activation by exogenous NMDA mediates a smaller I A inhibition in MNCs from RVH rats.
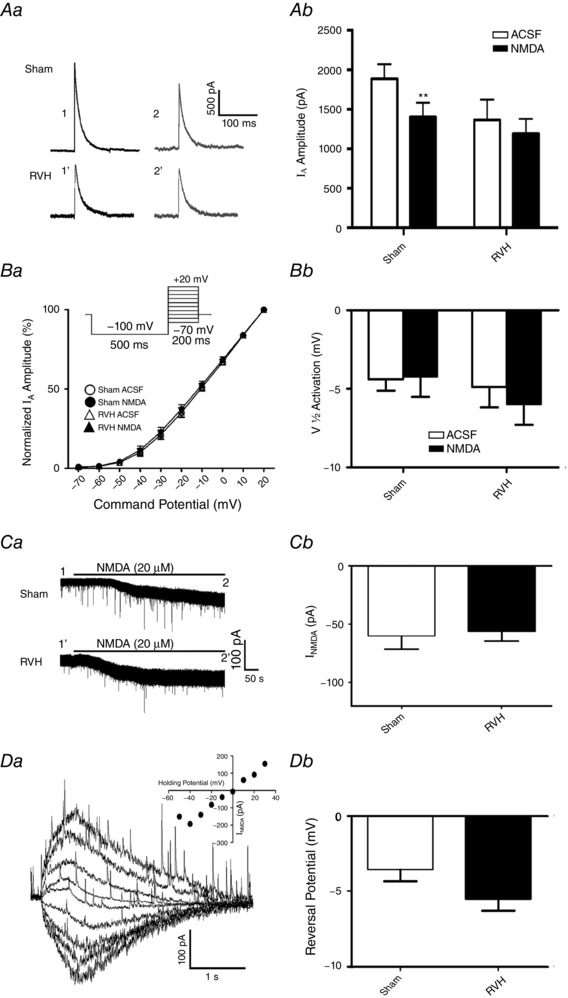
Aa, representative example of I A (−20 mV command step) before (1) and during (2) NMDA (20 μm) bath application in MNCs from a sham and RVH rat. Time points 1 and 2 correspond to the same ones as shown in Ca. Ab, summary data of mean I A amplitude before (open bars) and during (filled bars) NMDAR activation in sham and RVH rats (n = 8/group). Ba, plots of mean normalized I A current amplitude vs. the command potential fitted with Boltzmann functions in MNCs from sham and RVH rats before and during NMDA application (n = 8 per group). Inset: protocol used to evoke I A. Bb, summary data of mean I A half‐activation potentials in MNCs from sham and RVH rats before and during NMDA application. Ca, bath‐applied NMDA (20 μm) induced an inward shift in holding current (I NMDA) in both MNCs from sham and RVH rat. Time points 1 and 2 correspond to the time points where I A was evoked in Aa. Cb, summary data of mean I NMDA magnitude in MNCs from sham and RVH rats before and during NMDA application (n = 8 per group). Da, representative example in a MNC from a sham rat of focally evoked NMDA currents (picospritzer, 100 μm, 4 p.s.i., 500 ms), while holding the neuron at varying holding potentials (from −50 to +30 mV in 10 mV increments). Inset: I–V plot of the evoked I NMDA in the representative cell. Db, summary data of the mean I NMDA reversal potential in MNCs from sham and RVH rats (n = 5 and 6, respectively). ** P < 0.01.
Current clamp
The ACSF for current‐clamp experiments contained (in mm): 119 NaCl, 2.5 KCl, 26 NaHCO3, 1.25 NaH2PO4, 20 d‐glucose, 0.4 ascorbic acid, 2.0 CaCl2 and 2.0 pyruvic acid. The internal solution was the same as that used for voltage‐clamp recordings. Current clamp protocols were run with an output gain of 5 and a Bessel filter of 10 kHz. To calculate peak changes in firing rate, action potentials were detected and plots of mean firing rate (Hz, 2 s bins) vs. time were generated using Mini Analysis 6.0.7 (Synaptosoft, Decatur, GA, USA). From those plots, the peak firing rate was calculated from an average of 5 bins around the peak value. Mean membrane potential values (V m) were calculated from 5 s segments before and at the beginning of the evoked firing discharge (including only periods lacking action potentials) using pCLAMP software.
Quantitative real‐time PCR
Sham and RVH rats were deeply anaesthetized with sodium pentobarbital and whole brains were rapidly collected and immediately frozen. Brains were then mounted in a cryostat (Leica CM3050S), and SON microdissections (900 μm) were obtained following Paxinos and Watson (1997 (SON, −0.8 to −1.8 from bregma). Using a stainless steel punch needle of 1.5 mm diameter, bilateral SON samples were collected and transferred to a microtube with RNAlater reagent (ThermoFisher, Waltham, MA, USA) and stored at 4°C for a maximum of 24 h. Total RNA was isolated from each sample using TRIzol reagent (ThermoFisher), according to manufacturer's instructions. RNA concentration was determined by NanoDrop Spectrophotometer (ThermoFisher), and only 250 ng of RNA in each sample was used for cDNA synthesis using iScript cDNA Synthesis kit (Bio‐rad, Hercules, CA, USA) according to manufacturer's instructions. PCR amplification was performed using a mixture containing: 1 μl of 10 μm sense primer, 1 μl of 10 μm antisense primer, 10 μl of 2× master mix buffer (Power SYBR Green Master Mix; ThermoFisher), 2 μl of the cDNA template, and 6 μl of diethylpyrocarbonate (DEPC) water. The following primers were used: NR1 forward 5′‐ATAGTGACAATCCACCAAGAG CC‐3′ and reverse 5′‐GTAGCTCGCCCATCATTCCGTT‐3′; NR2A forward 5′‐CCTCGAACCCTTCAGTGCCT‐3′ and reverse 5′‐AATGGCTGAGACGATGAGCAG‐3′; NR2B forward 5′‐TCTGCCTTCTTAGAGCCATTCAG‐3′ and reverse 5′‐AGACAGCCACCGCAGAAAC‐3′; NR2C forward 5′‐CCCCCTCAGCTTTTCTGGAG‐3′ and reverse 5′‐GATGGCAACCACCGTGAGA‐3′; NR2D forward 5′‐CGAGCCCTACAGCCCTGC‐3′ and reverse 5′‐ GGACTGAGGTACTCAAAGATGAAAACT‐3′; GLT1 forward 5′‐CCATCCGAGGAGGCCAATAC‐3′ and reverse 5′‐CAAGCAGGCGATACCCAGC ‐3′; GLAST forward 5′‐GCAAGCGGACGCTCCTGGCCA‐3′ and reverse 5′‐GCCGCCATTCCTGTGACAAGAC‐3′; β‐actin forward 5′‐GACCCAGATCATGTTTGAGACCTT‐3′ and reverse 5′‐CACAGCCTGGATGGCTACGTA‐3′. All primers were synthesized by Integrated DNA Technologies. Quantitative real‐time PCR was performed using Applied Biosystems Fast 7500 Real‐Time PCR System. The annealing temperature in the thermal cycler was 60°C and 40 cycles were performed. Each PCR was performed in duplicate. Water instead of cDNA was used as a negative control. A housekeeping gene (β‐actin) was run for each cDNA sample. Determination of gene transcript in each sample was obtained by the ΔΔC T method. For each sample, the threshold cycle (C T) of mRNA was measured and normalized to the average of the housekeeping genes (ΔC T = C T unknown − C T housekeeping genes). To assess differences between sham and RVH in the expression of NR1‐NR2 subunit mRNA as well as GLT1/GLAST mRNA, the fold change of mRNA in the unknown sample (RVH) relative to control group (sham) was determined by , where ΔΔC T = ΔC T unknown − ΔC T sham. To determine if the relative expression of individual NR2 subunits relative to the NR1 subunit was different between sham and RVH rats, the fold change of mRNA in the unknown sample (NR2 subunits) relative to control subunit (NR1) was determined by , where ΔΔC T = ΔC T unknown − ΔC T NR1. Data are shown as a relative mRNA expression to the sham group or the NR1 subunit (Reis et al. 2016).
Statistical analysis
All values are expressed as means ± SEM. Drug effects in sham and RVH rats were assessed using two‐way analysis of variance repeated measures (ANOVA‐RM), as indicated. Where the F ratio was significant, post hoc comparisons were completed using the Bonferroni post hoc test or Dunnett's multiple comparison tests when comparing values against a basal control. When needed, and as indicated, Student's unpaired t test was used to compare basal differences between sham and RVH rats. Pearson's correlation test was used to determine if correlations existed between two parameters. Differences were considered statistically significant at P < 0.05 and n refers to the number of cells. Statistical significance was tested at the 95% (P < 0.05) confidence level. All statistical analyses were conducted using GraphPad Prism (GraphPad Software, San Diego, CA, USA).
Results
Blunted NMDAR‐mediated I A inhibition following exogenously applied NMDA in hypertensive rats
Whole‐cell patch clamp recordings were obtained from a total of 133 SON MNCs in sham (n = 66 from 14 rats) and RVH (n = 67 from 20 rats) both for voltage‐clamp and current‐clamp recordings. As we previously reported in presympathetic PVN–rostral ventrolateral medulla neurons (Sonner et al. 2008, 2011), when the basal I A magnitudes evoked at a command potential of −20 mV in the different experiments performed were pooled together, we found a significantly smaller I A magnitude in MNCs from RVH compared to MNCs from sham rats (Sham: 1870.0 ± 113.5 pA; RVH: 1364.0 ± 174.7 pA, P = 0.02, n = 20 and 21, respectively). However, due to large cell‐to‐cell variability, this difference was only significant when basal data were pooled.
As we recently reported in control rats (Fleming et al. 2011), bath‐applied NMDA (20 μm) inhibited I A in MNCs in sham rats (n = 10, 24.6 ± 6.0% inhibition, P = 0.002; Fig. 1 A). Conversely, NMDA failed to inhibit I A in MNCs from RVH rats (n = 8, −0.8 ± 13.3% inhibition, P = 0.3; Fig. 1 A). Similar results were obtained when data were expressed as current density (Sham: before NMDA, 41.9 ± 7.1 pA pF−1; after NMDA, 31.2 ± 5.5 pA pF−1, P = 0.01; RVH: before NMDA, 33.0 ± 6.4 pA pF−1; after NMDA, 28.5 ± 4.5 pA pF−1, P = 0.3).
Mean normalized current–voltage (I–V) plots showed that the voltage‐dependent activation properties of I A in sham and RVH rats were not affected following NMDAR activation (Fig. 1 B). In fact, no differences in V 1/2 activation were observed among groups (Fig. 1 B, two‐way ANOVA: P = 0.6 for both factors: experimental group × drug treatment).
Importantly, the magnitude of the NMDA‐evoked current (I NMDA) was similar between the two groups (Fig. 1 C, P = 0.8) even when results were expressed as current density (Sham: −1.4 ± 0.4 pA pF−1; RVH: −1.4 ± 0.2 pA pF−1, P = 0.9). Moreover, we found no significant correlations between the magnitude of I NMDA and the degree of I A inhibition in both groups (Pearson r 2: −0.26 and −0.56 for sham and RVH, respectively, P > 0.05 in both cases).
To determine whether the reversal potential of I NMDA was altered in RVH rats, brief puffs of NMDA (100 μm, 500 ms duration) were focally applied to recorded neurons in sham and RVH rats while holding the neuron at varying membrane potentials (from −50 mV to +30 mV). As shown in Fig. 1 D, I NMDA reversal potential was similar between sham and RVH rats (P = 0.11, n = 5 and 6, respectively).
NMDAR subunit expression in the SON of sham and hypertensive rats
NMDARs are formed by molecular assemblies of the NR1 subunit with one of the NR2 subunits (A–D), and particular molecular assemblies determine several biophysical and anatomical properties of NMDARs, including ion permeability, kinetics and topographical localization (Monyer et al. 1992). To assess whether changes in NMDAR subunit expression occurred during hypertension, we performed quantitative real‐time PCR to measure NR1‐NR2(A–D) mRNA expression levels in SON punches (n = 7 in each group). We first compared the relative expression of each NMDAR subunit between sham and RVH rats. As shown in Fig. 2 A, no significant differences between sham and RVH rats were observed for any particular subunit. We next examined the relative expression of each NR2 subunit type (relative to NR1 subunit expression) in sham and RVH rats. As shown in Fig. 2 B, we found the NR2B subunit mRNA to be the most abundantly expressed in the SON of both sham and RVH rats (P < 0.001 vs. all other subunits, Bonferroni's post hoc test). No significant differences were observed in the relative expression of each NR2 subunit between sham and RVH rats. Taken together, these results argue against changes in NMDAR subunit expression/composition as a mechanism contributing to blunted NMDAR‐mediated I A inhibition in RVH rats.
Figure 2. NMDAR subunit mRNA expression in the SON of sham and RVH rats.
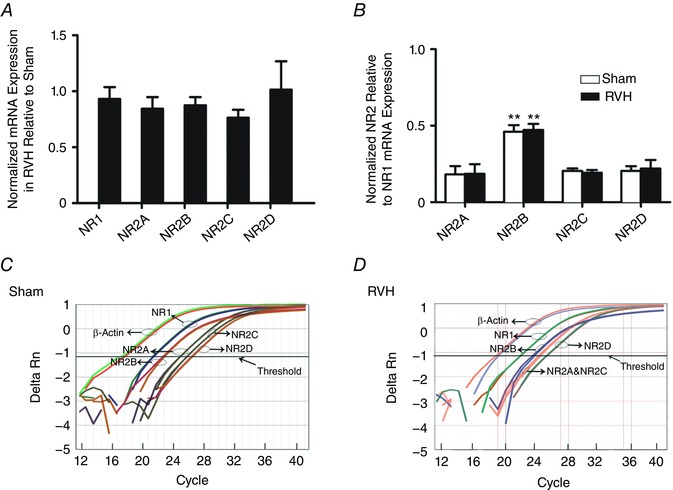
A, summary data of normalized mRNA expression for NR1 and NR2A–D subunits in the SON of RVH rats relative to sham rats (n = 7 per group). B, summary data of normalized mRNA expression of NR2A–D relative to NR1 in sham and RVH rats (n = 7 per group). C and D, representative examples of quantitative real‐time PCR amplification curves for NR1 and NR2A–D, tested against the reference gene β‐actin in the SON of a sham (C) and an RVH (D) rat. The cycle numbers at which the respective lines crossed the x‐axis are their threshold values (C T). Note that NR1 mRNA crossed the x‐axis at an earlier cycle number than all NR2 subunits, and that the NR2B mRNA crossed the x‐axis at an earlier cycle number than the other NR2 subunits, indicating highest expression for NR1 followed by the NR2B subunit. ** P < 0.001 vs. all other subunits within each group. [Color figure can be viewed at wileyonlinelibrary.com]
I A is tonically inhibited by an elevated endogenous eNMDAR tone during hypertension
We previously reported that SON MNCs are under the influence of a tonic glutamate excitatory modality mediated by the sustained activation of extrasynaptic NMDARs (eNMDARs) by ambient glutamate levels (Fleming et al. 2011). To determine whether this eNMDAR‐mediated tone was enhanced in RVH rats, and whether it contributed to I A inhibition during hypertension, we compared the effects of an NMDAR blocker per se on membrane potential (V m), firing activity, I holding and I A both in sham and RVH rats. As shown in Fig. 3 A and B, we found that while bath‐applied APV (100 μm) significantly hyperpolarized and completely inhibited firing activity of MNCs in RVH rats (P < 0.0001 for both, n = 8), a smaller and statistically insignificant effect was observed in sham rats (P = 0.9 and 0.2 for V m and firing rate, respectively, n = 5). Moreover, APV induced a significantly larger outward shift in I holding in RVH, compared to sham rats (P = 0.03, n = 10 and 13 in sham and RVH, respectively, Fig. 3 C and D) indicative of a larger eNMDAR‐mediated tone during hypertension. Finally, while APV did not affect I A magnitude in sham rats, it significantly enhanced it in RVH rats (P < 0.05, Fig. 3 E and F). Similar results were obtained when data were expressed as current density (Sham: before APV, 36.8 ± 7.2 pA pF−1; after APV, 37.4 ± 6.1 pA pF−1; RVH: before APV, 40.8 ± 10.4 pA pF−1; after APV, 55.6 ± 16.4 pA pF−1, P = 0.05).
Figure 3. An elevated endogenous NMDAR tone in RVH rats tonically inhibits I A .
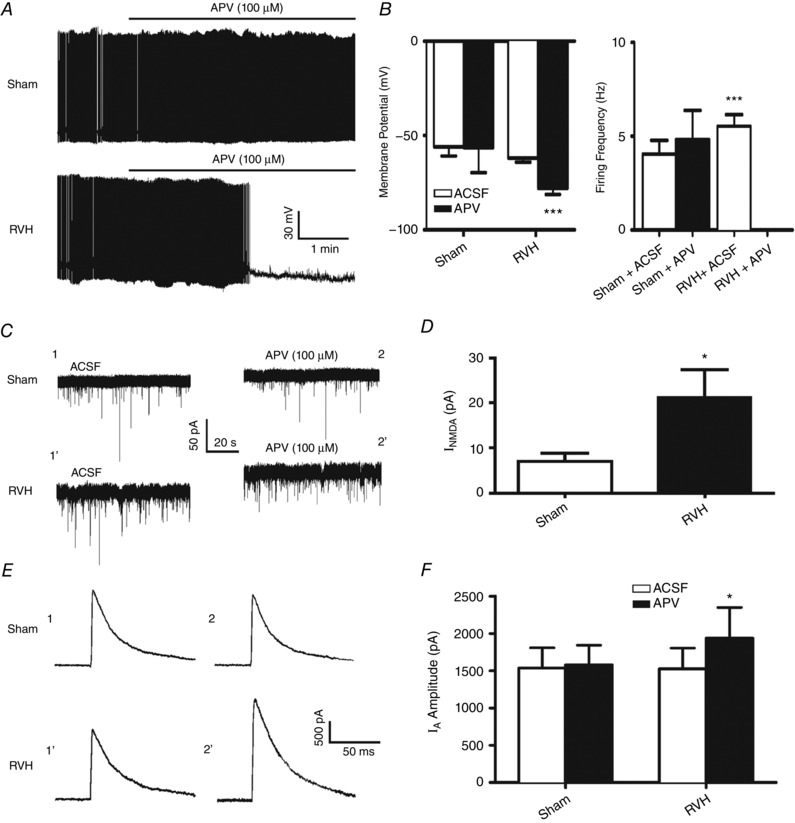
A, representative samples from MNCs from a sham and RVH rat showing that blockade of NMDAR (APV 100 μm) strongly hyperpolarized and inhibited ongoing firing activity in the RVH but not in the sham rat. B, summary data of mean membrane potential (V m) and firing frequency in MNCs from sham and RVH rats, n = 5 and 8, respectively) before and after APV application. C, representative samples from MNCs from a sham and RVH rat showing that blockade of NMDARs (APV, 100 μm) induced an outward shift in the holding current (I NMDA). The representative segments shown were taken just before APV application (ACSF) and 8.5 min in APV. Note the larger I NMDA observed in the MNC from the RVH rat. D, summary data of mean I NMDA in MNCs from sham and RVH rats (n = 8 and 13, respectively). E, representative examples of I A (command step to −20 mV) before and during APV (100 μm) in the same sham and RVH rat as in A. Time points 1 and 2 correspond to the same ones as shown in C. F, summary data of mean I A amplitude evoked before and during NMDAR blockade (APV) in MNCs from sham and RVH rat (n = 8 and 13, respectively). * P < 0.05 and *** P < 0.0001 vs. respective control.
An enhanced glutamate transporter activity during hypertension is insufficient to compensate for the elevated endogenous glutamate tone
We recently showed that the basal level of tonic eNMDAR‐mediated excitation in MNCs is largely determined by the activity of glutamate transporters (GLTs), which in the SON are largely expressed in astrocytes (Fleming et al. 2011; Stern et al. 2016). Thus, we aimed to determine whether the larger tonic eNMDAR tone we found in RVH rats was due to a blunted GLT activity in the SON. To this end, we used TF‐TBOA, a potent and selective GLT blocker, displaying IC50 values of 22 nm and 17 nm for EEAT1 (GLAST) and EEAT2 (GLT1), respectively (Shimamoto et al. 2004). At a concentration of 500 nm (used in this study), TF‐TBOA was reported to have maximal inhibition for glutamate transporter activity (Tsukada et al. 2005; Bozzo & Chatton, 2010) without having a direct effect on neuronal membrane properties or network firing activity (Bozzo & Chatton, 2010). As shown in Fig. 4 A and B, we found that bath application of TF‐TBOA (500 nm) induced an inward shift in I holding that was significantly larger in RVH compared to sham rats (P < 0.001, n = 15 and 12 in sham and RVH, respectively). Thus, contrary to our hypothesis of a reduced glutamate transport function in RVH rats, our results showing an enhanced TF‐TBOA‐mediated I NMDA in RVH rats are indicative of an increased GLT activity, which may act as a compensatory mechanism to the elevated ambient glutamate levels observed in this condition.
Figure 4. Enhanced glutamate transporter activity in RVH rats.
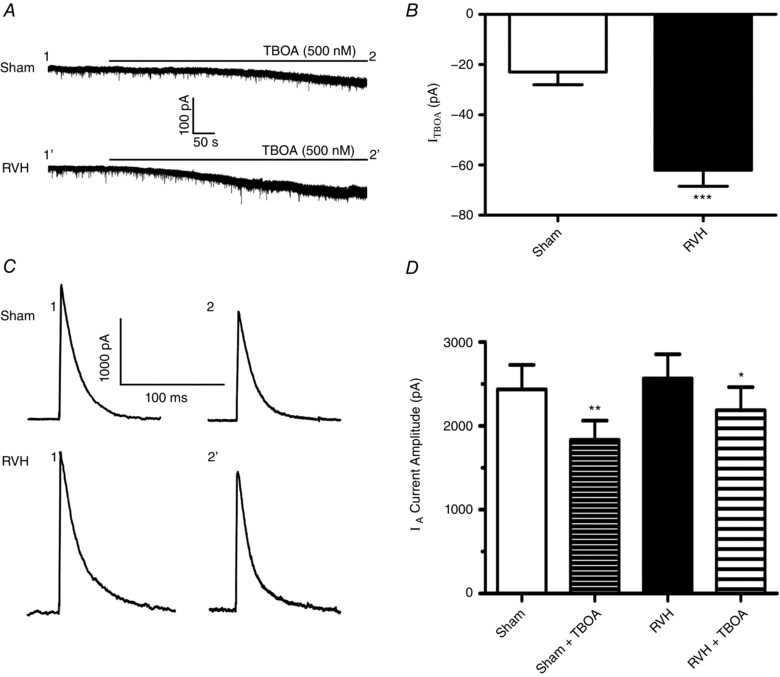
A, representative samples from MNCs from a sham and RVH rat showing that blockade of glutamate transporters (TF‐TBOA, 500 nm) induced an inward shift in the holding current (I TF‐TBOA). B, summary data of mean I TF‐TBOA in MNCs from sham and RVH rats (n = 15 and 12, respectively). C, representative examples of I A (command step to −20 mV) before and during TF‐TBOA in the same sham and RVH rat as in A. Time points 1 and 2 correspond to those shown in A. D, summary data of mean I A amplitude evoked before and during TF‐TBOA in MNCs from sham and RVH rats (n = 15 and 12, respectively). * P < 0.02, ** P < 0.001, and *** P < 0.0001 vs. respective controls.
Despite the larger TF‐TBOA‐mediated I NMDA in RVH rats, we found that I A in this group was inhibited to a lesser extent following bath application of TF‐TBOA (Fig. 4 C and D). Thus, the mean percentage inhibition evoked by TF‐TBOA was significantly smaller in MNCs from RVH compared to those in sham rats (Sham: 24.7 ± 4.1%; RVH: 13.0 ± 4.0%, P < 0.05). Similar results were obtained when data were expressed as current density (Sham: before TF‐TBOA, 55.0 ± 6.7 pA pF−1; after TF‐TBOA, 40.3 ± 6.0 pA pF−1 (P = 0.0008); RVH: before TF‐TBOA, 68.1 ± 7.9 pA pF−1; after TF‐TBOA, 59.0 ± 7.0 pA pF−1, P = 0.03).
To determine if the expression levels of GLTs were altered in RVH rats, we performed quantitative real‐time PCR to measure the mRNA expression level of the two major GLT isoforms, GLT1 and GLAST, in SON punches (n = 9 in each group). As shown in Fig. 5, no changes in mRNA levels for GLT1 and GLAST were observed between sham and RVH rats.
Figure 5. GLT1 and GLAST glutamate transporter mRNA expression in the SON of sham and RVH rats.
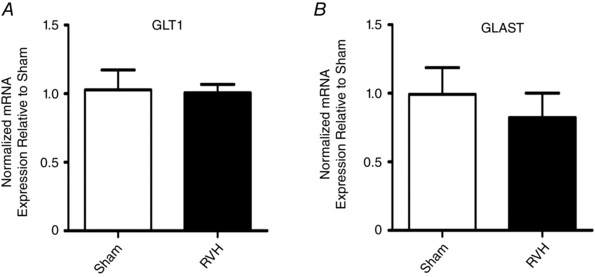
Summary data of normalized mRNA expression for GLT1 (A) and GLAST (B) in the SON of RVH rats relative to sham rats (n = 9 and 13, respectively). *** P < 0.001 vs. sham.
Finally, to determine whether the enhanced GLT activity acted indeed as a compensatory mechanism, preventing or restraining a larger endogenous glutamate‐mediated excitatory drive in RVH rats, we performed current‐clamp experiments in which we monitored the effects of GLT blockade on SON firing activity. We previously showed that in control rats, GLT blockade results in a glutamate‐mediated eNMDAR‐dependent depolarization and increased firing rate (Fleming et al. 2011; Stern et al. 2016). Thus, in order to quantify and compare the degree of depolarization and increase in firing rate between sham and RVH rats, and to prevent depolarization‐mediated inactivation of Na+ channels, neurons were current‐clamped at ∼−60 mV before TF‐TBOA application. As shown in Fig. 6 A, bath‐applied TF‐TBOA (500 nm, 5 min) in MNCs from sham rats (n = 16) resulted in a gradual, slowly developing depolarization, which, with a delay of ∼8 min (Fig. 6 B), evoked firing discharge. Compared to sham rats, TF‐TBOA‐evoked firing discharge in MNCs from RVH rats (n = 18) was initiated with a significantly shorter delay (P < 0.0001, Bonferroni post hoc test, Fig. 6 B). Neither the mean peak firing frequency (Fig. 6 C) nor the mean time from spike initiation to peak firing (Fig. 6 D) were significantly different between sham and RVH rats. To determine if the differences in TBOA‐evoked firing activity between sham and RVH rats were dependent on I A, we repeated a set of experiments in which I A was previously blocked by bath‐applied 4‐aminopyridine (4AP) (5 mm) (n = 10 in both sham and RVH rats). As shown in Fig. 6 A and B, the delay to spiking evoked by TF‐TBOA application in the presence of 4AP in sham rats was significantly reduced compared to sham control (P < 0.0001, Bonferroni post hoc test). Conversely, the delay to spiking evoked by TF‐TBOA in RVH rats was not affected by 4AP. Neither the mean peak firing frequency (Fig. 6 C) nor the mean time from spike initiation to peak firing (Fig. 6 D) were affected by 4AP.
Figure 6. Blockade of glutamate transporter activity evokes a faster firing discharge in RVH rats.
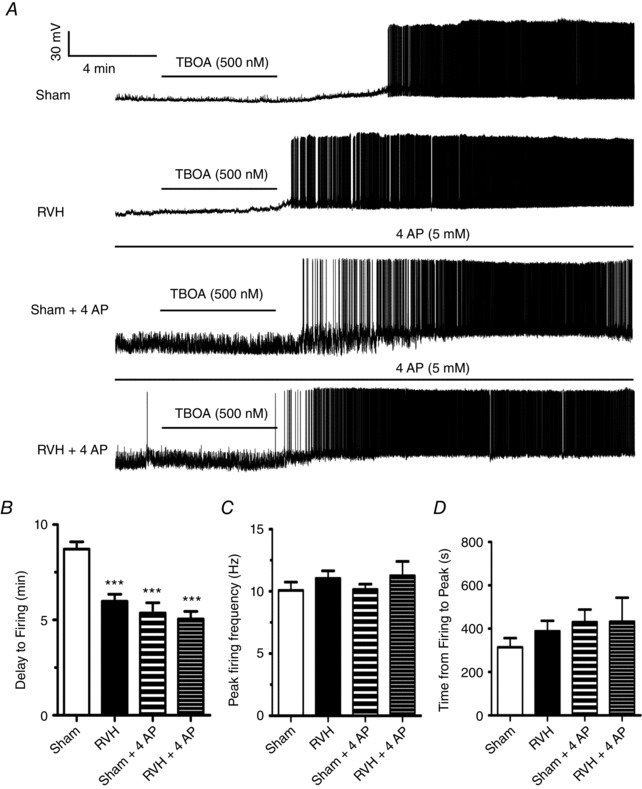
A, representative traces from MNCs from sham and RVH rats showing responses to the glutamate transporter blocker TF‐TBOA (500 nm) in the presence or absence of the I A blocker 4AP (5 mm). TF‐TBOA induced membrane depolarization and evoked firing discharge in all cases. Note, however, that the TF‐TBOA‐evoked firing in the RVH rat occurred with a smaller delay, and that in the presence of 4AP all responses were equalized. B, summary data of mean delay to firing after TF‐TBOA application in MNCs from sham and RVH rats in control ACSF (n = 17 and 19, respectively) and in 4AP (n = 10 and 10, respectively). C, summary data of the mean peak firing evoked by TF‐TBOA in MNCs from sham and RVH rats in control ACSF or in 4AP. D, summary data of the mean time from spike initiation to peak firing evoked by TF‐TBOA in MNCs from sham and RVH rats in control ACSF or in 4AP. *** P < 0.001 vs. sham.
Discussion
Our main findings could be summarized as follows: (1) as we previously reported in normal rats (Naskar & Stern, 2014), activation of eNMDARs by exogenously applied NMDA inhibited I A in MNCs of sham rats. However this inhibition was reduced or absent in RVH rats; (2) neither the magnitude nor the reversal potential of the exogenously evoked I NMDA was altered in RVH rats; (3) no changes in SON NMDAR subunit expression were observed between sham and RVH rats; (4) a larger endogenous glutamate tone, resulting in the sustained activation of eNMDARs, tonically inhibited I A in RVH rats, contributing also to higher ongoing firing activity during hypertension; (5) the enhanced endogenous glutamate tone in RVH rats was not due to blunted glutamate transporter activity. Rather, a higher glutamate transporter activity was observed, a compensatory mechanism that was, however, insufficient to prevent the elevated endogenous glutamate tone leading to a near maximal inhibitory coupling between NMDARs and I A in hypertensive rats.
Blunted NMDAR‐mediated inhibition of I A in MNCs from hypertensive rats in response to exogenously applied NMDA
A large body of evidence supports glutamate, acting mostly on NMDARs, and the voltage‐gated transient K+ current I A, as two key factors that influence SON and PVN neuronal activity (Bourque, 1988; Hu & Bourque, 1992; Nissen et al. 1995; Luther & Tasker, 2000). Moreover, we recently showed that extrasynaptic NMDARs (eNMDARs) are negatively coupled to I A via a Ca2+‐dependent intracellular pathway (Naskar & Stern, 2014). Importantly, we and others previously reported that a blunted I A expression/function in the SON, PVN and the NTS contributed to increased neuronal activity during hypertension (Belugin & Mifflin, 2005; Sonner et al. 2008, 2011), whereas an increased glutamate excitatory function, including enhanced expression of NMDARs, was reported both in hypertensive and heart failure rats (Li & Pan, 2007; Zheng et al. 2011; Gabor & Leenen, 2012; Li et al. 2014; Glass et al. 2015). However, whether the elevated glutamate excitatory function and the blunted I A inhibitory function in hypertensive rats are functionally and causally related is unknown.
We found that the NMDA‐mediated inhibition of I A in response to exogenously applied NMDA that we reported both in normal and in sham rats was diminished in RVH rats. The fact that we observed a similar magnitude of NMDA‐evoked current (I NMDA) between sham and RVH rats supports the idea that the blunted inhibition of I A by exogenous NMDA was not due to a diminished function and/or expression of NMDARs. This was further supported by our findings showing (a) no changes in the overall or relative expression pattern of NR1 and NR2A–D subunits between sham and RVH rats, and (b) no changes in the reversal potential of the evoked I NMDA. It is important to emphasize that we thoroughly demonstrated in a previous set of studies that the tonic I NMDA, and its negative coupling to I A, was mediated by activation of eNMDARs (Fleming et al. 2011; Potapenko et al. 2012b; Naskar & Stern, 2014). Thus, we felt it was unnecessary to repeat this characterization here. Also, we showed that the tonic I NMDA represented a large proportion of the total glutamate‐mediated charge transfer in MNCs, and that it was strongly sensitive to ifenprodil, an NR2B subunit‐specific blocker (Fleming et al. 2011). In line with these previous findings, we report here that the NR2B subunit mRNA is the most abundantly expressed NR2 subunit in the SON, and that the lack of changes in expression levels of this subunit during hypertension (along with our electrophysiological results) argues also against a change in the expression/function of eNMDARs during hypertension. An important caveat from these studies is that SON punches contain not only neurons, but also astrocytes, among others cells, which can also express NMDARs (Verkhratsky & Kirchhoff, 2007; Dzamba et al. 2013; Jimenez‐Blasco et al. 2015). While this has been shown in other brain areas, it is at present unknown, however, whether SON astrocytes also express NMDARs. Moreover, it is important to take into account that levels in mRNA expression do not necessarily reflect as levels of corresponding proteins.
An elevated endogenous glutamate tone contributes to I A inhibition during hypertension
We reasoned that another possible mechanism determining a blunted responsiveness of I A to exogenously applied NMDA in RVH rats was that the negative coupling between NMDAR and I A was near maximally driven by an augmented endogenous glutamate tone in hypertensive rats. Our results showing that the NMDAR blocker APV per se induced a more robust membrane hyperpolarization and inhibition of ongoing firing discharge in MNCs from RVH rats compared to those from sham rats supports a larger endogenous glutamate, NMDAR‐mediated tone in hypertensive rats. In agreement, we also found that APV induced a larger outward shift in I holding in RVH compared to sham rats, supporting again a larger endogenous I NMDA in the former. Finally, we found that while APV did not affect I A magnitude in sham rats, it significantly increased it in RVH rats. Taken together, these studies support the view that an elevated endogenous glutamate tone, via activation of eNMDARs, tonically inhibits I A in MNCs of RVH rats. This in turn probably explains the diminished I A inhibition we observed in RVH rats following exogenously applied NMDA, due to an already near maximal inhibition of I A by the elevated endogenous tone.
We previously showed that the magnitude of the endogenous tonic I NMDA in MNCs is tightly controlled by the activity of glutamate transporters (GLTs) (Fleming et al. 2011; Potapenko et al. 2012b; Naskar & Stern, 2014), which actively remove glutamate from the extracellular space, constraining eNMDAR activation (Rothstein et al. 1996). Thus, to address whether a blunted GLT function contributed to the enhanced glutamate tone in hypertensive rats, we tested the effects of the GLT blocker TF‐TBOA on both I NMDA and firing activity in sham and RVH rats. Contrary to our initial hypothesis, we found that rather than inducing a smaller shift in I holding (indicative of a blunted GLT activity), TF‐TBOA evoked a larger I NMDA in RVH compared to sham rats. However, a reduced inhibition of I A was observed in spite of the larger I NMDA evoked in hypertensive rats. Taken together, these results are in line with the notion that the increased activity of GLTs may serve as a compensatory mechanism to cope with an elevated glutamate tone. However, this compensatory mechanism was insufficient to efficiently prevent the elevated endogenous glutamate tone that leads to a near maximal inhibitory coupling between NMDARs and I A in hypertensive rats. Finally, to determine the physiological impact of these changes on MNC excitability, we performed current clamp experiments. We found that TF‐TBOA evoked a more rapid membrane depolarization and firing discharge in MNCs from RVH compared to sham rats, suggesting again that a higher endogenous glutamate tone was generated in the latter. In line with the fact that I A was already largely inhibited in RVH rats, we found that 4AP did not change the response to TBOA in this experimental group. Conversely, in sham rats TBOA in the presence of 4AP evoked a faster response, similar to that observed in RVH rats (i.e. responses were equalized across experimental groups). These results indicate that the overall effect of GLT blockade on firing discharge results not only from the direct excitatory effect mediated by the increase in ambient glutamate level as a consequence of decreased glutamate uptake, but also by the degree of basal I A availability, which is also in part determined by the basal endogenous glutamate tone its negative coupling to I A. Thus in hypertensive rats, the diminished I A availability contributes to an increased excitatory response to a further increase in endogenous glutamate levels following GLT blockade. A similar effect is observed in sham rats when I A availability is pharmacologically diminished with 4AP.
The mechanism contributing to the increased GLT function in hypertensive rats remains unknown. Our results showing no changes in GLT1 and GLAST mRNA levels argue against an increased GLT expression as a contributing factor. A growing body of evidence indicates that GLTs can also be modulated post‐transcriptionally, and that their function can change in an activity‐dependent manner or during disease conditions. For example, we recently showed that GLT1, a subtype predominantly expressed in astrocytes, is inhibited by angiotensin II in the SON and PVN (Stern et al. 2016). Moreover, we also showed SON GLT function to be blunted during a physiological challenge such as an osmotic stimulation (Fleming et al. 2011) and to be enhanced during heart failure (Potapenko et al. 2012a). Evidently, further studies are warranted to continue investigating changes in the expression/function of GLTs in disease conditions.
Finally, another important question is what is the precise source contributing to the elevated endogenous glutamate tone leading to sustained eNMDAR activation in hypertensive rats. One possibility is spillover of glutamate from active glutamatergic synapses. We previously showed that under basal conditions in normal rats, synaptic glutamate does not contribute to tonic I NMDA mediated by eNMDARs (Fleming et al. 2011). However, it is likely that under conditions of high glutamate synaptic activity (Li et al. 2008) or an increased innervation density (Biancardi et al. 2010), as previously reported in hypertensive rats, spillover of glutamate could contribute to higher tonic eNMDAR activation and diminished I A magnitude. This will need to be further explored in future studies. Under pathological conditions, reverse GLT activity could contribute to an excess of glutamate in the extracellular space (Grewer et al. 2008). However, our results showing that blockade of GLT activity with TF‐TBOA never evoked an outward shift in I holding, an effect that would be expected if glutamate were released by reverse transport activity, argue against reverse GLT activity as a contributing factor in hypertensive rats.
Despite the fact that a direct correlation between the degree and pattern of MNC firing activity and systemic hormone release is well established (Cazalis et al. 1985), and the fact that enhanced circulating levels of vasopressin have been demonstrated in renovascular hypertension (Mohring et al. 1978; Woods & Johnston, 1982; Ichikawa et al. 1983; Johnston, 1985; Hinojosa et al. 1986; Lariviere et al. 1988), future in vivo studies will be needed to determine whether the cellular mechanisms reported in this in vitro study translate to the whole animal level.
Additional information
Competing interests
None declared.
Author contributions
M.Z. carried out the experiments, analysed, interpreted data and contributed to manuscript writing. V.C.B. carried out all surgical procedures and blood pressure monitoring of sham and hypertensive rats. J.E.S. advised on the experiments and the analysis, and wrote the manuscript. All authors have approved the final version of the manuscript and agree to be accountable for all aspects of the work. All persons designated as authors qualify for authorship and all those who qualify for authorship are listed.
Funding
This work was supported by a National Heart, Lung, and Blood Institute grant (R01 HL112225 to J.E.S.).
Author's present address
V. C. Biancardi: Department of Anatomy, Physiology and Pharmacology, College of Veterinary Medicine, Auburn University, Auburn, AL 36849, USA.
Linked articles This article is highlighted by a Perspective by Kline. To read this Perspective, visit https://doi.org/10.1113/JP274541.
References
- Belugin S & Mifflin S (2005). Transient voltage‐dependent potassium currents are reduced in NTS neurons isolated from renal wrap hypertensive rats. J Neurophysiol 94, 3849–3859. [DOI] [PubMed] [Google Scholar]
- Biancardi VC, Campos RR & Stern JE (2010). Altered balance of gamma‐aminobutyric acidergic and glutamatergic afferent inputs in rostral ventrolateral medulla‐projecting neurons in the paraventricular nucleus of the hypothalamus of renovascular hypertensive rats. J Comp Neurol 518, 567–585. [DOI] [PMC free article] [PubMed] [Google Scholar]
- Bourque CW (1988). Transient calcium‐dependent potassium current in magnocellular neurosecretory cells of the rat supraoptic nucleus. J Physiol 397, 331–347. [DOI] [PMC free article] [PubMed] [Google Scholar]
- Bozzo L & Chatton JY (2010). Inhibitory effects of (2S, 3S)‐3‐[3‐[4‐(trifluoromethyl)benzoylamino]benzyloxy]aspartate (TFB‐TBOA) on the astrocytic sodium responses to glutamate. Brain Res 1316, 27–34. [DOI] [PubMed] [Google Scholar]
- Brown CH, Bains JS, Ludwig M & Stern JE (2013). Physiological regulation of magnocellular neurosecretory cell activity: integration of intrinsic, local and afferent mechanisms. J Neuroendocrinol 25, 678–710. [DOI] [PMC free article] [PubMed] [Google Scholar]
- Cazalis M, Dayanithi G & Nordmann JJ (1985). The role of patterned burst and interburst interval on the excitation‐coupling mechanism in the isolated rat neural lobe. J Physiol 369, 45–60. [DOI] [PMC free article] [PubMed] [Google Scholar]
- Cohn JN, Levine TB, Olivari MT, Garberg V, Lura D, Francis GS, Simon AB & Rector T (1984). Plasma norepinephrine as a guide to prognosis in patients with chronic congestive heart failure. N Engl J Med 311, 819–823. [DOI] [PubMed] [Google Scholar]
- Dzamba D, Honsa P & Anderova M (2013). NMDA receptors in glial cells: pending questions. Curr Neuropharmacol 11, 250–262. [DOI] [PMC free article] [PubMed] [Google Scholar]
- Fleming TM, Scott V, Joe N, Naskar K, Brown CH & Stern JE (2011). State‐dependent changes in astrocyte regulation of extrasynaptic NMDA receptor signalling in neurosecretory neurons. J Physiol 589, 3929–3941. [DOI] [PMC free article] [PubMed] [Google Scholar]
- Gabor A & Leenen FH (2012). Central neuromodulatory pathways regulating sympathetic activity in hypertension. J Appl Physiol (1985) 113, 1294–1303. [DOI] [PMC free article] [PubMed] [Google Scholar]
- Glass MJ, Wang G, Coleman CG, Chan J, Ogorodnik E, Van Kempen TA, Milner TA, Butler SD, Young CN, Davisson RL, Iadecola C & Pickel VM (2015). NMDA receptor plasticity in the hypothalamic paraventricular nucleus contributes to the elevated blood pressure produced by angiotensin II. J Neurosci 35, 9558–9567. [DOI] [PMC free article] [PubMed] [Google Scholar]
- Grewer C, Gameiro A, Zhang Z, Tao Z, Braams S & Rauen T (2008). Glutamate forward and reverse transport: from molecular mechanism to transporter‐mediated release after ischemia. IUBMB Life 60, 609–619. [DOI] [PMC free article] [PubMed] [Google Scholar]
- Hinojosa C, Shade RE & Haywood JR (1986). Plasma vasopressin concentration in high sodium renal hypertension. J Hypertens 4, 529–534. [DOI] [PubMed] [Google Scholar]
- Hu B & Bourque CW (1992). NMDA receptor‐mediated rhythmic bursting activity in rat supraoptic nucleus neurones in vitro. J Physiol 458, 667–687. [DOI] [PMC free article] [PubMed] [Google Scholar]
- Ichikawa I, Ferrone RA, Duchin KL, Manning M, Dzau VJ & Brenner BM (1983). Relative contribution of vasopressin and angiotensin II to the altered renal microcirculatory dynamics in two‐kidney Goldblatt hypertension. Circ Res 53, 592–602. [DOI] [PubMed] [Google Scholar]
- Jackson K, Silva HM, Zhang W, Michelini LC & Stern JE (2005). Exercise training differentially affects intrinsic excitability of autonomic and neuroendocrine neurons in the hypothalamic paraventricular nucleus. J Neurophysiol 94, 3211–3220. [DOI] [PubMed] [Google Scholar]
- Jimenez‐Blasco D, Santofimia‐Castano P, Gonzalez A, Almeida A & Bolanos JP (2015). Astrocyte NMDA receptors’ activity sustains neuronal survival through a Cdk5‐Nrf2 pathway. Cell Death Differ 22, 1877–1889. [DOI] [PMC free article] [PubMed] [Google Scholar]
- Johnston CI (1985). Vasopressin in circulatory control and hypertension. J Hypertens 3, 557–569. [DOI] [PubMed] [Google Scholar]
- Lariviere R, St‐Louis J & Schiffrin EL (1988). Vascular vasopressin receptors in renal hypertensive rats. Am J Physiol 255, H693–H698. [DOI] [PubMed] [Google Scholar]
- Li B, Chen N, Luo T, Otsu Y, Murphy TH & Raymond LA (2002). Differential regulation of synaptic and extra‐synaptic NMDA receptors. Nat Neurosci 5, 833–834. [DOI] [PubMed] [Google Scholar]
- Li DP & Pan HL (2007). Glutamatergic inputs in the hypothalamic paraventricular nucleus maintain sympathetic vasomotor tone in hypertension. Hypertension 49, 916–925. [DOI] [PubMed] [Google Scholar]
- Li DP, Yang Q, Pan HM & Pan HL (2008). Pre‐ and postsynaptic plasticity underlying augmented glutamatergic inputs to hypothalamic presympathetic neurons in spontaneously hypertensive rats. J Physiol 586, 1637–1647. [DOI] [PMC free article] [PubMed] [Google Scholar]
- Li DP, Zhu LH, Pachuau J, Lee HA & Pan HL (2014). mGluR5 upregulation increases excitability of hypothalamic presympathetic neurons through NMDA receptor trafficking in spontaneously hypertensive rats. J Neurosci 34, 4309–4317. [DOI] [PMC free article] [PubMed] [Google Scholar]
- Littlejohn NK, Siel RB Jr, Ketsawatsomkron P, Pelham CJ, Pearson NA, Hilzendeger AM, Buehrer BA, Weidemann BJ, Li H, Davis DR, Thompson AP, Liu X, Cassell MD, Sigmund CD & Grobe JL (2013). Hypertension in mice with transgenic activation of the brain renin‐angiotensin system is vasopressin dependent. Am J Physiol Regul Integr Comp Physiol 304, R818–R828. [DOI] [PMC free article] [PubMed] [Google Scholar]
- Luther JA & Tasker JG (2000). Voltage‐gated currents distinguish parvocellular from magnocellular neurones in the rat hypothalamic paraventricular nucleus. J Physiol 523, 193–209. [DOI] [PMC free article] [PubMed] [Google Scholar]
- Mohring J, Mohring B, Petri M & Haack D (1978). Plasma vasopressin concentrations and effects of vasopressin antiserum on blood pressure in rats with malignant two‐kidney Goldblatt hypertension. Circ Res 42, 17–22. [DOI] [PubMed] [Google Scholar]
- Monyer H, Sprengel R, Schoepfer R, Herb A, Higuchi M, Lomeli H, Burnashev N, Sakmann B & Seeburg PH (1992). Heteromeric NMDA receptors: molecular and functional distinction of subtypes. Science 256, 1217–1221. [DOI] [PubMed] [Google Scholar]
- Naskar K & Stern JE (2014). A functional coupling between extrasynaptic NMDA receptors and A‐type K+ channels under astrocyte control regulates hypothalamic neurosecretory neuronal activity. J Physiol 592, 2813–2827. [DOI] [PMC free article] [PubMed] [Google Scholar]
- Nissen R, Hu B & Renaud LP (1995). Regulation of spontaneous phasic firing of rat supraoptic vasopressin neurones in vivo by glutamate receptors. J Physiol 484, 415–424. [DOI] [PMC free article] [PubMed] [Google Scholar]
- Packer M (1988). Neurohormonal interactions and adaptations in congestive heart failure. Circulation 77, 721–730. [DOI] [PubMed] [Google Scholar]
- Packer M, Lee WH, Kessler PD, Gottlieb SS, Bernstein JL & Kukin ML (1987). Role of neurohormonal mechanisms in determining survival in patients with severe chronic heart failure. Circulation 75, IV80–92. [PubMed] [Google Scholar]
- Paxinos G & Watson C (1997). The Rat Brain in Stereotaxic Coordinates, 3rd edn. Academic Press. [DOI] [PubMed] [Google Scholar]
- Potapenko ES, Biancardi VC, Zhou Y & Stern JE (2012a). Altered astrocyte glutamate trasporter regulation of hypothalamic neurosecretory neurons in heart failure rats. Am J Physiol Regul Integr Comp Physiol 303, R291–R300. [DOI] [PMC free article] [PubMed] [Google Scholar]
- Potapenko ES, Biancardi VC, Zhou Y & Stern JE (2012b). Astrocytes modulate a postsynaptic NMDA‐GABAA‐receptor crosstalk in hypothalamic neurosecretory neurons. J Neurosci 33, 631–640. [DOI] [PMC free article] [PubMed] [Google Scholar]
- Reis WL, Biancardi VC, Zhou Y & Stern JE (2016). A functional coupling between carbon monoxide and nitric oxide contributes to increased vasopressin neuronal activity in heart failure rats. Endocrinology 157, 2052–2066. [DOI] [PMC free article] [PubMed] [Google Scholar]
- Riegger GA, Liebau G, Bauer E & Kochsiek K (1985). Vasopressin and renin in high output heart failure of rats: hemodynamic effects of elevated plasma hormone levels. J Cardiovasc Pharmacol 7, 1–5. [DOI] [PubMed] [Google Scholar]
- Rothstein JD, Dykes‐Hoberg M, Pardo CA, Bristol LA, Jin L, Kuncl RW, Kanai Y, Hediger MA, Wang Y, Schielke JP & Welty DF (1996). Knockout of glutamate transporters reveals a major role for astroglial transport in excitotoxicity and clearance of glutamate. Neuron 16, 675–686. [DOI] [PubMed] [Google Scholar]
- Shimamoto K, Sakai R, Takaoka K, Yumoto N, Nakajima T, Amara SG & Shigeri Y (2004). Characterization of novel L‐threo‐β‐benzyloxyaspartate derivatives, potent blockers of the glutamate transporters. Mol Pharmacol 65, 1008–1015. [DOI] [PubMed] [Google Scholar]
- Silverman AJ & Zimmerman EA (1983). Magnocellular neurosecretory system. Annu Rev Neurosci 6, 357–380. [DOI] [PubMed] [Google Scholar]
- Sonner PM, Filosa JA & Stern JE (2008). Diminished A‐type potassium current and altered firing properties in presympathetic PVN neurones in renovascular hypertensive rats. J Physiol 586, 1605–1622. [DOI] [PMC free article] [PubMed] [Google Scholar]
- Sonner PM, Lee S, Ryu PD, Lee SY & Stern JE (2011). Imbalanced K+ and Ca2+ subthreshold interactions contribute to increased hypothalamic presympathetic neuronal excitability in hypertensive rats. J Physiol 589, 667–683. [DOI] [PMC free article] [PubMed] [Google Scholar]
- Stern JE, Son S, Biancardi VC, Zheng H, Sharma N & Patel KP (2016). Astrocytes contribute to angiotensin II stimulation of hypothalamic neuronal activity and sympathetic outflow. Hypertension 68, 1483–1493. [DOI] [PMC free article] [PubMed] [Google Scholar]
- Tasker JG, Oliet SH, Bains JS, Brown CH & Stern JE (2012). Glial regulation of neuronal function: from synapse to systems physiology. J Neuroendocrinol 24, 566–576. [DOI] [PMC free article] [PubMed] [Google Scholar]
- Tovar KR & Westbrook GL (1999). The incorporation of NMDA receptors with a distinct subunit composition at nascent hippocampal synapses in vitro. J Neurosci 19, 4180–4188. [DOI] [PMC free article] [PubMed] [Google Scholar]
- Tsukada S, Iino M, Takayasu Y, Shimamoto K & Ozawa S (2005). Effects of a novel glutamate transporter blocker, (2S, 3S)‐3‐{3‐[4‐(trifluoromethyl)benzoylamino]benzyloxy}aspartate (TFB‐TBOA), on activities of hippocampal neurons. Neuropharmacology 48, 479–491. [DOI] [PubMed] [Google Scholar]
- van den Pol A, Wuarin J & Dudek F (1990). Glutamate, the dominant excitatory transmitter in neuroendocrine regulation. Science 250, 1276–1278. [DOI] [PubMed] [Google Scholar]
- Verkhratsky A & Kirchhoff F (2007). NMDA receptors in glia. Neuroscientist 13, 28–37. [DOI] [PubMed] [Google Scholar]
- Woods RL & Johnston CI (1982). Role of vasopressin in hypertension: studies using the Brattleboro rat. Am J Physiol 242, F727–F732. [DOI] [PubMed] [Google Scholar]
- Yemane H, Busauskas M, Burris SK & Knuepfer MM (2010). Neurohumoral mechanisms in deoxycorticosterone acetate (DOCA)‐salt hypertension in rats. Exp Physiol 95, 51–55. [DOI] [PubMed] [Google Scholar]
- Zheng H, Liu X, Li Y, Sharma NM & Patel KP (2011). Gene transfer of neuronal nitric oxide synthase to the paraventricular nucleus reduces the enhanced glutamatergic tone in rats with chronic heart failure. Hypertension 58, 966–973. [DOI] [PMC free article] [PubMed] [Google Scholar]