

Abstract
Key points
Exercise is a potent physiological stimulus to clear blood glucose from the circulation into skeletal muscle.
The mammalian target of rapamycin complex 2 (mTORC2) is an important regulator of muscle glucose uptake in response to insulin stimulation.
Here we report for the first time that the activity of mTORC2 in mouse muscle increases during exercise.
We further show that glucose uptake during exercise is decreased in mouse muscle that lacks mTORC2 activity.
We also provide novel identifications of new mTORC2 substrates during exercise in mouse muscle.
Abstract
Exercise increases glucose uptake into insulin‐resistant muscle. Thus, elucidating the exercise signalling network in muscle may uncover new therapeutic targets. The mammalian target of rapamycin complex 2 (mTORC2), a regulator of insulin‐controlled glucose uptake, has been reported to interact with ras‐related C3 botulinum toxin substrate 1 (Rac1), which plays a role in exercise‐induced glucose uptake in muscle. Therefore, we tested the hypothesis that mTORC2 activity is necessary for muscle glucose uptake during treadmill exercise. We used mice that specifically lack mTORC2 signalling in muscle by deletion of the obligatory mTORC2 component Rictor (Ric mKO). Running capacity and running‐induced changes in blood glucose, plasma lactate and muscle glycogen levels were similar in wild‐type (Ric WT) and Ric mKO mice. At rest, muscle glucose uptake was normal, but during running muscle glucose uptake was reduced by 40% in Ric mKO mice compared to Ric WT mice. Running increased muscle phosphorylated 5′ AMP‐activated protein kinase (AMPK) similarly in Ric WT and Ric mKO mice, and glucose transporter type 4 (GLUT4) and hexokinase II (HKII) protein expressions were also normal in Ric mKO muscle. The mTORC2 substrate, phosphorylated protein kinase C α (PKCα), and the mTORC2 activity readout, phosphorylated N‐myc downstream regulated 1 (NDRG1) protein increased with running in Ric WT mice, but were not altered by running in Ric mKO muscle. Quantitative phosphoproteomics uncovered several additional potential exercise‐dependent mTORC2 substrates, including contractile proteins, kinases, transcriptional regulators, actin cytoskeleton regulators and ion‐transport proteins. Our study suggests that mTORC2 is a component of the exercise signalling network that regulates muscle glucose uptake and we provide a resource of new potential members of the mTORC2 signalling network.
Keywords: mTOR, NDRG, phosphoproteomics, running
Key points
Exercise is a potent physiological stimulus to clear blood glucose from the circulation into skeletal muscle.
The mammalian target of rapamycin complex 2 (mTORC2) is an important regulator of muscle glucose uptake in response to insulin stimulation.
Here we report for the first time that the activity of mTORC2 in mouse muscle increases during exercise.
We further show that glucose uptake during exercise is decreased in mouse muscle that lacks mTORC2 activity.
We also provide novel identifications of new mTORC2 substrates during exercise in mouse muscle.
Abbreviations
- AMPK
5′ AMP‐activated protein kinase
- 2‐DG
2‐deoxyglucose
- EDL
extensor digitorum longus
- GLUT4
glucose transporter type 4
- HKII
hexokinase II
- MHC
myosin heavy chain
- mKO
muscle knockout
- mTOR
mammalian target of rapamycin
- mTORC2
mammalian target of rapamycin complex 2
- PAK1/2
p21‐activated kinase 1/2
- PIP3
phosphatidylinositol 3,4,5‐trisphosphate
- PI3K
phosphoinositide 3‐kinase
- PKCα
protein kinase C α
- Rac1
ras‐related C3 botulinum toxin substrate 1
- RICTOR
rapamycin‐insensitive companion of mammalian target of rapamycin
- SGK1
serine/threonine‐protein kinase 1
- SIN1
stress‐activated map kinase‐interacting protein 1
- WT
wild‐type
Introduction
Insulin and exercise are the most potent physiological stimuli for glucose uptake in skeletal muscle. Although diabetics have decreased insulin‐stimulated glucose uptake into skeletal muscle, the exercise‐stimulated glucose uptake in skeletal muscle is normal in these patients (Kennedy et al. 1999). This suggests that the exercise signalling network regulating glucose uptake is complementary to the insulin signalling cascades (Richter & Hargreaves, 2013; Sylow et al. 2017). Defining the vastly complex exercise network (Hoffman et al. 2015) could therefore reveal molecular targets that improve skeletal muscle glucose uptake and through this whole‐body glycaemia in diabetics.
The mammalian target of rapamycin (mTOR) protein is a serine/threonine‐protein kinase that is found in two structural and functional complexes with unique binding partners and different substrates. mTOR complex 1 (mTORC1), defined by its subunit Regulatory‐associated protein of mTOR (RAPTOR), is a critical regulator of cell growth (Kennedy & Lamming, 2016). mTORC1 is also a well‐established molecular regulator of resistance exercise‐induced skeletal muscle hypertrophy (Marcotte et al. 2015). Because of its more recent discovery less is known about the regulation and function of mTORC2. Rapamycin‐insensitive companion of mammalian target of rapamycin (RICTOR) and stress‐activated map kinase‐interacting protein 1 (SIN1) are critical subunits unique to mTORC2. Growth factors, like insulin, activate mTORC2 via phosphoinositide 3‐kinase (PI3K). Beyond PI3K, the mechanisms of mTORC2 activation have not been fully elucidated, but involve phosphatidylinositol 3,4,5‐trisphosphate (PIP3) generation by PI3K (Liu et al. 2015) and association of mTORC2 with the ribosome (Oh et al. 2010; Zinzalla et al. 2011). In addition, AKT‐dependent phosphorylation of SIN1 has been proposed to be a requisite of growth factor mediated mTORC2 activation (Yang et al. 2015).
Protein kinase C α (PKCα; S657), AKT (S473) and serine/threonine‐protein kinase 1 (SGK1; S422) are the best defined mTORC2 substrates (Sarbassov et al. 2005; García‐Martínez & Alessi, 2008). Loss of mTORC2 activity in insulin responsive tissues generally impairs whole‐body glucose homeostasis (Kennedy & Lamming, 2016). In muscle, mTORC2 is required for normal insulin‐stimulated glucose uptake in mice (Kumar et al. 2008; Kleinert et al. 2014). It has also been reported that mTORC2 regulates Rac1 activity in cultured non‐muscle cells (Jacinto et al. 2004; Morrison et al. 2015). Several cellular processes are controlled by Rac1, including reorganization of the actin cytoskeleton (Chiu et al. 2011). More recently it has been shown that Rac1 is necessary for exercise‐induced glucose uptake in skeletal muscle (Sylow et al. 2013, 2014, 2016). Thus, we explore here the hypothesis that mTORC2 signalling is required for normal muscle glucose uptake during exercise in mice.
Methods
Ethical approval
All experiments were approved by the Danish Animal Experimental Inspectorate and complied with the terms of the ‘European Convention for the Protection of Vertebrate Animals Used for Experiments and Other Scientific Purposes.’ The investigators understand the ethical principles under which The Journal of Physiology operates and our work complies with this animal ethics checklist.
Animals
Female muscle‐specific Rictor knockout (mKO: Rictor Floxed/Floxed, HSA‐Cre−/+) and wild‐type (WT: Rictor Floxed/Floxed, HSA‐Cre−/−) (Bentzinger et al. 2008) littermates on a C57BL/6J background aged 11–14 weeks were used. Animals were exposed to a 12 h:12 h light–dark cycle and had free access to standard rodent chow diet (Altromin no. 1324; Chr. Pedersen, Ringsted, Denmark) and water. Mice were group housed.
Maximal running capacity
All mice were acclimatized to the treadmill on three separate days for 10 min at 0.17 m s−1 at 0 deg incline. The maximal running capacity test was conducted 3 days after the last familiarization round. The test was performed at 10 deg incline with a 5 min warm‐up at 0.17 m s−1, after which the speed was increased by ∼0.02 m s−1 every minute until exhaustion. Testing was performed blinded.
In vivo exercise‐induced glucose uptake
Blood glucose concentration was measured on mixed tail blood and then saline containing 60 μCi ml−1 2‐[3H]‐deoxyglucose (3H‐2‐DG; Perkin Elmer (Waltham, MA, USA)) and 0.1 mm unlabelled 2‐deoxyglucose (2‐DG) was injected intraperitoneally at 8 μl per gram body weight. Mice were divided into two groups and either ran for 20 min, at 10 deg incline and at 60% of the overall average maximal running speed (0.26 m s−1) or rested in their cages for 20 min (n = 9–13). After 20 min of rest/exercise blood glucose concentration was quickly determined again and additional blood was collected into heparinized capillary tubes. Then mice were killed by cervical dislocation and quadriceps, gastrocnemius, soleus and extensor digitorum longus (EDL) muscles were quickly resected out, rinsed in ice‐cold saline, blotted dry on gauze and snap‐frozen in liquid nitrogen. The blood was kept on ice for no longer than 5 min and then centrifuged to obtain plasma which was also snap‐frozen in liquid nitrogen. A 10 μl volume of plasma was used to measure the plasma 3H activity by scintillation counting. Subsequently the area under 3H‐2‐DG0–20 min was calculated to estimate the circulating 3H‐2‐DG. Approximately 50 mg portions of quadriceps and gastrocnemius muscle, and whole soleus and EDL muscles (∼10 mg) were used to determine the clearance of phosphorylated 3H‐2‐DG (3H‐2‐DG‐6‐P) from the plasma into the muscle as previously described (Kleinert et al. 2014). Glucose uptake was estimated by multiplying clearance by the average blood glucose levels.
Muscle glycogen and plasma lactate
Glycogen in gastrocnemius muscles was determined as previously described (Kleinert et al. 2014). Plasma lactate levels were determined with an automatic analyser (Hitachi automatic analyser 912; Boehringer Mannheim, Ingelheim, Germany).
Immunoblotting in muscle samples
Approximately 15 mg portions of gastrocnemius muscles were homogenized 2 × 45 s at 30 Hz in a Tissuelyser II (Qiagen Nordic, Copenhagen, Denmark) in ice‐cold ∼300 μl lysis buffer (10% glycerol, 20 mm sodium pyrophosphate, 150 mm NaCl, 50 mm Hepes (pH 7.5), 1% NP‐40, 20 mm β‐glycerophosphate, 10 mm NaF, 2 mm phenylmethylsulfonyl fluoride (PMSF), 1 mm EDTA (pH 8.0), 1 mm EGTA (pH 8.0), 10 μg ml−1 aprotinin, 10 μg ml−1 leupeptin, 2 mm Na3VO4, 3 mm benzamidine). Homogenates were rotated end‐over‐end for 1 h at 4°C and centrifuged for 20 min at 13,000 g at 4°C. Supernatant lysate protein content was assayed with the bicinchoninic acid (BCA) method and all lysates were diluted to the same protein concentration of 2 μg μl−1. Total protein and phosphorylation levels of indicated proteins were determined by standard immunoblotting technique. Equal amounts of protein (5–20 μg) were loaded.
Antibodies used
The following primary phospho‐antibodies were used: p‐AKT S473 (Cell Signaling Technology (CST), Leiden, Netherlands, no. 9271), p‐N‐Myc Downstream Regulated 1 (NDRG1) T346 (CST, no. 3217), phosphorylated (p‐) 5′ AMP‐activated protein kinase (p‐AMPK) T172 (CST, no. 2531), phosphorylated p21‐activated kinase 1/2 (p‐PAK1/2) T423/T402 (CST, no. 2601), p‐PKCα S657 (Santa Cruz Biotechnology, Santa Cruz, CA, USA, no. sc‐12356), p‐AKT T308 (CST, no. 4056) p‐mTOR S2481 (CST, no. 2974). The primary total antibodies used: AKT2 (CST, no. 2964), NDRG1 (Abcam, Cambridge, MA, USA, no. ab37897), AMPKα2 (Prof. D. G. Hardie (University of Dundee)), PAK1 (CST, no. 2602), RICTOR (CST, no. 2114), PKCα (CST, no. 2056), mTOR (CST, no. 2983), hexokinase II (CST, no. 2867), glucose transporter type 4 (GLUT4; ThermoFisher Scientific, Hvidovre, Denmark, no. PA1‐1065), myosin heavy chain 1 (MHCI; Sigma‐Aldrich, St. Louis, MO, USA, no. 101M426) and myosin heavy chain 2 (MHCII; Sigma‐Aldrich, no. 121M4828).
Phosphoproteomics
Phosphoproteomics was performed essentially as described previously (Hoffman et al. 2015). Briefly, ∼25 mg gastrocnemius muscle from the in vivo exercise study was lysed in 6 m urea, 2 m thiourea, 25 mm triethylammonium bicarbonate (TEAB), pH 7.9, containing phosphatase and protease inhibitor cocktails by tip‐probe sonication (2 × 15 s) on ice. The lysates were centrifuged at 17,000 g, 15 min, 4°C and the supernatant precipitated with six volumes of acetone, overnight, −20°C. Protein pellets were resuspended in 6 m urea, 2 m thiourea, 25 mm TEAB, pH 7.9 and quantified by Qubit fluorescence (Invitrogen by Life Technologies, Carlsbad, CA, USA). Concentrations were normalized and 1 mg of protein reduced with 10 mm dithiothreitol for 60 min at 25°C followed by alkylation with 25 mm iodoacetamide for 30 min at 25°C in the dark. The reaction was quenched to a final concentration of 20 mm dithiothreitol and digested with Lys‐C (Wako Pure Chemical Industries, Osaka, Japan) at 1:50 enzyme to substrate ratio for 2 h at 25°C. The mixture was diluted 5‐fold with 25 mm TEAB and digested with trypsin at 1:50 enzyme to substrate ratio for 12 h at 30°C. The peptide mixture was acidified to a final concentration of 2% formic acid, 0.1% trifuoroacetic acid (TFA) and centrifuged at 16,000 g for 15 min. Peptides were desalted using hydrophilic lipophilic balance–solid phase extraction (HLB‐SPE) cartridges (Waters Corp., Milford, MA, USA) followed by elution with 50% acetonitrile, 0.1% TFA and dried by vacuum centrifugation. Peptides were resuspended in 30 μl of 100 mm TEAB, quantified by Qubit fluorescence and normalized to 250 μg (30 μl)−1. Peptides were labelled with 10‐plex Tandem Mass Tags (TMT) (n = 5 WT and n = 5 Ric mKO). The labelled peptides were pooled and dried to approximately 50 μl by vacuum centrifugation. Phosphopeptides were enriched essentially as described previously (Engholm‐Keller et al. 2012). Enriched phosphopeptides were acidified to a final concentration of 10% formic acid and desalted with C18 microcolumns. The enriched phosphopeptides and aliquots of non‐phosphorylated peptides were fractionated on an in‐house packed TSKgel®‐amide (Tosoh Bioscience, Griesheim, Germany) hydrophilic interaction chromatography (HILIC) column as described previously (Palmisano et al. 2010). Peptides were resuspended in 2% acetonitrile, 0.5% acetic acid and loaded onto a 50 cm × 75 μm inner diameter column packed in‐house with 1.9 μm C18AQ particles (Dr. Maisch HPLC GmbH, Ammerbuch‐Entringen, Germany) using a Dionex UHPLC. Peptides were separated using a linear gradient of 5–30% Buffer B over 120 min at 250 nl min−1 (Buffer A = 0.5% acetic acid; Buffer B = 80% acetonitrile, 0.5% acetic acid). The column was maintained at 50°C using a PRSO‐V1 ion‐source (Sonation) coupled directly to a Q‐Exactive Plus mass spectrometer (MS). For data dependent acquisition (DDA) a first full‐scan mass spectrometry (MS) was measured at 70,000 resolution at 200 m z−1 (300–1550 m z−1; 100 ms injection time; 3e6 automatic gain control (AGC) target) followed by isolation of up to 20 of the most abundant precursor ions for MS/MS (1.2 m z−1 isolation; 8.3e5 intensity threshold; 30.0 normalized collision energy; 35,000 resolution at 200 m z−1; 120 ms injection time; 2e5 AGC target). Charge state reduction of isobarically labelled peptides was achieved with a 10% ammonium hydroxide vapour underneath the electrospray ionization (ESI) source (Thingholm et al. 2010). All data were processed using MaxQuant v1.5.2.10 (Cox & Mann, 2008) and searched with Andromeda (Cox et al. 2011) against the mouse UniProt database (November 2015; 55,004 entries). The data were searched with the following variable modifications; methionine oxidation; and serine, threonine and tyrosine phosphorylation. The precursor‐ion mass tolerance was set to 20 p.p.m. and 7 p.p.m. for first and second searches, respectively, and product‐ion mass tolerance set to 0.02 Da. All results were filtered to 1% false discovery rates (FDRs). All data were normalized to the median of each replicate. Significantly regulated phosphopeptides and proteins were determined using t tests corrected for multiple testing using Benjamini–Hochberg in the Perseus Software Package (Tyanova et al. 2016).
Statistical analyses of non‐omics data
The error bars represent SEM. Statistical testing was performed using two‐way analysis of variance (ANOVA) with the genotype (Ric WT vs. Ric mKO) and the activity (resting vs. running) as the factors. Tukey's post hoc tests were performed when appropriate. Statistical evaluation was performed using GraphPad Prism 7. The significance level was set at P < 0.05. A statistical trend was defined as P < 0.1 and P ≥ 0.05.
Results
Muscle glucose uptake during treadmill exercise in Ric mKO mice
Ric WT and Ric mKO mice had similar running capacities with maximal sustainable speeds of ∼0.45 m s−1 (Fig. 1 A). At rest, glucose uptake and 2‐DG clearance from the blood in gastrocnemius, quadriceps, soleus and EDL were similar between Ric WT and Ric mKO mice (Fig. 1 B and C). During treadmill running, however, muscle glucose uptake and 2‐DG clearance increased less and was ∼40% lower in Ric mKO mice than in Ric WT mice (Fig. 1 B and C). Blood glucose levels were overall ∼10% higher in Ric mKO mice, but there was no difference in exercise‐induced blood glucose changes between Ric WT and Ric mKO mice (Fig. 1 D). There was a statistical trend (P < 0.06) for increased blood glucose concentrations after treadmill running (Fig. 1 D). Plasma lactate levels were similar between Ric WT and Ric mKO and exercise increased plasma lactate by ∼50% in both Ric WT and mKO mice (Fig. 1 E). Muscle glycogen levels tended to be overall higher in Ric mKO (P < 0.07) muscle, but decreased with running by similar magnitude (∼25%) in both Ric WT and Ric mKO mice (Fig. 1 F). Distribution of slow, myosin heavy chain 1 (MHCI) and fast, myosin heavy chain 2 (MHCII) fibres was similar in Ric WT and Ric mKO muscles (Fig. 1 G).
Figure 1. Muscle glucose uptake during treadmill exercise in Ric mKO mice.
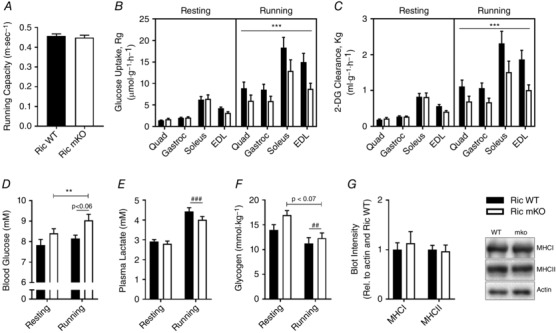
A, maximal running capacity was determined with an incremental treadmill running protocol. B and C, glucose uptake and 2‐DG clearance from the blood into the indicated muscle of resting mice and of mice that ran at 60% of the overall average maximal running capacity for 20 min. D and E, blood glucose and plasma lactate levels before (0 min) and right after (20 min) the interventions (resting vs. running). F, muscle glycogen from the resting and running mice (n = 9–13). G, representative Western blots and quantitative analysis of MHCI and MHCII relative to actin in gastrocnemius muscle (n = 7). *** P < 0.001 and ** P < 0.01 are a main effects of genotype (Ric WT vs. Ric mKO); ### P < 0.001 and ## P < 0.01 are main effects of the intervention (resting vs. running). Values are means ± SEM.
Muscle mTORC2 signalling at rest and during treadmill running in Ric mKO mice
RICTOR protein expression was decreased by ∼60% in Ric mKO muscle (Fig. 2 A). Although muscle samples were carefully dissected out and subsequently rinsed in ice‐cold saline, inadvertent contaminants, including blood cells, blood vessels, nerve and connective tissue, and/or ectopic fat may explain the residual detection of RICTOR in Ric mKO muscle. Importantly, the phosphorylation levels of the direct mTORC2 substrates, p‐PKCα S657 and p‐AKT S473, were decreased by ∼70% and ∼80%, respectively, in Ric mKO muscle (Fig. 2 B and D), attesting to the genetic impairment in mTORC2 signalling in our model. The protein expression of PKCα and AKT2 were decreased by ∼85% and 15%, respectively (Fig. 2 C and F). p‐AKT T308, however, was increased by ∼135% in Ric mKO muscle (Fig. 2 E).
Figure 2. Muscle mTORC2 signalling at rest and during treadmill running in Ric mKO mice.
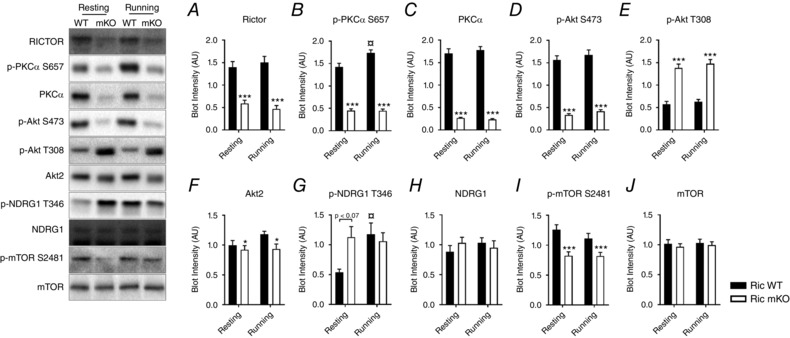
Representative Western blots and quantitative analysis of the indicated phosphorylation sites and total proteins in gastrocnemius muscle lysates from Ric WT and Ric mKO mice that were either resting or running (n = 9–13). *** P < 0.001, * P < 0.05 are main effects of genotype (Ric WT vs. Ric mKO); for p‐PKCα S657 and p‐NDRG1 T346 an interaction was detected by two‐way ANOVA (P = 0.0084 and P = 0.0304, respectively) and the following differences were determined by Tukey's post hoc tests: ¤ P < 0.05 difference between Ric WT resting and Ric WT running. Values are means ± SEM.
In addition to its direct targets, two other phosphorylation sites, p‐NDRG1 T346 and p‐mTOR S2481, have been previously characterized and used as in vivo markers of mTORC2 activity (García‐Martínez & Alessi, 2008; Copp et al. 2009; Sato et al. 2014). Interestingly, there was no statistical difference in p‐NDRG1 T346 between Ric WT and Ric mKO muscles (Fig. 2 G). Muscle p‐mTOR S2481, on the other hand, was decreased by ∼30% in Ric mKO mice (Fig. 2 I). NDRG1 and mTOR protein levels were similar between Ric WT and Ric mKO muscles (Fig. 2 H and J). Both p‐PKCα S657 and p‐NDRG1 increased during treadmill running in Ric WT muscle, but not in Ric mKO muscle (Fig. 2 B and G), demonstrating that mTORC2 is activated during exercise.
Exercise‐related signalling at rest and during treadmill running in Ric mKO mice
Treadmill running increased p‐AMPK T172 by ∼50% in both Ric WT and Ric mKO muscles (Fig. 3 A). There was no effect of running on the total protein levels of AMPKα2, which were also similar between Ric WT and Ric mKO muscle (Fig. 3 B). There was a trend (P < 0.07) for an exercise‐induced increase in p‐PAK1/2 T423/T402 (Fig. 3 C). Phosphorylation levels of this site, however, were not different between Ric WT and Ric mKO muscles. PAK1 protein levels were decreased by ∼20% in Ric mKO muscle (Fig. 3 D). The protein levels of hexokinase II (HKII) and GLUT4 were not altered by exercise or in Ric mKO muscle (Fig. 3 E and F).
Figure 3. Exercise‐related signalling at rest and during treadmill running in Ric mKO mice.
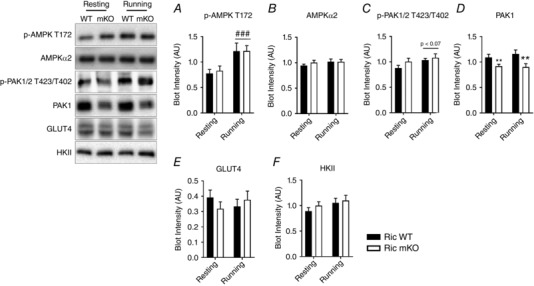
Representative Western blots and quantitative analysis of the indicated phosphorylation sites and total proteins in gastrocnemius muscle lysates from Ric WT and Ric mKO mice that were either resting or running (n = 9–13). ### P < 0.001 main effect of the intervention (resting vs. running). ** P < 0.01 main effects of genotype (Ric WT vs. Ric mKO). Values are means ± SEM.
Global signalling difference in between muscle of Ric WT and Ric mKO mice during treadmill running
We next obtained a more global view of protein phosphorylation using stable isotope labelling combined with phosphoproteomic analysis to investigate exercise‐regulated signalling events that are regulated by mTORC2. A total of 8832 phosphosites on 2681 phosphoproteins were quantified in five biological replicates, with 94 phosphosites differentially regulated between Ric WT and Ric mKO (P < 0.05 adjusted for multiple testing and ±1.5‐fold) (Fig. 4 A and C; supplementary spreadsheets (Table S1) in the online Supporting information). Since a regulated phosphopeptide may arise from either a change in the abundance of the protein itself or a change in the amount of phosphorylation, we also performed total proteome quantification using the same strategy and samples. A total of 4954 proteins were quantified in all five biological replicates. Twelve proteins were significantly regulated between Ric WT and Ric mKO (P < 0.05 adjusted for multiple testing and ±1.5‐fold) (Fig. 4 B; supplementary spreadsheets (Table S2) in the online Supporting information). This included the up‐regulation of perilipin 3 (PLIN3) which has recently been shown to be negatively regulated by mTORC2 in skeletal muscle (Kleinert et al. 2016). We also detected a down‐regulation of PKCα, which is a known target of mTORC2 and mTORC2‐dependent phosphorylation is essential for PKCα maturation and stability (Fig. 2 B and C) (Ikenoue et al. 2008). Of the 2681 proteins containing an identified phosphosite, total protein abundance quantification was obtained for 1810 proteins and used to normalize the quantitative data of 7368 phosphosites. For the 94 regulated phosphosites, 80 could be normalized to a matching protein. Filtering out phosphosites for which the corresponding protein was significantly regulated by more than 1.5‐fold resulted in 45 confident residues that were significantly altered in their level of phosphorylation (>1.5‐fold) (Fig. 4 C) in Ric mKO muscle during exercise.
Figure 4. Muscle phosphoproteomics and proteomics in Ric mKO mice during treadmill exercise.
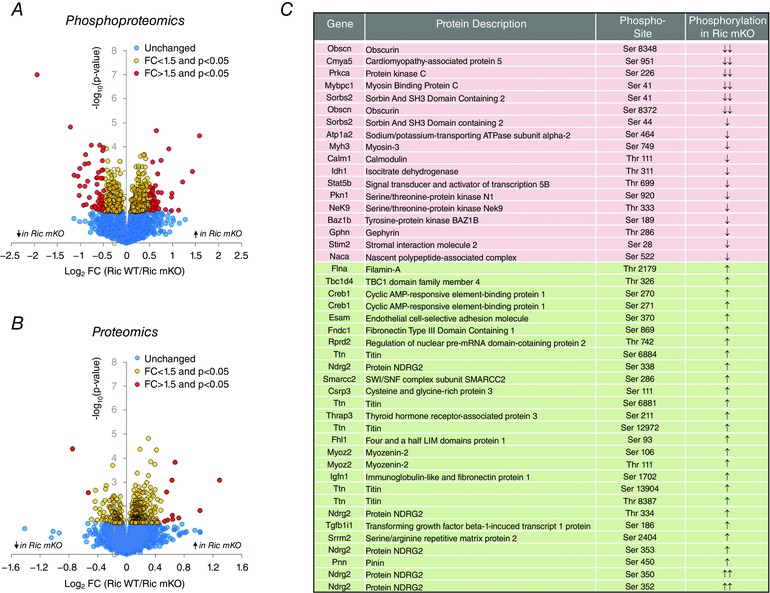
A and B, volcano plots of all phosphorylation sites and protein groups detected with quantitative MS‐based phosphoproteomics and proteomics (n = 5). C, list of phosphorylation sites that were normalized to protein abundance and that were significantly (adjusted P < 0.05) differentially phosphorylated by more 1.5‐fold in Ric mKO gastrocnemius muscle compared to Ric WT gastrocnemius muscle after exercise. Two arrows indicate a fold‐change (FC) > 2 and one arrow is a FC > 1.5 (n = 5).
Regulated phosphorylation was observed on a range of proteins with different biological functions, including structural/contractile proteins (e.g. TTN, MYH3, MYOZ, FLNA, OBSCN), protein kinases (PKN1, BAZ1B, PRKCA, NEK9), transcriptional regulators (PNN, TGFB1I1, THRAP3, SMARCC2, NACA, PKN1, CREB1, STAT5B), actin cytoskeleton regulators (TGFB1I1, MYOZ, PKN1, XIRP2) and ion‐transport proteins (NDRG2, ATP1A2, STIM2, FHL1). Notably, phosphorylation levels of several NDRG2 residues were increased in Ric mKO with exercise.
Discussion
Our data suggest that mTORC2 is activated in muscle during exercise and that mTORC2 is involved in the regulation of exercise‐induced muscle glucose uptake in vivo. Consistent with a previous report (Kleinert et al. 2014), muscle glucose uptake at rest was normal in mice with impaired mTORC2 signalling. During treadmill running, however, muscle glucose uptake was reduced in Ric mKO mice compared to Ric WT mice. A similar magnitude in the breakdown of muscle glycogen and the similar increase in plasma lactate during treadmill running indicate that the exercise intervention induced similar metabolic stress in Ric WT and Ric mKO mice. This notion of a similar ‘load’ on the muscle during running is further supported by the phosphorylation levels of the master energy stress sensor AMPK, which increased to a similar extent during running in both Ric WT and Ric mKO mice. Also important to the interpretation of our findings, GLUT4 and HKII protein content, and fibre type distribution were similar in Ric WT and Ric mKO muscles.
Consistent with their role as mTORC2 targets, phosphorylation levels of p‐AKT S473 and p‐PKCα S657 were reduced in muscle of Ric mKO mice. Whether another kinase accounts for the residual p‐AKT S473 and p‐PKCα S657 phosphorylation or whether blood cells, blood vessels, nerve and connective tissue and/or ectopic fat contamination of the muscle samples are the explanation is difficult to ascertain. The increase in p‐PKCα S657 with treadmill running specifically in Ric WT (but not in Ric mKO muscle) suggests that exercise increases mTORC2 activity. On the other hand, treadmill running had no effect on p‐AKT S473. This discrepancy requires future investigations, but there are several indications that discrete, parallel mTORC2 pathways could exist. First, it has been previously reported that there are three different versions of mTORC2 that respond differently to insulin stimulation (Frias et al. 2006). Second, β‐adrenergic stimulation increases p‐mTOR S2481 in an mTORC2‐dependent manner without altering AKT S473 phosphorylation (Sato et al. 2014). Third, there are spatially separated intracellular mTORC2 populations (Betz et al. 2013; Ebner et al. 2017) that diverge in their sensitivity to PI3K (Ebner et al. 2017). This raises the possibility that there are different subcellular pools of mTORC2 in muscle that integrate and execute different upstream inputs.
Of note is that the protein levels of PKCα were considerably decreased (15% of Ric WT levels) in Ric mKO muscle. This is in agreement with p‐PKCα S657 being a post‐translational modification that stabilizes the PKCα protein (Ikenoue et al. 2008). These data, however, also highlight that observed effects in tissue‐specific RICTOR knockout models could be due to the large reduction in PKCα protein content. Similarly, AKT2 protein levels were decreased in Ric mKO muscle, albeit to a lesser extent. This finding is consistent with AKT expression being lower in RICTOR‐deficient liver (Lamming et al. 2014) and can most likely be explained by a decrease in the turn motif phosphorylation of AKT (T450), which is under the control of mTORC2 (Ikenoue et al. 2008).
We also attempted to quantify the mTORC2 target site p‐SGK1 S422 (García‐Martínez & Alessi, 2008), but in our hands commercial antibodies did not have the requisite specificity in muscle lysates. SGK1 phosphorylates NDRG1 at three residues, T346, T356 and T366 (García‐Martínez & Alessi, 2008), and it has been suggested that the phosphorylations of these residues are excellent surrogates of mTORC2 activity. Thus, p‐NDRG1 T346 has been widely used in this capacity of an mTORC2 biomarker (García‐Martínez & Alessi, 2008; Pearce et al. 2011; Lee et al. 2014; Wang et al. 2015). Contrary to this proposed role, we did not observe a decrease in p‐NDRG1 T346 in Ric mKO muscles. In fact, at rest p‐NDRG1 T346 tended to be increased 2‐fold in Ric mKO muscle. Since it has been previously shown that knockout of SGK1 in muscle leads to a reduction in p‐NDRG1 T346 (García‐Martínez & Alessi, 2008), our data indicate that SGK1 activity is normal in Ric mKO muscle. It has been previously reported that PDK1‐dependent phosphorylation of SGK1 can increase its activity (Lang & Cohen, 2001; Frodin et al. 2002). This is of note, since p‐AKT T308, a direct substrate of PDK1 (Pearce et al. 2010), was increased ∼2.5‐fold in Ric mKO muscle, suggesting a greater PDK1 activity in Ric mKO muscle. The potential increase in PDK1 activity may also explain why several NDRG2 phosphorylation sites (T334, S350, S352), identified by phosphoproteomics, were increased in Ric mKO muscle. Intriguingly, with treadmill running p‐NDRG1 T346 increased only in Ric WT muscle, suggesting that intact mTORC2 signalling is required for an exercise‐induced increase in p‐NDRG1 T346.
Similarly to p‐NDRG1, p‐mTOR S2481 has been proposed as an in vivo marker of mTORC2 activity. We observed a general decrease in p‐mTOR S2481 in Ric mKO muscle. With treadmill running, however, p‐mTOR S2481 was not altered. Sato et al. have shown that β‐adrenergic stimulation of p‐mTOR S2481 requires mTORC2 signalling in cultured muscle cells. Exercise is a physiological stimulus that triggers catecholamine release and thus increases β‐adrenergic signalling in muscle. So it is unclear why p‐mTOR S2481 does not respond to exercise, but it could be that the physiological rise in catecholamine levels with exercise is lower than the concentrations that were used in the in vitro cell culture experiments (Sato et al. 2014).
It has been previously shown that Rac1 activity, judged by p‐PAK1/2 T423/T402, increases with exercise in skeletal muscle and that Rac1 is a necessary signalling component for exercise‐stimulated glucose uptake in skeletal muscle in vivo in mice (Sylow et al. 2016). In agreement, p‐PAK1/2 tended (P < 0.1) to increase with exercise in our current study. There was no effect of Ric mKO on p‐PAK1/2 T423/T402 indicating that Rac1 was not altered in Ric mKO skeletal muscle. This observation is in contrast to the notion that mTORC2 regulates exercise‐controlled glucose uptake by modulating Rac1 signalling. Intriguingly, PAK1 protein expression was decreased with Ric mKO. It has been shown that the transcription factors, forkhead box O (FoxO) proteins, control the expression of PAK1 (de la Torre‐Ubieta et al. 2010). Therefore, a reduction in FoxO1 activity in Ric mKO muscle as described previously (Kleinert et al. 2016) could explain why PAK1 protein expression is decreased.
Since Rac1 activity appeared to be normal in Ric mKO muscles, we undertook an unbiased phosphoproteomic analysis to potentially uncover mTORC2‐regulated proteins that could explain the reduction in exercise‐induced muscle glucose uptake. Targeted functional validation of these hits will be required in the future, but these data provide a resource for hypothesis‐driven follow‐up studies. Below we briefly discuss a few hits that exhibited decreased phosphorylation in Ric mKO muscle during exercise.
First, the sorbin and SH3 domain‐containing 2 (Sorbs2) protein, also known as Arg/Abl‐interacting protein 2 (ArgBP2), is a ubiquitously expressed adaptor protein that is involved in the regulation of the actin cytoskeleton (Cestra et al. 2005). In addition, the closely related Sorbs1 has been shown to be involved in the regulation of insulin‐stimulated glucose transport (Baumann et al. 2000). These connections warrant future investigations into whether mTORC2‐mediated Sorbs2 S41 and S44 phosphorylations are important for skeletal muscle metabolism.
Second, STAT5b, a member of the signal transducer and activator of transcription (STAT) family, couples extracellular cytokine and growth factor signalling to changes in intracellular gene expression. Phosphorylation on Y699 (decreased in Ric mKO muscle) is critical for activating STAT5, and Jak2, Src and BRK are to date the best known modulators of STAT5b Y699 phosphorylation (Tan & Nevalainen, 2008). Also, both exercise and insulin increase STAT5 phosphorylation in muscle (Chen et al. 1997; Consitt et al. 2008). Whether mTORC2 directly or indirectly impacts STAT5b Y699 phosphorylation (decreased in Ric mKO mice, Fig. 4) remains to be elucidated, but it has recently been reported that mTORC2 can also function as a tyrosine kinase (Wang & Proud, 2016).
Third, STIM2 regulates calcium release from endoplasmatic reticulum (ER) (Cahalan, 2009). Calcium turnover might be involved in contraction‐induced glucose uptake (Wright et al. 2004), although the mechanism for this calcium effect is controversial (Jensen et al. 2014). A recent report indicated that mTORC2 localizes to ER to regulate calcium flux (Betz et al. 2013). Therefore, it is a tempting hypothesis that mTORC2 regulates intracellular calcium flux via STIM2. An involvement of mTORC2 in calcium regulation in muscle is also supported by the decrease in the phosphorylation of calmodulin 1 (CALM1) in Ric mKO muscle, since calmodulins are calcium ion sensor proteins that transduce most of the calcium signalling to downstream protein kinases and phosphatases (Marcelo et al. 2016).
Lastly, the protein kinase N1 (PKN1) belongs to the protein kinase C superfamily. Both, the Rho family of small G proteins (e.g. Rac1) and PDK1 have been found to regulate PKN1 activity and localization (Torbett et al. 2003). PKN1 is best known as the effector of Rac1 in the control of actin cytoskeleton dynamics (Modha et al. 2008). Our data suggest that in muscle Rac1 and mTORC2 signal in parallel to PKN1 to control the actin cytoskeleton. Of particular note is that the S920 residue on PKN1, which exhibits decreased phosphorylation in Ric mKO muscle during exercise, is embedded in a phosphorylation motif that is very similar to the T450 motif on AKT2 (TxxxxTx*T/S*PP), which is a known target site of mTORC2 (Ikenoue et al. 2008). This makes PKN1 a strong potential novel mTORC2 target.
In conclusion, our data identify mTORC2 as a partial regulator of skeletal muscle glucose metabolism during exercise. Given the crucial role of skeletal muscle in whole‐body glucose homeostasis, mTORC2 thus emerges as an intriguing therapeutic target to improve glucose uptake in insulin resistant skeletal muscle.
Additional information
Competing interests
None declared.
Author contributions
M.K. and E.A.R. designed the study and wrote the manuscript together. M.K performed most of the Western blot (WB), the animal work and data analyses in Copenhagen, Denmark. B.L.P. performed the phospho‐ and proteomics and related analyses in Sydney, Australia. A.M.F., J.R.K., T.E.J., R.K. and L.S. helped with the animal work and the preparation of samples for WB and some of the WB in Copenhagen, Denmark. M.R. provided the Ric mKO mice. D.E.J. and E.A.R. supervised aspects of the study and helped write the manuscript. All authors have approved the final version of the manuscript and agree to be accountable for all aspects of the work. All persons designated as authors qualify for authorship, and all those who qualify for authorship are listed.
Funding
This work was supported by grants from The Danish Council for Independent Research Natural Sciences (grant number 4002‐00492B), The Danish Council for Independent Research Medical Sciences (grant number 0602–02273B), the Novo Nordisk Foundation (grant number 1015429) and the University of Copenhagen Excellence Program for Interdisciplinary Research ‘Physical activity and nutrition for improvement of health’ (2016) (E.A.R.). In addition it was supported by a NHMRC Program Grant (D.E.J.). D.E.J. is a NHMRC senior principal research fellow. M.K. and L.S. were supported by postdoctoral fellowships from The Danish Council for Independent Research Medical Sciences (grants 5053‐00155 and 4004‐00233, respectively). A.M.F. was funded by the Danish Diabetes Academy, supported by the Novo Nordisk Foundation.
Supporting information
Disclaimer: Supporting information has been peer‐reviewed but not copyedited.
Table S1. All phosphosites detected by MS‐based quantitative phosphoproteomics.
Table S2. All protein groups detected by MS‐based quantitative proteomics.
Acknowledgements
We thank Irene Bech Nielsen and Betina Bolmgren (University of Copenhagen) for their technical assistance.
References
- Baumann CA, Ribon V, Kanzaki M, Thurmond DC, Mora S, Shigematsu S, Bickel PE, Pessin JE & Saltiel AR (2000). CAP defines a second signalling pathway required for insulin‐stimulated glucose transport. Nature 407, 202–207. [DOI] [PubMed] [Google Scholar]
- Bentzinger CF, Romanino K, Cloetta D, Lin S, Mascarenhas JB, Oliveri F, Xia J, Casanova E, Costa CF, Brink M, Zorzato F, Hall MN & Ruegg MA (2008). Skeletal muscle‐specific ablation of raptor, but not of rictor, causes metabolic changes and results in muscle dystrophy. Cell Metab 8, 411–424. [DOI] [PubMed] [Google Scholar]
- Betz C, Stracka D, Prescianotto‐Baschong C, Frieden M, Demaurex N & Hall MN (2013). mTOR complex 2‐Akt signaling at mitochondria‐associated endoplasmic reticulum membranes (MAM) regulates mitochondrial physiology. Proc Natl Acad Sci USA 110, 12526–12534. [DOI] [PMC free article] [PubMed] [Google Scholar]
- Cahalan MD (2009). STIMulating store‐operated Ca2+ entry. Nat Cell Biol 11, 669–677. [DOI] [PMC free article] [PubMed] [Google Scholar]
- Cestra G, Toomre D, Chang S & De Camilli P (2005). The Abl/Arg substrate ArgBP2/nArgBP2 coordinates the function of multiple regulatory mechanisms converging on the actin cytoskeleton. Proc Natl Acad Sci USA 102, 1731–1736. [DOI] [PMC free article] [PubMed] [Google Scholar]
- Chen J, Sadowski HB, Kohanski RA & Wang LH (1997). Stat5 is a physiological substrate of the insulin‐receptor. Proc Natl Acad Sci USA 94, 2295–2300. [DOI] [PMC free article] [PubMed] [Google Scholar]
- Chiu TT, Jensen TE, Sylow L, Richter EA & Klip A (2011). Rac1 signalling towards GLUT4/glucose uptake in skeletal muscle. Cell Signal 23, 1546–1554. [DOI] [PubMed] [Google Scholar]
- Consitt LA, Wideman L, Hickey MS & Morrison RF (2008). Phosphorylation of the JAK2‐STAT5 pathway in response to acute aerobic exercise. Med Sci Sports Exerc 40, 1031–1038. [DOI] [PMC free article] [PubMed] [Google Scholar]
- Copp J, Manning G & Hunter T (2009). TORC‐specific phosphorylation of mTOR: phospho‐Ser2481 is a marker for intact mTORC2. Cancer Res 69, 1821–1827. [DOI] [PMC free article] [PubMed] [Google Scholar]
- Cox J & Mann M (2008). MaxQuant enables high peptide identification rates, individualized p.p.b.‐range mass accuracies and proteome‐wide protein quantification. Nat Biotech 26, 1367–1372. [DOI] [PubMed] [Google Scholar]
- Cox J, Neuhauser N, Michalski A, Scheltema RA, Olsen JV & Mann M (2011). Andromeda: a peptide search engine integrated into the maxquant environment. J Proteome Res 10, 1794–1805. [DOI] [PubMed] [Google Scholar]
- de la Torre‐Ubieta L, Gaudillière B, Yang Y, Ikeuchi Y, Yamada T, DiBacco S, Stegmüller J, Schüller U, Salih DA, Rowitch D, Brunet A & Bonni A (2010). A FOXO‐Pak1 transcriptional pathway controls neuronal polarity. Genes Dev 24, 799–813. [DOI] [PMC free article] [PubMed] [Google Scholar]
- Ebner M, Sinkovics B, Szczygiel M, Ribeiro DW & Yudushkin I (2017). Localization of mTORC2 activity inside cells. J Cell Biol 216, 343–353. [DOI] [PMC free article] [PubMed] [Google Scholar]
- Engholm‐Keller K, Birck P, Størling J, Pociot F, Mandrup‐Poulsen T & Larsen MR (2012). TiSH – a robust and sensitive global phosphoproteomics strategy employing a combination of TiO2, SIMAC, and HILIC. J Proteomics 75, 5749–5761. [DOI] [PubMed] [Google Scholar]
- Frias MA, Thoreen CC, Jaffe JD, Schroder W, Sculley T, Carr SA & Sabatini DM (2006). mSin1 is necessary for Akt/PKB phosphorylation, and its isoforms define three distinct mTORC2s. Curr Biol 16, 1865–1870. [DOI] [PubMed] [Google Scholar]
- Frodin M, Antal TL, Dummler BA, Jensen CJ, Deak M, Gammeltoft S & Biondi RM (2002). A phosphoserine/threonine‐binding pocket in AGC kinases and PDK1 mediates activation by hydrophobic motif phosphorylation. EMBO J 21, 5396–5407. [DOI] [PMC free article] [PubMed] [Google Scholar]
- García‐Martínez JM & Alessi DR (2008). mTOR complex 2 (mTORC2) controls hydrophobic motif phosphorylation and activation of serum‐ and glucocorticoid‐induced protein kinase 1 (SGK1). Biochem J 416, 375–385. [DOI] [PubMed] [Google Scholar]
- Hoffman NJ, Parker BL, Chaudhuri R, Fisher‐Wellman KH, Kleinert M, Humphrey SJ, Yang P, Holliday M, Trefely S, Fazakerley DJ, Stoeckli J, Burchfield JG, Jensen TE, Jothi R, Kiens B, Wojtaszewski J, Richter EA & James DE (2015). Global phosphoproteomic analysis of human skeletal muscle reveals a network of exercise‐regulated kinases and AMPK substrates. Cell Metab 22, 922–935. [DOI] [PMC free article] [PubMed] [Google Scholar]
- Ikenoue T, Inoki K, Yang Q, Zhou X & Guan K (2008). Essential function of TORC2 in PKC and Akt turn motif phosphorylation, maturation and signalling. EMBO J 27, 1919–1931. [DOI] [PMC free article] [PubMed] [Google Scholar]
- Jacinto E, Loewith R, Schmidt A, Lin S, Ruegg MA, Hall A & Hall MN (2004). Mammalian TOR complex 2 controls the actin cytoskeleton and is rapamycin insensitive. Nat Cell Biol 6, 1122–1128. [DOI] [PubMed] [Google Scholar]
- Jensen TE, Sylow L, Rose AJ, Madsen AB, Angin Y, Maarbjerg SJ & Richter EA (2014). Contraction‐stimulated glucose transport in muscle is controlled by AMPK and mechanical stress but not sarcoplasmatic reticulum Ca2+ release. Mol Metab 3, 742–753. [DOI] [PMC free article] [PubMed] [Google Scholar]
- Kennedy BK & Lamming DW (2016). The mechanistic target of rapamycin: the grand ConducTOR of metabolism and aging. Cell Metab 23, 990–1003. [DOI] [PMC free article] [PubMed] [Google Scholar]
- Kennedy JW, Hirshman MF, Gervino EV, Ocel JV, Forse RA, Hoenig SJ, Aronson D, Goodyear LJ & Horton ES (1999). Acute exercise induces GLUT4 translocation in skeletal muscle of normal human subjects and subjects with type 2 diabetes. Diabetes 48, 1192–1197. [DOI] [PubMed] [Google Scholar]
- Kleinert M, Parker BL, Chaudhuri R, Fazakerley DJ, Serup A, Thomas KC, Krycer JR, Sylow L, Fritzen AM, Hoffman NJ, Jeppesen J, Schjerling P, Ruegg MA, Kiens B, James DE & Richter EA (2016). mTORC2 and AMPK differentially regulate muscle triglyceride content via Perilipin 3. Mol Metab 5, 646–655. [DOI] [PMC free article] [PubMed] [Google Scholar]
- Kleinert M, Sylow L, Fazakerley DJ, Krycer JR, Thomas KC, Oxboll AJ, Jordy AB, Jensen TE, Yang G, Schjerling P, Kiens B, James DE, Ruegg MA & Richter EA (2014). Acute mTOR inhibition induces insulin resistance and alters substrate utilization in‐vivo. Mol Metab 3, 630–641. [DOI] [PMC free article] [PubMed] [Google Scholar]
- Kumar A, Harris TE, Keller SR, Choi KM, Magnuson MA & Lawrence JC Jr (2008). Muscle‐specific deletion of rictor impairs insulin‐stimulated glucose transport and enhances basal glycogen synthase activity. Mol Cell Biol 28, 61–70. [DOI] [PMC free article] [PubMed] [Google Scholar]
- Lamming DW, Demirkan G, Boylan JM, Mihaylova MM, Peng T, Ferreira J, Neretti N, Salomon A, Sabatini DM & Gruppuso PA (2014). Hepatic signaling by the mechanistic target of rapamycin complex 2 (mTORC2). FASEB J 28, 300–315. [DOI] [PMC free article] [PubMed] [Google Scholar]
- Lang F & Cohen P (2001). Regulation and physiological roles of serum‐ and glucocorticoid‐induced protein kinase isoforms. Sci STKE 2001, re17. [DOI] [PubMed] [Google Scholar]
- Lee D, Sykes SM, Kalaitzidis D, Lane AA, Kfoury Y, Raaijmakers MHGP, Wang Y‐H, Armstrong SA & Scadden DT (2014). Transmembrane inhibitor of RICTOR/mTORC2 in hematopoietic progenitors. Stem Cell Reports 3, 832–840. [DOI] [PMC free article] [PubMed] [Google Scholar]
- Liu P, Gan W, Chin YR, Ogura K, Guo J, Zhang J, Wang B, Blenis J, Cantley LC, Toker A, Su B & Wei W (2015). PtdIns(3,4,5)P 3‐dependent activation of the mTORC2 kinase complex. Cancer Discov 5, 1194–1209. [DOI] [PMC free article] [PubMed] [Google Scholar]
- Marcelo KL, Means AR & York B (2016). The Ca2+/calmodulin/CaMKK2 axis: nature's metabolic CaMshaft. Trends Endocrinol Metab 27,706–718. [DOI] [PMC free article] [PubMed] [Google Scholar]
- Marcotte GR, West DW & Baar K (2015). The molecular basis for load‐induced skeletal muscle hypertrophy. Calcif Tissue Int 96, 196–210. [DOI] [PMC free article] [PubMed] [Google Scholar]
- Modha R, Campbell LJ, Nietlispach D, Buhecha HR, Owen D & Mott HR (2008). The Rac1 polybasic region is required for interaction with its effector PRK1. J Biol Chem 283, 1492–1500. [DOI] [PubMed] [Google Scholar]
- Morrison MM, Young CD, Wang S, Sobolik T, Sanchez VM, Hicks DJ, Cook RS & Brantley‐Sieders DM (2015). mTOR directs breast morphogenesis through the PKC‐alpha‐rac1 signaling axis. PLoS Genet 11, e1005291. [DOI] [PMC free article] [PubMed] [Google Scholar]
- Oh WJ, Wu CC, Kim SJ, Facchinetti V, Julien LA, Finlan M, Roux PP, Su B & Jacinto E (2010). mTORC2 can associate with ribosomes to promote cotranslational phosphorylation and stability of nascent Akt polypeptide. EMBO J 29, 3939–3951. [DOI] [PMC free article] [PubMed] [Google Scholar]
- Palmisano G, Lendal SE, Engholm‐Keller K, Leth‐Larsen R, Parker BL & Larsen MR (2010). Selective enrichment of sialic acid‐containing glycopeptides using titanium dioxide chromatography with analysis by HILIC and mass spectrometry. Nat Protoc 5, 1974–1982. [DOI] [PubMed] [Google Scholar]
- Pearce LR, Komander D & Alessi DR (2010). The nuts and bolts of AGC protein kinases. Nat Rev Mol Cell Biol 11, 9–22. [DOI] [PubMed] [Google Scholar]
- Pearce LR, Sommer EM, Sakamoto K, Wullschleger S & Alessi DR (2011). Protor‐1 is required for efficient mTORC2‐mediated activation of SGK1 in the kidney. Biochem J 436, 169–179. [DOI] [PubMed] [Google Scholar]
- Richter EA & Hargreaves M (2013). Exercise, GLUT4, and skeletal muscle glucose uptake. Physiol Rev 93, 993–1017. [DOI] [PubMed] [Google Scholar]
- Sarbassov DD, Guertin DA, Ali SM & Sabatini DM (2005). Phosphorylation and regulation of Akt/PKB by the rictor‐mTOR complex. Science 307, 1098–1101. [DOI] [PubMed] [Google Scholar]
- Sato M, Dehvari N, Oberg AI, Dallner OS, Sandstrom AL, Olsen JM, Csikasz RI, Summers RJ, Hutchinson DS & Bengtsson T (2014). Improving type 2 diabetes through a distinct adrenergic signaling pathway involving mTORC2 that mediates glucose uptake in skeletal muscle. Diabetes 63, 4115–4129. [DOI] [PubMed] [Google Scholar]
- Sylow L, Jensen TE, Kleinert M, Mouatt JR, Maarbjerg SJ, Jeppesen J, Prats C, Chiu TT, Boguslavsky S, Klip A, Schjerling P & Richter EA (2013). Rac1 is a novel regulator of contraction‐stimulated glucose uptake in skeletal muscle. Diabetes 62, 1139–1151. [DOI] [PMC free article] [PubMed] [Google Scholar]
- Sylow L, Kleinert M, Richter EA & Jensen TE (2017). Exercise‐stimulated glucose uptake – regulation and implications for glycaemic control. Nat Rev Endocrinol 13, 133–148. [DOI] [PubMed] [Google Scholar]
- Sylow L, Moller LLV, Kleinert M, Richter EA & Jensen TE (2014). Rac1 is a novel regulator of contraction‐stimulated glucose uptake in skeletal muscle. Exp Physiol 99, 1574–1580. [DOI] [PubMed] [Google Scholar]
- Sylow L, Nielsen IL, Kleinert M, Møller LLV, Ploug T, Schjerling P, Bilan PJ, Klip A, Jensen TE & Richter EA (2016). Rac1 governs exercise‐stimulated glucose uptake in skeletal muscle through regulation of GLUT4 translocation in mice. J Physiol 594, 4997–5008. [DOI] [PMC free article] [PubMed] [Google Scholar]
- Tan SH & Nevalainen MT (2008). Signal transducer and activator of transcription 5A/B in prostate and breast cancers. Endocr Relat Cancer 15, 367–390. [DOI] [PMC free article] [PubMed] [Google Scholar]
- Thingholm TE, Palmisano G, Kjeldsen F & Larsen MR (2010). Undesirable charge‐enhancement of isobaric tagged phosphopeptides leads to reduced identification efficiency. J Proteome Res 9, 4045–4052. [DOI] [PubMed] [Google Scholar]
- Torbett NE, Casamassima A & Parker PJ (2003). Hyperosmotic‐induced protein kinase N 1 activation in a vesicular compartment is dependent upon Rac1 and 3‐phosphoinositide‐dependent kinase 1. J Biol Chem 278, 32344–32351. [DOI] [PubMed] [Google Scholar]
- Tyanova S, Temu T, Sinitcyn P, Carlson A, Hein MY, Geiger T, Mann M & Cox J (2016). The Perseus computational platform for comprehensive analysis of (prote)omics data. Nat Methods 13, 731–740. [DOI] [PubMed] [Google Scholar]
- Wang S, Amato KR, Song W, Youngblood V, Lee K, Boothby M, Brantley‐Sieders DM & Chen J (2015). Regulation of endothelial cell proliferation and vascular assembly through distinct mTORC2 signaling pathways. Mol Cell Biol 35, 1299–1313. [DOI] [PMC free article] [PubMed] [Google Scholar]
- Wang X & Proud CG (2016). mTORC2 is a tyrosine kinase. Cell Res 26, 1–2. [DOI] [PMC free article] [PubMed] [Google Scholar]
- Wright DC, Hucker KA, Holloszy JO & Han DH (2004). Ca2+ and AMPK both mediate stimulation of glucose transport by muscle contractions. Diabetes 53, 330–335. [DOI] [PubMed] [Google Scholar]
- Yang G, Murashige DS, Humphrey SJ & James DE (2015). A positive feedback loop between Akt and mTORC2 via SIN1 phosphorylation. Cell Rep 12, 937–943. [DOI] [PubMed] [Google Scholar]
- Zinzalla V, Stracka D, Oppliger W & Hall MN (2011). Activation of mTORC2 by association with the ribosome. Cell 144, 757–768. [DOI] [PubMed] [Google Scholar]
Associated Data
This section collects any data citations, data availability statements, or supplementary materials included in this article.
Supplementary Materials
Disclaimer: Supporting information has been peer‐reviewed but not copyedited.
Table S1. All phosphosites detected by MS‐based quantitative phosphoproteomics.
Table S2. All protein groups detected by MS‐based quantitative proteomics.