

Abstract
Key points
Mitochondrial function changes over time at high altitudes, but the potential benefits of these changes for hypoxia resistance remains unclear.
We used high‐altitude‐adapted populations of deer mice, which exhibit enhanced aerobic performance in hypoxia, to examine whether changes in mitochondrial physiology or intracellular distribution in the muscle contribute to hypoxia resistance.
Permeabilized muscle fibres from the gastrocnemius muscle had higher respiratory capacities in high‐altitude mice than in low‐altitude mice.
Highlanders also had higher mitochondrial volume densities, due entirely to an enriched abundance of subsarcolemmal mitochondria, such that more mitochondria were situated near the cell membrane and adjacent to capillaries.
There were several effects of hypoxia acclimation on mitochondrial function, some of which were population specific, but they differed from the evolved changes in high‐altitude natives, which probably provide a better indication of adaptive traits that improve performance and hypoxia resistance at high altitudes.
Abstract
High‐altitude natives that have evolved to live in hypoxic environments provide a compelling system to understand how animals can overcome impairments in oxygen availability. We examined whether these include changes in mitochondrial physiology or intracellular distribution that contribute to hypoxia resistance in high‐altitude deer mice (Peromyscus maniculatus). Mice from populations native to high and low altitudes were born and raised in captivity, and as adults were acclimated to normoxia or hypobaric hypoxia (equivalent to 4300 m elevation). We found that highlanders had higher respiratory capacities in the gastrocnemius (but not soleus) muscle than lowlanders (assessed using permeabilized fibres with single or multiple inputs to the electron transport system), due in large part to higher mitochondrial volume densities in the gastrocnemius. The latter was attributed to an increased abundance of subsarcolemmal (but not intermyofibrillar) mitochondria, such that more mitochondria were situated near the cell membrane and adjacent to capillaries. Hypoxia acclimation had no significant effect on these population differences, but it did increase mitochondrial cristae surface densities of mitochondria in both populations. Hypoxia acclimation also altered the physiology of isolated mitochondria by affecting respiratory capacities and cytochrome c oxidase activities in population‐specific manners. Chronic hypoxia decreased the release of reactive oxygen species by isolated mitochondria in both populations. There were subtle differences in O2 kinetics between populations, with highlanders exhibiting increased mitochondrial O2 affinity or catalytic efficiency in some conditions. Our results suggest that evolved changes in mitochondrial physiology in high‐altitude natives are distinct from the effects of hypoxia acclimation, and probably provide a better indication of adaptive traits that improve performance and hypoxia resistance at high altitudes.
Keywords: high altitude, high‐resolution respirometry, hypoxia, mitochondrial physiology, muscle physiology
Key points
Mitochondrial function changes over time at high altitudes, but the potential benefits of these changes for hypoxia resistance remains unclear.
We used high‐altitude‐adapted populations of deer mice, which exhibit enhanced aerobic performance in hypoxia, to examine whether changes in mitochondrial physiology or intracellular distribution in the muscle contribute to hypoxia resistance.
Permeabilized muscle fibres from the gastrocnemius muscle had higher respiratory capacities in high‐altitude mice than in low‐altitude mice.
Highlanders also had higher mitochondrial volume densities, due entirely to an enriched abundance of subsarcolemmal mitochondria, such that more mitochondria were situated near the cell membrane and adjacent to capillaries.
There were several effects of hypoxia acclimation on mitochondrial function, some of which were population specific, but they differed from the evolved changes in high‐altitude natives, which probably provide a better indication of adaptive traits that improve performance and hypoxia resistance at high altitudes.
Abbreviations
- CS
citrate synthase
- F1
first generation
- LDH
lactate dehydrogenase
- LN
leak respiration in the absence of ATP
- LT
leak respiration in the presence of ATP
- OXPHOS
oxidative phosphorylation
- P50
at 50% of inhibition of maximal respiration
partial pressure of oxygen
- PPM
OXPHOS respiration with pyruvate and malate
- PPMG
OXPHOS respiration with pyruvate, malate and glutamate
- PPMGS
OXPHOS respiration with pyruvate, malate, glutamate and succinate
- PTm
OXPHOS respiration with TMPD and ascorbate
- ROS
reactive oxygen species
- TEM
transmission electron microscope
- Vmax
maximal activity
- TMPD
N,N,N′,N′‐tetramethyl‐p‐phenylenediamine
maximum rate of oxygen consumption
Introduction
Mitochondrial function is essential for aerobic energy production, and limitations in the ability of mitochondria to produce ATP can impact whole‐animal performance. Environments with pervasive and unremitting hypoxia, such as at high altitudes, pose a severe challenge to aerobic energy production via oxidative phosphorylation that can affect organismal aerobic metabolism (Buskirk et al. 1967; West et al. 1983; Lui et al. 2015; Lau et al. 2017). Thus, for survival in high‐altitude environments, it is clear that the respiratory and circulatory systems play key roles in offsetting the detrimental effects of low environmental oxygen availability on tissue oxygen supply (Storz et al. 2010; Gilbert‐Kawai et al. 2014; Ivy & Scott, 2015). However, the importance of changes in mitochondrial physiology for hypoxia resistance, effective locomotion and thermogenesis at high altitudes is still poorly understood (Murray & Horscroft, 2016).
It has been suggested that increases in tissue oxidative capacity or changes in cellular distribution of mitochondrial volume may offset the reductions in circulatory O2 supply (Hochachka et al. 1983; Hardy et al. 2009). Although direct measurements of mitochondrial density and function are extremely rare, studies examining enzyme activities or muscle fibre composition suggest that mammals and birds native to high altitudes increase oxidative capacity in the muscle via either increases in mitochondrial density or by increases in oxidative fibre abundance (Barrie et al. 1975; Hochachka et al. 1983; Scott et al. 2009a; Lui et al. 2015). Interestingly, this does not appear to have occurred in humans native to high altitudes whose muscles have a similar aerobic capacity to lowland natives (Kayser et al. 1991, 1996; Hoppeler et al. 2003). Oxygen transport could also be enhanced by reducing the capillary to mitochondria diffusion distance through the redistribution of mitochondria volume to a subsarcolemmal location (Hardy et al. 2009; Murray & Horscroft, 2016), which would act synergistically to the increases in capillarity that have been observed in several highland species (León‐Velarde et al. 1993; Mathieu‐Costello, 2001; Lui et al. 2015). Bar‐headed geese – a species that flies at high altitudes during its migration across the Himalayas (Scott et al. 2015b) – have reduced intracellular diffusion distance by redistributing mitochondria closer to capillaries (Scott et al. 2009a), but this has yet to be observed in a high‐altitude mammal. These data suggest that an increase in muscle aerobic capacity and reduction in O2 diffusion distances are advantageous at high altitude. What is lacking are data supporting the hypothesis that altered mitochondrial density, distribution and physiology are under selective pressure in a high‐altitude mammal.
The effect of hypoxia acclimation on phenotypic plasticity has been more extensively studied, but principally in low‐altitude natives. There has been disagreement about the extent to which hypoxia acclimation affects tissue oxidative capacity. Many studies on lowland humans have reported that acclimatization to high‐altitude conditions in fact decreases muscle aerobic capacity. In some cases this is accompanied by a reduction in muscle fibre size but with the maintenance of capillary density, such that the ratio of capillarity to aerobic capacity increases (Hoppeler et al. 1990; Kayser et al. 1991; Jacobs et al. 2012; Levett et al. 2012). However, many of these observations may have been confounded by decreases in food consumption that can occur with ascent and leads to negative energy balance. In a more recent study when neutral energy balance was maintained, mitochondrial volume density in the muscle was shown to increase with prolonged exposure of lowland humans to high altitude (Jacobs et al. 2016). Comparable data in non‐human mammals are quite limited, but studies in lowland rodents have often suggested that hypoxia acclimation has relatively little effect on the oxidative capacity of muscle (León‐Velarde et al. 1993; Mathieu‐Costello & Agey, 1997; Beaudry & McClelland, 2010; Lui et al. 2015; Lau et al. 2017). The lack of consensus in the literature has made it difficult to assess whether changes in mitochondrial physiology seen at high altitudes are beneficial or alternatively, maladaptive to aerobic performance.
Studies of high‐altitude natives are extremely valuable for disentangling whether the acclimation response in lowlanders (or the various other forms of phenotypic plasticity) is beneficial or maladaptive at high altitudes, and whether it can be considered to facilitate or impede the process of evolutionary adaptation (Storz et al. 2010). North American deer mice (Peromyscus maniculatus) are an excellent model system for addressing this issue because their native range extends from below sea level in Death Valley, California to ∼4300 m above sea level (Hock, 1964; Snyder et al. 1982; Natarajan et al. 2015). Populations from high altitude must sustain high metabolic rates in hypoxia in the wild (Hayes, 1989), and evidence suggests there is strong positive selection on aerobic capacity () to support thermogenesis during cold highland winters (Hayes & O'Connor, 1999). Indeed high‐altitude deer mice have responded to this strong selection pressure, exhibiting a higher in hypoxia than their lowland counterparts (Cheviron et al. 2012; Lui et al. 2015). The underlying mechanism of these evolved differences appears to include a change in the phenotype of locomotory muscle. Highland mice in the wild have higher oxidative enzyme activities, a greater abundance of oxidative fibres, and higher capillarity in the gastrocnemius muscle than lowland mice (Cheviron et al. 2012; Scott et al. 2015a). These population differences persist in first generation (F1) progeny that are raised in captivity, but these evolved differences in muscle aerobic capacity were generally unaffected by hypoxia acclimation (Lui et al. 2015, Lau et al. 2017). However, the mitochondrial physiology that underlies the population differences in muscle phenotype is unknown, awaiting a detailed study of cell structure and mitochondrial function. The objective of this study was to examine the mechanisms underlying evolved population differences in muscle phenotype in lowland and highland deer mice, and the phenotypic plasticity of muscle in response to hypoxia acclimation. We assessed the respiratory capacity of muscle fibres, the volume density and distribution of mitochondria within fibres, and the functional properties of isolated muscle mitochondria in normoxic‐ or hypoxic‐acclimated lowland and highland mice.
Methods
Experimental animals
Captive breeding populations of high‐ and low‐altitude deer mice were established as previously described (Cheviron et al. 2012; Lui et al. 2015; Lau et al. 2017). High‐altitude mice (P.m. rufinus) were trapped on the summit of Mt Evans (Clear Creek County, Colorado; 39°35′18′′N, 105°38′38′′W) at ∼4300 m above sea level. Low‐altitude deer mice (P.m.nebracensis) were trapped in Nine‐Mile Prairie (Lancaster County, Nebraska; 40°52′12′′N, 96°48′20.3′′W) at ∼400 m above sea level. Populations were bred separately in captivity to produce F1 progeny, which were raised to adulthood in normoxia in common laboratory conditions with a constant temperature (25°C) and light cycle 12 h light:12 h dark. Mice were provided chow (Teklad Global Rodent Diets, Envigo, Mississauga, Ontario, Canada) and water ad libitum. By using F1 generation offspring that were born and raised in a common environment, we control for the effects of developmental and adult phenotypic plasticity. A mix of male and female mice were used in this study and ranged from 16.3 to 32.1 g in body mass, with a similar overlapping range of masses in each population. All animal care and experimentation followed the guidelines established by the Canadian Council on Animal Care, and were approved by the McMaster University Animal Research Ethics Board.
Experimental design
Adult F1 mice from each population were randomly assigned to one of two acclimation groups for a period of 6–10 weeks: (1) normobaric normoxia in standard lab room conditions, or (2) hypobaric hypoxia in hypobaric chambers set to an ambient pressure of 60 kPa (simulating the pressure at an altitude of ∼4300 m elevation). Atmospheric pressure was gradually decreased over the first 3 days in the hypoxia group, and kept at that pressure for the remainder of the acclimation period, using previously described methods and custom‐made hypobaric chambers (McClelland et al. 1998). The cages were cleaned every 3–4 days, which required that the hypobaric chambers be returned to normobaric for a brief period (<1 h). Distinct sets of mice were used for (i) respirometry with permeabilized muscle fibres, (ii) transmission electron microscopy, and (iii) respirometry and enzyme assays with isolated mitochondria (see below).
Mitochondrial respiration in permeabilized muscle fibres
Mice were anaesthetized using an isoflurane‐soaked cotton ball and then killed by cervical dislocation. The oxidative core of the gastrocnemius muscle and the soleus muscle were removed and placed in ice‐cold relaxing and preservation buffer (concentrations in mm: 2.77 CaK2EGTA, 7.23 K2EGTA, 5.77 Na2ATP, 6.56 MgCl2.6H2O, 20 taurine, 15 sodium phosphocreatine, 20 imidazole, 0.5 dithiothreitol, 50 methanesulphonate. The muscle fibres were then manually teased apart using dissecting probes (with the assistance of a stereomicroscope) and then permeabilized for 30 min in the same buffer containing saponin (50 μg ml−1). Samples then went through three 10 min rinses in respiration solution (in mm: 0.5 EGTA, 3 MgCl2, 60 potassium lactobionate, 20 taurine, 10 KH2PO4, 20 Hepes, 110 sucrose, 1 g l−1 fatty acid‐free bovine serum albumin; pH 7.1) and were weighed.
Respiration of the muscle fibres was measured using high‐resolution respirometry (Oxygraph‐2k, Oroboros Instruments, Innsbruck, Austria) in 2 ml of respiration buffer at a temperature of 37°C. The solution was oxygenated to an oxygen concentration of 450 μm by bubbling compressed oxygen into the chamber. After 5 min, leak respiration was stimulated with 5 mm pyruvate and 2 mm malate (L N). Oxidative phosphorylation (OXPHOS) respiration in the presence of 5 mm pyruvate and 2 mm malate was stimulated via multiple complexes of the electron transport system with progressive additions of 2 mm ADP (P PM, complex I), 20 mm glutamate (P PMG, complex I) and 20 mm of succinate (P PMGS, complexes I + II), waiting at least 2 min between each addition until a stable respiration rate could be measured. The chamber was then re‐oxygenated and cytochrome oxidase (complex IV) was maximally stimulated with the addition of 1.25 mm ADP, 2 mm ascorbate and 0.5 mm N,N,N′,N′‐tetramethyl‐p‐phenylenediamine (TMPD) (P Tm).
Transmission electron microscopy
The left hindlimb was removed from the mouse, and the knee and ankle joints were flexed and held at 90 deg angles. The gastrocnemius muscle was then tied to the bone with suture to hold its length in this position, and the lateral and medial heads of the gastrocnemius were trimmed away so that only the oxidative core remained. The muscle of the oxidative core was again secured firmly with suture on both ends, and was fixed at 4°C for 24–48 h in 2% glutaraldehyde in 0.1 m sodium cacodylate buffer at pH 7.4. Small muscle blocks were prepared and post‐fixed in 1% osmium tetroxide in 0.1 m sodium cacodylate buffer for 1 h, dehydrated through a graded ethanol series (50%, 70%, 70%, 95%, 95%, 100%, 100%) followed by two changes of 100% propylene oxide, and embedded in Spurr's resin (Spurr, 1969). Ultra‐thin sections were cut on a Leica UCT ultramicrotome and placed on copper grids. The sections were post‐stained with uranyl acetate and lead citrate. Images were collected using a transmission electron microscope (TEM; JEOL, Peabody, MA, USA).
We made unbiased measurements of mitochondrial volume density and cristae surface density across the oxidative core, using stereological methods that have been previously described (Weibel, 1979; Egginton, 1990; Scott et al. 2009a). Mitochondria were classified as subsarcolemmal if they were located between the cell membrane and the outer edges of peripheral myofibrils, and intermyofibrillar if they were instead surrounded by myofibrils on all sides. Sufficient images were analysed for each sample to account for heterogeneity, which was determined in preliminary measures as the number of replicate images necessary to yield a stable mean value for the individual mouse. Image locations were selected randomly across the muscle section, and therefore included the representative distribution of fibre types exhibited by the individual.
We also used a semi‐quantitative approach to assess the mitochondrial volume densities and intracellular distribution within each fibre type in the muscle. This analysis was important for evaluating whether overall differences in mitochondrial abundance or distribution could be explained by the known differences in muscle fibre‐type composition between populations (Lui et al. 2015; Scott et al. 2015a). We first re‐analysed light microscopy images of the oxidative core that were collected as part of a previous study (using the same treatment groups) that reported data for the entire gastrocnemius (Lui et al. 2015) – where full methodologies are described – which allowed us to determine the fibre‐type composition within the oxidative core for each population in each treatment group. Numerical densities of oxidative and fast glycolytic fibres were determined from stains of succinate dehydrogenase activity (which identifies oxidative fibres), and numerical densities of slow oxidative fibres were determined by staining for slow myosin immunoreactivity, each using stereological methods that have been well described (Weibel, 1979; Egginton, 1990). The numerical density of fast oxidative fibres was calculated as the difference between the densities of oxidative fibres and slow oxidative fibres. We then used these densities to estimate the proportion of fibres analysed by TEM that were of each fibre type, assuming that slow oxidative fibres had the highest mitochondrial volume density, fast oxidative fibres had the next highest, and fast glycolytic fibres had the lowest. For example, if our analyses by light microscopy revealed that a treatment group had 50% slow oxidative fibres on average, then the 50% of fibres with the highest mitochondrial volume density (measured by TEM) were classified as slow oxidative fibres for each individual in that treatment group.
Mitochondrial physiology of isolated mitochondria
Mice were killed as described above. The muscles from the entire left hindlimb (including the gastrocnemius and soleus) were removed (∼250–400 mg), and immediately transferred to 10 ml of ice‐cold isolation buffer (in mm: 100 sucrose, 50 Tris base, 5 MgCl2, 5 EGTA, 100 KCl, 1 ATP). The muscle was minced and then digested for 5 min in the same buffer containing protease (1 mg (g muscle tissue)−1). The digested muscle was then gently homogenized with six passes of a Potter‐Elvehjem Teflon on glass homogenizer (100 r.p.m.). Mitochondria were isolated via differential centrifugation at 4°C. Briefly, homogenates were centrifuged at 700 g for 10 min. The resulting supernatant was filtered through cheesecloth and then centrifuged at 1000 g for 10 min. The supernatant was centrifuged at 8700 g for 10 min and the pellet was resuspended in 10 ml of isolation buffer with bovine serum albumin (BSA, fatty acid‐free, at 1% mass:volume) and centrifuged at 8700 g. The pellet was resuspended in 10 ml of storage buffer (in mm: 0.5 EGTA, 3 MgCl2, 60 potassium methanesulphonate, 20 taurine, 10 KH2PO4, 20 Hepes, 110 sucrose, 0.02 vitamin E succinate, 2 pyruvate, 2 malate, pH 7.1) and centrifuged at 8700 g. The pellet was finally resuspended in 250–400 μl of storage buffer. Part of this mitochondrial suspension was kept on ice until mitochondrial physiology was measured, and the rest was homogenized in a glass tissue grinder and stored at −80°C for later use in enzyme assays (see below).
The physiology of isolated mitochondria was measured using high‐resolution respirometry and fluorometry (Oxygraph‐2k with O2k‐Fluorescence module, Oroboros Instruments, Innsbruck, Austria). Isolated mitochondria (approximately 40 μg mitochondrial protein) were added to the respirometry chamber with a final volume of 2 ml of respiration buffer (in mm: 0.5 EGTA, 3 MgCl2, 60 potassium lactobionate, 20 taurine, 10 KH2PO4, 20 Hepes, 110 sucrose, 1 g l−1 fatty acid‐free BSA; pH 7.1) at 37°C. Reactive oxygen species (ROS) was measured by fluorescence detection of resorufin (excitation wavelength of 525 nm and AmR filter set, Oroboros Instruments), which is produced from hydrogen peroxide (H2O2) and Ampliflu Red (Sigma‐Aldrich, Oakville, Ontario, Canada) in a reaction catalysed by horseradish peroxidase. Mitochondrial superoxide and H2O2 were thus detected together by adding superoxide dismutase (22.5 U ml−1; which catalyses the production of H2O2 from superoxide), horseradish peroxidase (3 U ml−1), and Ampliflu Red (15 μmol l−1) to the chamber. ROS emission was thus measured during the following manipulations as the molar rate of H2O2 released from mitochondria, by calibrating the fluorescent resorufin signal with the addition of exogenous H2O2. Leak respiration was stimulated with 5 mm pyruvate and 2 mm malate (L N). P/O ratios (ATP produced per oxygen atom consumed) were obtained twice with additions of 125 μm ADP. After each addition of ADP was consumed and the mitochondria reached leak state respiration (L T), maximal ADP‐stimulated respiration (P PM) was induced with 0.6–1 mm ADP. The respiratory control ratio (RCR) was calculated as the ratio of P PM/L T immediately before and after this saturating addition of ADP. Oxygen levels in the chamber were allowed to reach zero to determine the O2 kinetics of mitochondrial respiration (see below). The chamber was then re‐oxygenated, and the mitochondria were allowed to consume the remaining ADP and reach leak state respiration. The oxygen concentration was again allowed to reach zero to determine oxygen kinetics in the leak state. The chamber was again re‐oxygenated and cytochrome oxidase was maximally stimulated with the addition of 1.25 mm ADP, 2 mm ascorbate, and 0.5 mm TMPD.
Respiration (rate of O2 consumption) and ROS emission rates are expressed per milligram mitochondrial protein. DatLab 2 software (Oroboros Instruments) was used to fit respiration rate () data from the transitions into anoxia to the equation: = J max × /(P 50 + ), where J max is maximal respiration (uninhibited by hypoxia), is O2 tension of the respiration medium, and P 50 is the at which respiration is half of J max. Catalytic efficiency for O2 was calculated as J max/P 50. Delay in response time, internal zero drift and background O2 flux of the O2 sensor were accounted for as previously described (Gnaiger et al. 1995; Gnaiger & Lassnig, 2010).
Enzyme and electron transport chain assays
Apparent maximal activities (V max) of mitochondrial complexes I, II, III, IV and V as well as citrate synthase (CS) in isolated mitochondria were measured at 37°C as previously described (Kirby et al. 2007; Spinazzi et al. 2012) using a Spectromax Plus 384 microplate reader (Molecular Devices, Sunnyvale, CA, USA). Complexes III and IV were measured after a single freeze/thaw cycle in isotonic buffer (100 mm KCl2; 25 mm KH2PO4; 5 mm MgCl2), complexes I, II and V were measured after a second freeze/thaw cycle in hypotonic buffer (25 mm KH2PO4; 5 mm MgCl2), and CS was measured after a third freeze/thaw cycle (in 100 mm Tris, pH 8). Assays were carried out in the following conditions (in mm, unless stated otherwise). Complex I: 0.2 NADH, 0.3 KCN, 0.06 coenzyme Q10, 0.01 rotenone, and 3 mg ml−1 BSA in 50 KH2PO4 (pH 7.5); complex II: 20 succinate, 0.3 KCN, 0.1 dichlorophenolindophenol (DCPIP), and 0.05 decylubiquinone (DUB) in 25 KH2PO4 (pH 7.5); complex III: 0.075 oxidized cytochrome c, 0.5 KCN, 0.1 EDTA, 0.1 decylubiquinol in 25 KH2PO4 (pH 7.5); complex IV: 0.2 reduced cytochrome c and 0.3 KCN in 50 KH2PO4 (pH 7.0); complex V, 5 ATP, 1 phosphoenolpyruvate, 0.2 NADH, 1 U ml−1 pyruvate kinase, 1 U ml−1 lactate dehydrogenase (LDH), and 0.0005 oligomycin in 50 KH2PO4 (pH 7.5); CS: 0.5 acetyl‐CoA, 0.15 dithiobisnitrobenzoic acid (DTNB), 0.5 oxaloacetate, 0.1% v/v Triton X‐100, in 100 Tris (pH 8.0).
Statistical analysis
Data are presented as means ± SEM. Two‐factor ANOVA and Bonferroni multiple‐comparisons post‐tests were used as appropriate to determine the main effects of population, altitude and acclimation environment, as well as their interaction. A significance level of P < 0.05 was used throughout.
Results
Respiratory capacities of permeabilized skeletal muscles
The respiratory capacity of permeabilized fibres from the gastrocnemius muscle was elevated in high‐altitude deer mice (Fig. 1 A). ADP‐stimulated OXPHOS respiration supported by pyruvate and malate (P PM) was ∼40% greater in highland mice than in the lowland mice (F 1,26 = 16.88; P = 0.0004), but there was no significant main effect of acclimation (F 1,26 = 0.062; P = 0.8041) nor a significant effect of population × acclimation interaction (F 1,26 = 0.040; P = 0.8426). Similarly, maximal respiration via complex I with the subsequent addition of glutamate (P PMG) (F 1,25 = 12.022; P = 0.002) and complexes I + II respiration with the addition of succinate (P PMGS) (F 1,26 = 15.354; P < 0.001) were both higher in highland mice compared to lowland mice. There was no main effect of acclimation on P PMG (F 1,25 = 0.208; P = 0.652) or P PMGS (F 1,26 = 0.204; P = 0.656), and there were no significant interactions (P PMG, F 1,25 = 0.0424, P = 0.838; P PMGS, F 1,26 = 0.031, P = 0.862). Maximal respiration via complex IV stimulated with ascorbate and TMPD (P Tm) followed a similar pattern, with a significant main effect of population (F 1,20 = 5.561; P = 0.029) but with no influence of hypoxia acclimation (F 1,20 = 0.902; P = 0.354) or a significant population × acclimation interaction (F 1,20 = 1.855; P = 0.188). Leak state respiration in the absence of ATP (L N) in the gastrocnemius muscle was not significantly different between the populations (F 1,26 = 1.635; P = 0.212) and there was no main effect of acclimation (F 1,26 = 1.342; P = 0.257) or any significant interaction effect (F 1,26 = 0.733; P = 0.400).
Figure 1. The respiratory capacities of permeabilized muscle fibres from the gastrocnemius (A), but not the soleus (B), were greater in highland deer mice than in lowland deer mice.
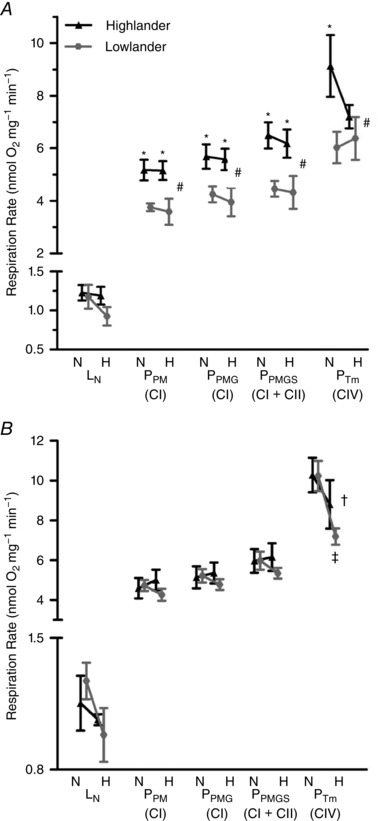
Leak respiration was measured in the absence of ATP (L N: malate, pyruvate), and oxidative phosphorylation was measured with substrates of complex I (P PM: malate, pyruvate, ADP; P PMG: malate, pyruvate, glutamate, ADP), complexes I and II (P PMGS: malate, pyruvate, glutamate, succinate, ADP) and maximal complex IV stimulation (P Tm: ADP, ascorbate, TMPD). A, n = 8 for normoxia‐acclimated individuals, n = 7 for hypoxia‐acclimated individuals for L N, P PM, P PMG, P PMGS; n = 6 individuals for each treatment group for P Tm. B, n = 5 individuals for each treatment group. N, normoxia acclimation; H, hypoxia acclimation. #Significant main effect of population. †Significant main effect of hypoxia acclimation. *Significant pairwise differences between the highland and lowland populations within the same acclimation environment. ‡Significant pairwise differences in response to hypoxia acclimation within a population.
In contrast to the gastrocnemius, the respiratory capacity of the soleus muscle was similar in both populations (Fig. 1 B). There were no significant effects of population (F 1,16 = 0.532; P = 0.476), acclimation (F 1,16 = 0.004; P = 0.949), or population × acclimation interaction (F 1,16 = 1.112; P = 0.307) on P PM. Similarly, there were no main effects of population, acclimation, or their interaction on P PMG (population, F 1,16 = 0.340, P = 0.568; acclimation, F 1,16 = 0.060, P = 0.809; population × acclimation, F 1,16 = 0.575, P = 0.459) or P PMGS (population, F 1,16 = 0.583, P = 0.456; acclimation, F 1,16 = 0.175, P = 0.681; interaction, F 1,16 = 0.611; P = 0.446). P Tm decreased with hypoxia acclimation (F 1,16 = 6.818; P = 0.019) by 17% in highlanders and 42% in lowlanders, but there were no significant effects of population (F 1,16 = 0.929; P = 0.350) or population × acclimation interaction (F 1,16 = 0.815; P = 0.380). L N was not affected by population and/or treatment (population, F 1,16 = 0.027, P = 0.871; acclimation, F 1,16 = 2.693, P = 0.120; population × acclimation, F 1,16 = 0.760, P = 0.396).
Mitochondrial abundance and structure
Highland deer mice had greater mitochondrial volume densities in the gastrocnemius muscle, entirely attributable to a greater abundance of subsarcolemmal mitochondria (Fig. 2). Representative electron micrographs from the oxidative core of highland and lowland deer mice are shown in Fig. 2 A–D, with arrow denoting subsarcolemmal mitochondria and arrowhead denoting intermyofibrillar mitochondria. The total mitochondrial volume density was 25% greater in highland deer mice (F 1,16 =18.56, P < 0.001), but there were no effects of hypoxia acclimation (F 1,16 = 0.049, P = 0.827) or population × acclimation interaction (F 1,16 = 0.025, P = 0.877). The population difference in the abundance of subsarcolemmal mitochondria was even larger, with the volume density of subsarcolemmal mitochondria 79% greater in highlanders than in lowlanders (population effect, F 1,16 = 54.274, P < 0.001), but there were no population differences in the abundance of intermyofibrillar mitochondria (Fig 2 G, F 1,16 = 0.01, P = 0.923). Hypoxia acclimation had no significant effects on the abundances of subsarcolemmal (F 1,16 = 0.274; P = 0.608) or intermyofibrillar (F 1,16 = 0.456; P = 0.509) mitochondria, and the population × acclimation interactions were not significant (subsarcolemmal, F 1,16 = 0.274, P = 0.608; intermyofibrillar, F 1,16 = 0.456, P = 0.509).
Figure 2. Highland deer mice had a higher mitochondrial density in the gastrocnemius muscle, due entirely to an increased abundance of subsarcolemmal mitochondria.
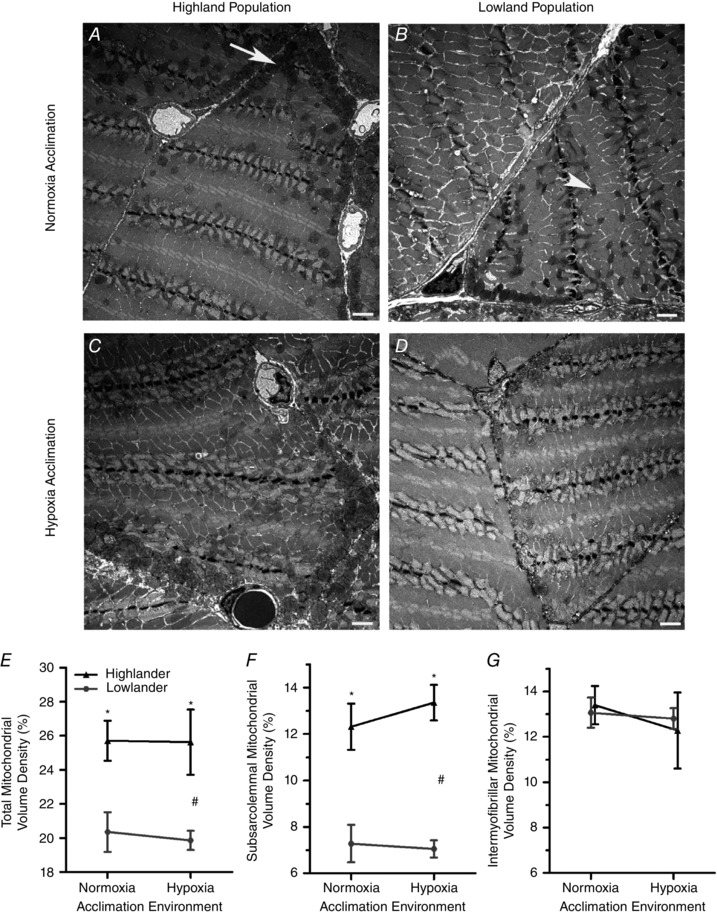
Representative transmission electron micrographs from the oxidative core of highland (A) and lowland (B) deer mice acclimated to normoxia, and highland (C) and lowland (D) deer mice acclimated to hypoxia. E–G, volume densities of all mitochondria (which includes both subsarcolemmal and intermyofibrillar mitochondria) (E), subsarcolemmal mitochondria (F) and intermyofibrillar mitochondria (G). n = 5 individuals for each treatment group. Data points within an acclimation environment are offset for clarity. Scale bar represents 2 μm. Arrow, subsarcolemmal mitochondria; arrowhead, intermyofibrillar mitochondria. #Significant main effect of population. *Significant pairwise differences between the highland and lowland populations within the same acclimation environment.
The population differences in mitochondrial abundance cannot be attributed to any differences in fibre‐type composition in the gastrocnemius muscle, and occurred in both slow oxidative and fast oxidative fibre types. The abundances of slow and fast oxidative fibres far exceeded those of fast glycolytic fibres, and there were no significant main effects of population on muscle fibre types (Table 1), suggesting that previously observed population differences in fibre‐type composition in the gastrocnemius (Lui et al. 2015) were driven largely by regions outside of the oxidative core. Average numerical density for each treatment group were used to estimate the mitochondrial volume densities within each fibre type, as described in the Methods. In doing so, we found that high‐altitude mice generally had greater mitochondrial volume densities in both slow oxidative and fast oxidative fibre types that were entirely attributable to greater volume densities of subsarcolemmal mitochondria (Table 1). Due to the small number of glycolytic fibres in the oxidative core, we did not evaluate mitochondrial volume densities in this fibre type.
Table 1.
Numerical densities and mitochondrial volume densities within each fibre type in the oxidative core of the gastrocnemius muscle of deer mice
| Acclimation environment | Lowlanders | Highlanders | Main effect variable | F | P | |
|---|---|---|---|---|---|---|
| Slow oxidative fibres | ||||||
| NN (I,m) | Normoxia | 0.506 ± 0.035 | 0.499 ± 0.031 | Pop. | 0.0004 | 0.983 |
| Hypoxia | 0.407 ± 0.042 | 0.412 ± 0.037 | Acc. | 6.034 | 0.020 | |
| Pop. × Acc. | 0.024 | 0.878 | ||||
| VV (mt,I) | Normoxia | 26.3 ± 0.63 | 32.2 ± 1.46* | Pop. | 12.608 | 0.003 |
| Hypoxia | 28.5 ± 0.85 | 31.9 ± 1.93 | Acc. | 0.555 | 0.467 | |
| Pop. × Acc. | 0.793 | 0.386 | ||||
| VV (ssm,I) | Normoxia | 10.7 ± 0.764 | 15.8 ± 1.06* | Pop. | 40.823 | <0.001 |
| Hypoxia | 11.9 ± 0.667 | 17.3 ± 0.709* | Acc. | 2.762 | 0.116 | |
| Pop. × Acc. | 0.015 | 0.905 | ||||
| VV (imm,I) | Normoxia | 15.6 ± 0.695 | 16.4 ± 1.14 | Pop. | 0.175 | 0.681 |
| Hypoxia | 16.5 ± 0.835 | 14.7 ± 1.93 | Acc. | 0.081 | 0.776 | |
| Pop. × Acc. | 1.032 | 0.325 | ||||
| Fast oxidative fibres | ||||||
| NN (IIa,m) | Normoxia | 0.438 ± 0.057 | 0.429 ± 0.032 | Pop. | 0.586 | 0.450 |
| Hypoxia | 0.476 ± 0.044 | 0.556 ± 0.045 | Acc. | 3.329 | 0.079 | |
| Pop. × Acc. | 0.917 | 0.347 | ||||
| VV (mt,IIa) | Normoxia | 15.1 ± 1.769 | 20.5 ± 1.18* | Pop. | 14.765 | 0.001 |
| Hypoxia | 15.5 ± 1.386 | 22.1 ± 1.82* | Acc. | 0.410 | 0.531 | |
| Pop. × Acc. | 0.159 | 0.001 | ||||
| VV (ssm,IIa) | Normoxia | 4.07 ± 1.072 | 9.34 ± 1.01* | Pop. | 46.978 | <0.001 |
| Hypoxia | 4.30 ± 0.444 | 11.0 ± 0.825* | Acc. | 1.188 | 0.292 | |
| Pop. × Acc. | 0.677 | 0.423 | ||||
| VV (imm,IIa) | Normoxia | 11.0 ± 1.083 | 11.1 ± 0.509 | Pop. | 0.0001 | 0.991 |
| Hypoxia | 11.2 ± 0.971 | 11.1 ± 1.42 | Acc. | 0.002 | 0.964 | |
| Pop. × Acc. | 0.0085 | 0.928 | ||||
| Glycolytic fibres | ||||||
| NN (IIb,m) | Normoxia | 0.057 ± 0.025 | 0.067 ± 0.015 | Pop. | 1.647 | 0.209 |
| Hypoxia | 0.109 ± 0.033 | 0.040 ± 0.050* | Acc. | 0.302 | 0.587 | |
| Pop. × Acc. | 2.837 | 0.102 | ||||
NN (I,m), numerical density of slow oxidative fibres; VV(mt,I), total mitochondrial volume density (as % fibre volume) of slow oxidative fibres; VV(ssm,I), subsarcolemmal mitochondrial volume densities of slow oxidative fibres; VV(imm,I), intermyofibrillar mitochondrial volume densities of slow oxidative fibres; NN (IIa,m), numerical density of fast oxidative fibres; VV(mt,IIa), total mitochondrial volume density of fast oxidative fibres; VV(ssm,IIa), subsarcolemmal mitochondrial volume densities of fast oxidative fibres; VV(imm,IIa), total mitochondrial volume density of fast oxidative fibres; NN (IIb,m) numerical density of glycolytic fibres; Pop., population; Acc., acclimation; Pop. × Acc., interaction of population and acclimation. For numerical densities, n = 9 individuals for each treatment group, except n = 7 for hypoxia‐acclimated lowlanders. For mitochondrial volume densities, n = 5 individuals for each treatment group. *Significant pairwise differences between the high and lowland populations within the same acclimation environment.
There were no significant population differences in the surface density of mitochondrial cristae, but exposure to chronic hypoxia induced increases of this trait in both populations (Fig. 3). Cristae surface density increased by 14% in highland mice and 15% in lowland mice in response to hypoxia acclimation in intermyofibrillar mitochondria (F 1,16 = 10.518; P = 0.005). A similar pattern was observed in subsarcolemmal mitochondria, with hypoxia acclimation increasing cristae surface density by 11% in highland mice and 7% in lowland mice, but the main effect of acclimation was only marginally significant (F 1,16 = 4.353; P = 0.053). However, cristae surface density did not differ between populations in either subsarcolemmal (main effect of population, F 1,16 = 0.865; P = 0.366) nor intermyofibrillar (F 1,16 = 0.554; P = 0.467) mitochondria, and there were no significant population × acclimation interactions (subsarcolemmal, F 1,16 = 0.215, P = 0.649; intermyofibrillar, F 1,16 = 0.00193, P = 0.966).
Figure 3. Hypoxia acclimation increased the density of cristae surface in the mitochondria.
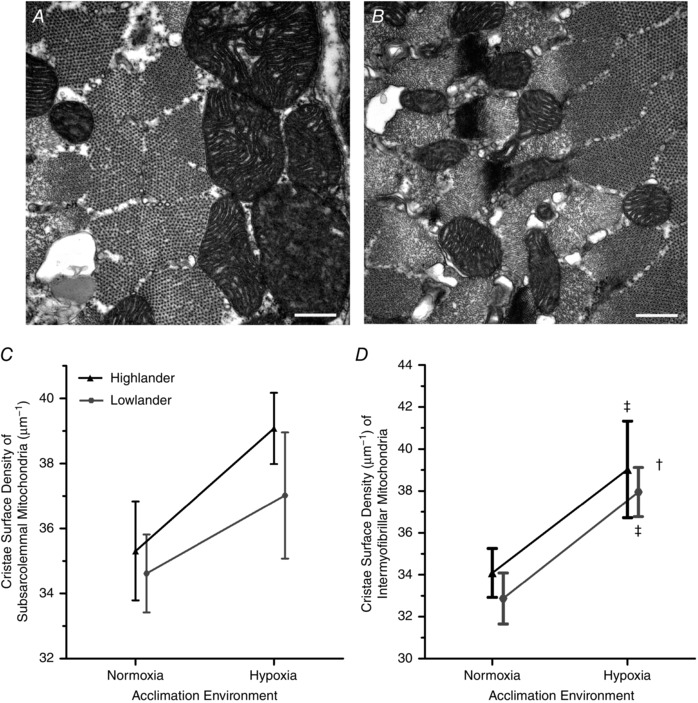
Representative transmission electron micrographs of subsarcolemmal mitochondria (A) and intermyofibrillar mitochondria (B) from the gastrocnemius muscle of a highland deer mouse. Cristae surface density (μm2 surface/μm3 mitochondria) of subsarcolemmal mitochondria (C) and intermyofibrillar mitochondria (D) of highland and lowland deer mice. n = 5 individuals for each treatment group. Data points within an acclimation environment are offset for clarity. †Significant main effect of acclimation. ‡Significant pairwise differences in response to hypoxia acclimation within a population.
Mitochondrial physiology of isolated mitochondria
Isolated mitochondria of highlanders had higher mitochondrial respiration rates than those from lowland deer mice acclimated to normoxia, but rates were similar between the populations after hypoxia acclimation (Fig. 4 A). P PM was 20% greater in normoxic highland mice than in the corresponding lowland mice (F 1,24 = 6.207; P = 0.020). However, respiration increased by ∼32% in response to hypoxia acclimation in lowland mice, whereas highland mice showed the opposite trend, such that there was a significant population × acclimation interaction (F 1,24 = 6.503; P = 0.018) but no clear overall effect of acclimation (F 1,24 = 0.552; P = 0.465). P Tm followed the same pattern, with a significant main effect of population (F 1,22 = 11.1, P = 0.003) in the normoxia group and population × acclimation interaction (F 1,22 = 11.05, P = 0.0031), but no main effect of hypoxia acclimation (F 1,22 = 0.307; P = 0.585). In contrast, L N did not differ significantly between the populations (F 1,24 = 0.821; P = 0.374) or in response to hypoxia acclimation (F 1,24 = 0.833; P = 0.371), and the population × acclimation interaction was not significant (F 1,24 = 2.675; P = 0.115). Similarly, there were no main effects of population (F 1,24 = 0.126; P = 0.726) or acclimation (F 1,24 = 0.0002; P = 0.989) on leak state respiration in the presence of ATP (L T) but there was a significant population × acclimation interaction (F 1,24 = 4.44; P = 0.046) (Fig. 4 A). Respiratory control ratios (RCRs) were always above 5, but the high‐altitude population had a higher RCR than the lowland population (Table 2). In contrast, P/O ratios showed no significant effect of population or hypoxia acclimation (Table 2). There were also subtle differences in oxygen kinetics between populations. Mitochondria from highland mice exhibited a significantly greater O2 affinity (lower P 50) during leak respiration. The catalytic efficiency for oxygen (respiration/P 50), a measure that best reflects hypoxia sensitivity because it indicates the magnitude of respiration that can be sustained at low (Gnaiger et al. 1998) was higher in highlanders during P PM (Table 2).
Figure 4. Respiration rates (A) and enzyme activities (B) in mitochondria isolated from the hindlimb muscles of deer mice.
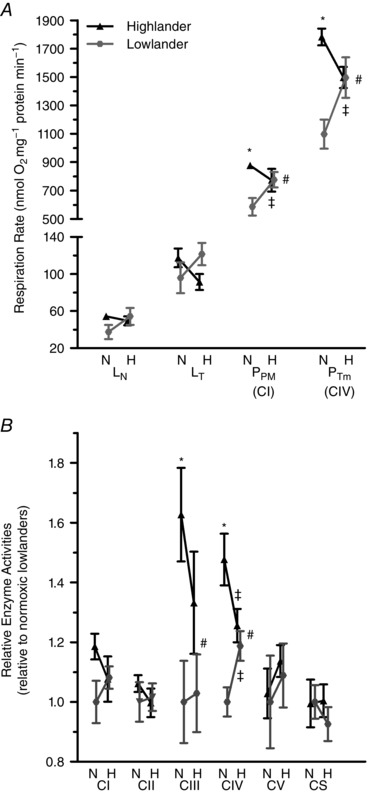
A, leak respiration was measured with pyruvate and malate, both in the absence (L N) and presence (L T) of ATP, oxidative phosphorylation was measured with substrates of complex I (P PM: malate, pyruvate, ADP) and with maximal stimulation of complex IV (P Tm: ADP, ascorbate, TMPD). n = 7 individuals for each treatment group, except n = 6 for normoxia‐acclimated highland and lowland mice for P Tm. B, mitochondrial complex activities of lowland mice acclimated to normoxia were set to 1 to ease comparison, which equalled the following absolute activities for each enzyme (in μmol (mg protein)−1 min−1): complex I (CI) = 2.16, complex II (CII) = 0.82, complex III (CIII) = 1.87, complex IV (CIV) = 4.34, complex V (CV) = 5.19, and citrate synthase (CS) = 5.13. n = 7 individuals for each treatment group for CI, CII, CIII, CIV and CS; n = 6 individuals for each treatment group for CV. Enzyme assays were conducted on the isolated mitochondria that remained after the respiration trials were conducted. N, normoxia acclimation; H, hypoxia acclimation. #Significant main effect of ancestry. †Significant main effect of acclimation. *Significant pairwise differences between the high‐ and lowland populations within the same acclimation environment. ‡Significant pairwise differences in response to hypoxia acclimation within a population.
Table 2.
Mitochondrial coupling and oxygen kinetics of lowland and highland deer mice acclimated to normoxia or hypoxia
| Acclimation environment | Lowlanders | Highlanders | Main effect variable | F | P | |
|---|---|---|---|---|---|---|
| RCR | Normoxia | 6.68 ± 0.647 | 7.85 ± 0.769 | Pop. | 9.85 | 0.005 |
| Hypoxia | 5.87 ± 0.411 | 8.49 ± 0.452* | Acc. | 0.019 | 0.891 | |
| Pop. × Acc. | 1.43 | 0.244 | ||||
| P/O ratio | Normoxia | 2.8 ± 0.10 | 2.99 ± 0.061* | Pop | 1.44 | 0.242 |
| Hypoxia | 2.99 ± 0.035ǂ | 2.98 ± 0.0759 | Acc. | 3.19 | 0.087 | |
| Pop. × Acc. | 3.59 | 0.071 | ||||
| Oxygen kinetics in P PM | ||||||
| P 50 | Normoxia | 0.074 ± 0.011 | 0.058 ± 0.004 | Pop. | 1.098 | 0.307 |
| Hypoxia | 0.069 ± 0.005 | 0.066 ± 0.007 | Acc. | 0.185 | 0.672 | |
| Pop. × Acc. | 0.474 | 0.499 | ||||
| Catalytic efficiency | Normoxia | 8113 ± 626 | 14429 ± 1661* | Pop. | 4.432 | 0.047 |
| Hypoxia | 11517 ± 1700 | 13125 ± 2866 | Acc. | 0.241 | 0.629 | |
| Pop. × Acc. | 1.47 | 0.238 | ||||
| Oxygen kinetics in L T | ||||||
| P 50 | Normoxia | 0.028 ± 0.004 | 0.019 ± 0.003* | Pop. | 5.647 | 0.028 |
| Hypoxia | 0.022 ± 0.003 | 0.018 ± 0.001 | Acc. | 1.401 | 0.251 | |
| Pop. × Acc. | 0.894 | 0.563 | ||||
| Catalytic efficiency | Normoxia | 8720 ± 1841 | 12181 ± 1984 | Pop. | 1.697 | 0.208 |
| Hypoxia | 10202 ± 762 | 10145 ± 1222 | Acc. | 0.015 | 0.905 | |
| Pop. × Acc. | 1.81 | 0.195 | ||||
RCR, respiratory control ratio (P PM/L T); P/O ratio, ATP produced per oxygen atom consumed; P PM, OXPHOS respiration with pyruvate and malate; L T, leak respiration in the presence of ATP; P 50, at 50% inhibition of maximal respiration (expressed in kPa); catalytic efficiency, the quotient of maximum O2 flux and P 50 (expressed in units nmol O2 (mg protein) −1 min−1 kPa−1); Pop., population; Acc., acclimation; Pop. × Acc., interaction of population and acclimation. n = 7 individuals for each treatment group for P/O ratios and respiratory control ratios. n = 6 individuals for each treatment group, except n = 5 for normoxia‐acclimated highland mice for oxygen kinetics. *Significant pairwise differences between the high and lowland populations within the same acclimation environment.
The V max of complex III and IV in the electron transport system exhibited similar patterns of variation to those for respiration in isolated mitochondria (Fig. 4 B). Complex III activity was ∼51% higher in the highland population compared to the lowland population in normoxia, but population values converged after hypoxia acclimation (population, F 1,24 = 8.298, P = 0.008; acclimation, F 1,24 = 0.283, P = 0.600; interaction, F 1,24 = 0.544, P = 0.468). Similarly, complex IV activity was ∼52% higher in the highland population compared to the lowland population in normoxia, and they converged after acclimation (population, F 1,24 = 19.035, P ≤ 0.001; acclimation, F 1,24 = 0.108, P = 0.745; interaction, F 1,24 = 11.136, P = 0.003). In contrast, there were no significant differences in activity for complex I (population, F 1,24 = 1.755, P = 0.198; acclimation, F 1,24 = 0.049, P = 0.826; interaction, F 1,24 = 1.955, P = 0.175), complex II (population, F 1,24 = 0.053, P = 0.820; acclimation, F 1,24 = 0.252, P = 0.621; interaction, F 1,24 = 0.351, P = 0.559), complex V (population, F 1,20 = 0.156, P = 0.697; acclimation, F 1,20 = 0.142, P = 0.710; interaction, F 1,20 = 0.002, P = 0.965), or citrate synthase (population, F 1,24 = 0.319, P = 0.577; acclimation, F 1,24 = 0.549, P = 0.466; interaction, F 1,24 = 0.482, P = 0.494).
The emission of reactive oxygen species (ROS) from mitochondria was reduced by hypoxia acclimation, but did not differ between populations (Fig. 5). The rates of ROS emission reported were measured at ∼2.5 kPa O2, to control for any potential effects of on this variable. Mitochondrial ROS emission decreased in both populations after hypoxia acclimation during both P PM (F 1,17 = 13.33, P = 0.002) and L T (F 1,23 = 4.469, P = 0.0456). There was no main effect of population on ROS emission during P PM (F 1,17 = 0.734, P = 0.118) or L T respiration (F 1,23 = 0.631, P = 0.237), nor were there significant population × acclimation interactions (P PM, F 1,17 = 1.43, P = 0.248; L T, F 1,23 = 0.0121, P = 0.913).
Figure 5. The rate of emission of reactive oxygen species (ROS) from mitochondria during oxidative phosphorylation (P PM; A) and leak (L T; B) respiration.
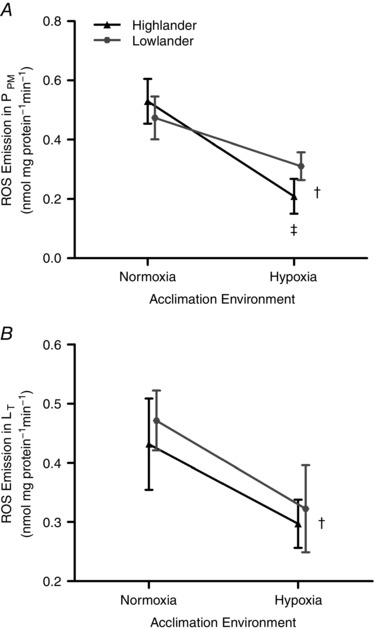
ROS emission was coupled to H2O2 production using exogenous superoxide dismutase and was measured fluorometrically using Ampliflu Red. Because ROS emission rates may be dependent on O2 tension (), the ROS emission rates shown were all measured at ∼2.5 kPa. A, n = 5 individuals for each treatment group, except n = 6 for hypoxia‐acclimated lowland mice. B, n = 7 individuals for each treatment group, except n = 6 for hypoxia‐acclimated lowland mice. †Significant main effect of acclimation. ‡Significant pairwise differences in response to hypoxia acclimation within a population.
Discussion
The goal of this study was to explore if high‐altitude deer mice offset reductions in circulatory O2 supply during hypoxia with increases in tissue oxidative capacity or changes in mitochondrial distribution, thus contributing to the improvements in aerobic capacity () in hypoxia exhibited by high‐altitude deer mice compared to low‐altitude deer mice (Cheviron et al. 2012; Lui et al. 2015). Highland deer mice must sustain high metabolic rates for adequate aerobic locomotion and thermogenesis in the wild (Hayes, 1989, Hayes & O'Connor, 1999). We found that skeletal muscles of high‐altitude deer mice have higher respiratory capacities and more abundant subsarcolemmal mitochondria compared to low‐altitude deer mice. These evolved differences were distinct from the effects of hypoxia acclimation which increased cristae surface density of mitochondria and reduced reactive oxygen species production in both populations. Evolved increases in oxidative capacity and a redistribution of mitochondria next to the cell membrane and adjacent to capillaries in skeletal muscle may therefore be adaptive for counteracting hypoxia and providing an adequate supply of ATP to support the high demands of exercise and shivering thermogenesis at high altitudes. There is strong positive selection on in high‐altitude populations, because individuals with a high to support thermogenesis in the cold have a distinct survival advantage during harsh winters (Hayes & O'Connor, 1999), so the observed changes in muscle oxidative capacity and mitochondrial distribution probably contribute to improving fitness in the wild.
High‐altitude deer mice express a more oxidative phenotype in the gastrocnemius muscle, enhancing its overall capacity for oxygen consumption. Due to the hyperbolic relationship between oxygen tension and mitochondrial respiration rate (Gnaiger, 2001), having a more oxidative phenotype can help counteract impairments in respiration that can be induced by intracellular hypoxia (Hochachka, 1985). Oxidative capacity of a muscle can be augmented by (i) increasing the abundance of oxidative fibres, (ii) increasing mitochondrial volume density within each muscle fibre, and/or (iii) increasing the respiratory capacity of individual mitochondria. We previously found that gastrocnemius muscles of highland deer mice have more abundant oxidative fibres compared to lowland deer mice across the entire gastrocnemius muscle (Lui et al. 2015), which appears to be attributed largely to the regions outside of the oxidative core (i.e. the lateral and medial heads of the muscle) based on our re‐analysis of those data (Table 1). However, muscle fibres in the oxidative core of the gastrocnemius muscle had much higher respiratory capacities (Fig. 1) and mitochondrial volume densities are higher in highland mice compared to the lowland mice (Fig. 2), independent of any population differences in fibre‐type composition. Mitochondrial volume densities were very high in the oxidative fibres of highland deer mice, and much higher than in many lowland mammals. Mitochondrial volume densities vary greatly between fibre types, muscles and species. Aerobic muscle fibres generally have mitochondrial volume densities of 3–8% in humans (Alway, 1991) and 1–14% in various other mammals (Mathieu et al. 1981; Desplanches et al. 1990). The mitochondrial abundances we observed here in the oxidative core of the gastrocnemius of high‐altitude deer mice (∼26%) approach values only seen in the flight muscles of small birds with extremely high metabolic rates, such as hummingbirds (Suarez et al. 1991).
The higher mitochondrial volume densities found in high‐altitude deer mice can be attributed to a greater abundance of subsarcolemmal mitochondria in oxidative muscle fibres, which is probably advantageous for mitochondrial O2 supply in hypoxic environments. A preferential overabundance of subsarcolemmal mitochondria in the muscle of highland mice situates more mitochondria adjacent to capillaries, and thus reduces the diffusion distance for oxygen. In general, the non‐uniform distribution of mitochondria in muscle fibres probably results from reaction–diffusion constraints during aerobic metabolism (Boyle et al. 2003; Hardy et al. 2009). Mathematical modelling has shown that redistributing mitochondria closer to the cell periphery helps muscle fibres overcome diffusion limitations of oxygen delivery (Kinsey et al. 2011; Pathi et al. 2011, 2013). As predicted by these models, increases in muscle fibre size have been associated with a redistribution of mitochondria to the periphery of the cell (Boyle et al. 2003; Hardy et al. 2009; Pathi et al. 2012). Interestingly, the oxidative fibres of high‐altitude deer mice are larger in size (Lui et al. 2015), which could provide an additional stimulus (in addition to hypoxia) for the observed subsarcolemmal redistribution of mitochondria. Similar to highland deer mice, oxidative fibres in the pectoralis muscle of the high‐flying bar‐headed goose have a greater proportion of mitochondria in a subsarcolemmal location compared to low altitude geese (Scott et al. 2009a, 2015b). In both high‐altitude taxa, the mitochondrial redistribution is associated with increases in muscle capillarity (Scott et al. 2009a; Lui et al. 2015), which should together improve O2 supply in hypoxia and improve performance at high altitudes.
Because subsarcolemmal mitochondria are further from cellular ATPases than intermyofibrillar mitochondria, the diffusion distance could foreseeably be greater for the ATP produced by the more abundant subsarcolemmal mitochondria in highland deer mice. However, recent evidence suggests that the complex and pervasive interconnections within the mitochondrial reticulum of muscle might preclude this possibility (Glancy et al. 2015). According to Glancy et al. (2015) there is a distribution of labour between subsarcolemmal mitochondria, which are specialized for consuming oxygen and generating the proton‐motive force, and intermyofibrillar mitochondria, which use the proton‐motive force for ATP production. The skeletal muscle of highland deer mice may thus have a greater ability to take up and consume oxygen and generate proton‐motive force by virtue of their increased abundance of subsarcolemmal mitochondria, while the ability to produce ATP close to cellular ATPases is maintained because volume densities of intermyofibrillar mitochondria are the same between highland and lowland populations. Otherwise, enhanced shuttling of ATP, such as greater use of the phosphocreatine shuttle (Ventura‐Clapier et al. 1998), could help counteract increases in ATP diffusion distance. This may be the case in bar‐headed geese, based on observations that creatine sensitivity of mitochondrial respiration is enhanced compared to low‐altitude geese, which suggests that the redistribution of mitochondria towards the subsarcolemma may exist in concert with an active phosphocreatine shuttle to help improve the coupling of ATP supply and demand (Scott et al. 2009b).
Hypoxia acclimation had no effect on the relative proportion of subsarcolemmal mitochondria in either population of deer mice. In contrast, humans after high‐altitude acclimatization show a counterintuitive loss of mitochondrial volume density that is greatest in the subsarcolemmal fraction (Murray & Horscroft, 2016). Perhaps the difference in responses between humans and deer mice is the result of experimental design or in the severity of the hypoxia exposures. Brief periods of normoxia, necessary for cage cleaning in the current study, may have potentially influenced the acclimation response in deer mice. However, these brief periods might be expected to have a modest impact relative to the effects of the much longer‐term hypoxia acclimation. Alternatively, the hypoxia used to simulate the native high altitude range of deer mice (4300 m) was less than that needed to induce the changes in mitochondrial physiology that have been observed in humans exposed to higher elevations (D'Hulst & Deldicque, 2017).
Hypoxia acclimation had some similar effects on mitochondrial structure in both highland and lowland deer mice, but distinct effects on mitochondrial function between populations. The cristae surface density of mitochondria increased with hypoxia acclimation in both subsarcolemmal and intermyofibrillar mitochondria in both populations. In lowland deer mice, this increased surface density of cristae was associated with increases in both cytochrome c oxidase activity and respiratory capacity of isolated mitochondria after hypoxia acclimation. In contrast, hypoxia acclimation decreased cytochrome c oxidase activity in highland deer mice, in concert with a slight but non‐significant reduction in pyruvate‐stimulated state 3 respiration. Aerobic capacity and mitochondrial function can be influenced by activity level (Hood, 2001; Weibel et al. 2004; Lira et al. 2010), so it is possible that our results were influenced by population differences in activity during hypoxia acclimation. However, both populations were housed in the same conditions and given the same access to food, so any differences in activity would be due to innate (evolved) behavioural differences between populations.
How can the observed effects of hypoxia acclimation on respiration in isolated mitochondria be reconciled with our observations of respiration in permeabilized muscle fibres and of mitochondrial abundance? Muscle fibre respiration was 40–43% higher in highlanders than in lowlanders and did not change with hypoxia acclimation (Fig. 1). Mitochondrial abundance was 26–29% higher in highlanders than in lowlanders and was also unchanged by hypoxia acclimation (Fig. 2). These observations alone imply that there should also be a modest population difference in the respiratory capacity of isolated mitochondria that is unaltered by hypoxia acclimation, but this was clearly not the case (Fig. 4). It is possible that there were differences in mitochondrial function between the tissues used for muscle fibre respiration and TEM (oxidative core of the gastrocnemius muscle) and those used for mitochondrial isolation (all hindlimb muscles). There might have also been changes in mitochondrial physiology during the isolation process, consistent with some previous studies that have noted qualitatively distinct patterns of variation between isolated mitochondria and permeabilized muscle fibres (Picard et al. 2010; Mathers & Staples, 2015). Although the reasons for this discrepancy are not entirely clear, the combined effects of all determinants of oxidative capacity nevertheless contribute to highland deer mice having a higher oxidative capacity in the gastrocnemius muscle.
Recent work suggests that hypoxia acclimation increases the proportion of carbohydrates oxidized relative to fatty acids when running at 75% of in highland but not in lowland deer mice (Lau et al. 2017). Similar differences in fuel selection during exercise have been observed between lowland and highland species of Andean leaf‐eared mice (Schippers et al. 2012). Carbohydrate oxidation produces more ATP per mole of oxygen than the oxidation of fatty acids (Brand, 2005; Welch et al. 2007), and may thus be beneficial for sustaining muscle performance in high‐altitude hypoxia. It would be instructive to examine the role of mitochondria in this switch, to determine whether mitochondrial capacities for oxidizing carbohydrates relative to fatty acids might increase in high‐altitude mice after hypoxia acclimation, and represent another way in which hypoxia acclimation might have distinct effects on mitochondrial function between populations.
Hypoxia acclimation decreased mitochondrial ROS emission in both populations of deer mice. Some evidence suggests that initial exposure to hypoxic environments increases the rate of mitochondrial ROS production, because O2 limitation at cytochrome c oxidase can render the electron transport system in a more reduced state (Hoppeler et al. 2003). On the one hand, high levels of ROS production could lead to maladaptive increases in oxidative damage to cellular components. On the other hand, increases in ROS production may play an important signalling role in hypoxic environments, and is known to stabilize hypoxia‐inducible factors (HIF) and thus promote the expression of hypoxia‐responsive genes (Chandel et al. 2000). In fact, stabilization of HIF‐1α can lead to downstream changes that feed back to reduce ROS production after prolonged hypoxia exposure (Fukuda et al. 2007; Bo et al. 2008; Zhang et al. 2008). It is possible that this contributed to the decrease in mitochondrial ROS emission that we observed here in response to hypoxia acclimation (Fig. 5). However, it is unclear whether our observations are caused by a decrease in ROS production by the electron transport system, or by an increase in ROS scavenging by antioxidant systems within the mitochondria (Kowaltowski & Vercesi, 1999; Guzy et al. 2005; Murphy, 2009; Treberg et al. 2010).
Conclusions and perspectives
High‐altitude natives have evolved exquisite physiological adaptations over millennia that enable them to function under conditions of severe hypoxia. These adaptations provide a strong indication of traits that are especially beneficial for improving performance and hypoxia resistance at high altitudes. High‐altitude adaptation appears to have increased maximal O2 consumption in hypoxia in highland deer mice (Hayes, 1989; Hayes & O'Connor, 1999; Cheviron et al. 2012; Lui et al. 2015). As skeletal muscles are a major determinant of , our results suggest that adaptive modifications in the muscle – specifically the respiratory capacity and intracellular distribution of mitochondria – are key to high‐altitude adaptation in this species. Given the strong positive selection on in high‐altitude populations in the wild (Hayes & O'Connor, 1999), the observed changes in muscle phenotype in high‐altitude populations probably contribute to improving survival and reproductive fitness. The mechanisms underlying high‐altitude adaptation were largely distinct from the effects of hypoxia acclimation observed here and in many previous studies of high‐altitude acclimatization (Murray & Horscroft, 2016), although there were some population differences in the acclimation response. This is one of the first studies to describe adaptations in mitochondrial physiology in non‐human mammals native to high altitude, and suggests that natural selection can employ unique solutions to overcome the hypoxic conditions at high altitudes that are beyond those attained by lowlanders after extensive acclimatization.
Here, we used F1 generation mice that were born and raised in normoxia to examine population differences in adults that were acclimated to normoxia or hypoxia, but other life stages and other challenges of high‐altitude environments are worth future consideration. Pre‐natal exposure to hypoxia has been shown to affect various aspects of physiology (Hutter et al. 2010), including mitochondrial function (Galli et al. 2016), and it would be valuable to investigate how developmental hypoxia impacts mitochondrial physiology in deer mice, and whether the effects of developmental hypoxia differ between high‐ and low‐altitude populations. Furthermore, cold is another key stressor at high altitudes, one that is a significant challenge for small endotherms such as deer mice, and that could lead to distinct mechanisms of high‐altitude adaptation between small and large animals (e.g. mice versus humans). Cold acclimation is often observed to increase capillarity and aerobic capacity of muscles from lowland mammals (Jackson et al. 1987; Herpin & Lefaucheur, 1992; Mineo et al. 2012; Sillau et al. 1980; Wickler, 1980), but little is known about this process in high‐altitude natives. It will be instructive to examine how cold‐induced plasticity (during early development and adulthood) affects mitochondrial physiology in high‐ and low‐altitude populations, alone or in combination with hypoxia, to tease apart the influence of these stressors on muscle aerobic capacity at high altitudes.
Additional information
Competing interests
None declared.
Author contributions
S.M., G.B.M. and G.R.S. were all involved in the conception and design of experiments. S.M. performed the experiments, analysed the data, and drafted the manuscript. G.B.M. and G.R.S. supervised S.M., interpreted the data, and revised the manuscript. All authors approved the final version of manuscript, and agree to be accountable for accuracy and integrity of all the work. All authors qualify for authorship, and all those who qualify for authorship are listed.
Funding
The equipment and operational costs of this research was supported by funds from McMaster University, the Canadian Foundation for Innovation, the Ontario Ministry of Research and Innovation, and Natural Sciences and Engineering Research Council of Canada (NSERC) Discovery Grants to G.R.S. and G.B.M. S.M. was supported by Ontario Graduate Scholarships. G.R.S. is supported by the Canada Research Chairs Program.
Acknowledgements
The authors would like to thank Alex Connaty for technical assistance.
References
- Alway SE (1991). Is fiber mitochondrial volume density a good indicator of muscle fatigability to isometric exercise? J Appl Physiol (1985) 70, 2111–2119. [DOI] [PubMed] [Google Scholar]
- Barrie E, Heath D, Stella JA & Harris P (1975). Enzyme activities in red and white muscles of guinea‐pigs and rabbits indigenous to high altitudes. Environ Physiol Biochem 5, 18–26. [PubMed] [Google Scholar]
- Beaudry JL & McClelland GB (2010). Thermogenesis in CD‐1 mice after combined chronic hypoxia and cold acclimation. Comp Biochem Physiol B Biochem Mol Biol 157, 301–309. [DOI] [PubMed] [Google Scholar]
- Bo H, Wang YH, Li HY, Zhao J, Zhang HY & Tong CQ (2008). Endurance training attenuates the bioenergetics alterations of rat skeletal muscle mitochondria submitted to acute hypoxia: role of ROS and UCP3. Sheng Li Xue Bao 60, 767–776. [PubMed] [Google Scholar]
- Boyle KL, Dillaman RM & Kinsey ST (2003). Mitochondrial distribution and glycogen dynamics suggest diffusion constraints in muscle fibers of the blue crab, Callinectes sapidus . J Exp Zool A Comp Exp Biol 297, 1–16. [DOI] [PubMed] [Google Scholar]
- Brand MD (2005). The efficiency and plasticity of mitochondrial energy transduction. Biochem Soc Trans 33, 897–904. [DOI] [PubMed] [Google Scholar]
- Buskirk ER, Kollias J, Akers R F, Prokop EK & Reategui EP (1967). Maximal performance at altitude and on return from altitude in conditioned runners. J Appl Physiol 23, 259–266. [DOI] [PubMed] [Google Scholar]
- Chandel NS, McClintock DS, Feliciano CE, Wood TM, Melendez JA, Rodriguez AM & Schumacker PT (2000). Reactive oxygen species generated at mitochondrial complex III stabilize hypoxia‐inducible factor‐1α during hypoxia: a mechanism of O2 sensing. J Biol Chem 275, 25130–25138. [DOI] [PubMed] [Google Scholar]
- Cheviron AZ, Bachman GC, Connaty AD, McClelland GB & Storz JF (2012). Regulatory changes contribute to the adaptive enchancement of thermogenic capacity in high‐altitude deer mice. Proc Natl Acad Sci USA 109, 8635–8640. [DOI] [PMC free article] [PubMed] [Google Scholar]
- D'Hulst G & Deldicque L (2017). Human skeletal muscle wasting in hypoxia: a matter of hypoxic dose? J Appl Physiol (1985) 122, 406–408. [DOI] [PubMed] [Google Scholar]
- Desplanches D, Kayar SR, Sempore B, Flandrois R & Hoppeler H (1990). Rat soleus muscle ultrastructure after hindlimb suspension. J Appl Physiol (1985) 69, 504–508. [DOI] [PubMed] [Google Scholar]
- Egginton S (1990). Numerical and areal density estimates of fibre type composition in a skeletal muscle (rat extensor digitorum longus). J Anat 168, 73–80. [PMC free article] [PubMed] [Google Scholar]
- Fukuda R, Zhang H, Kim JW, Shimoda L, Dang CV & Semenza GL (2007). HIF‐1 regulates cytochrome oxidase subunits to optimize efficiency of respiration in hypoxic cells. Cell 129, 111–122. [DOI] [PubMed] [Google Scholar]
- Galli GL, Crossley J, Elsey RM, Dzialowski EM, Shiels HA & Crossley DA (2016). Developmental plasticity of mitochondrial function in American alligators, Alligator mississippiensis . Am J Physiol Regul Integr Comp Physiol 311, R1164–R1172. [DOI] [PMC free article] [PubMed] [Google Scholar]
- Gilbert‐Kawai ET, Milledge JS, Grocott MPW & Martin DS (2014). King of the mountains: Tibetan and Sherpa physiological adaptations for life at high altitude. Physiology (Bethesda) 29, 388–402. [DOI] [PubMed] [Google Scholar]
- Glancy B, Hartnell LM, Malide D, Yu ZX, Combs CA, Connelly PS, Subramaniam S & Balaban RS (2015). Mitochondrial reticulum for cellular energy distribution in muscle. Nature 523, 617–620. [DOI] [PMC free article] [PubMed] [Google Scholar]
- Gnaiger E (2001). Bioenergetics at low oxygen: dependence of respiration and phosphorylation on oxygen and adenosine diphosphate supply. Respir Physiol 128, 277–297. [DOI] [PubMed] [Google Scholar]
- Gnaiger E & Lassnig B (2010). DatLab 2: analysis of oxygen kinetics. Mitochondr Physiol Network 02.05, 1–16, http://www.bioblast.at/index.php/MiPNet02.05_DatLab2_O2Kinetics. [Google Scholar]
- Gnaiger E, Lassnig B, Kuznetsov A, Rieger G & Margreiter R (1998). Mitochondrial oxygen affinity, respiratory flux control and excess capacity of cytochrome c oxidase. J Exp Biol 201, 1129–1139. [DOI] [PubMed] [Google Scholar]
- Gnaiger E, Steinlechner‐Maran R, Méndez G, Eberl T & Margreiter R (1995). Control of mitochondrial and cellular respiration by oxygen. J Bioenerg Biomembr 27, 583–596. [DOI] [PubMed] [Google Scholar]
- Guzy RD, Hoyos B, Robin E, Chen H, Liu L, Mansfield KD, Simon MC, Hammerling U & Schumacker PT (2005). Mitochondrial complex III is required for hypoxia‐induced ROS production and cellular oxygen sensing. Cell Metab 1, 401–408. [DOI] [PubMed] [Google Scholar]
- Hardy KM, Dillaman RM, Locke BR & Kinsey ST (2009). A skeletal muscle model of extreme hypertrophic growth reveals the influence of diffusion on cellular design. Am J Physiol Regul Integr Comp Physiol 296, R1855–R1867. [DOI] [PMC free article] [PubMed] [Google Scholar]
- Hayes JP (1989). Field and maximal metabolic rates of deer mice (Peromyscus maniculatus) at low and high altitudes. Physiol Zool 62, 732–744. [Google Scholar]
- Hayes JP & O'Connor CS (1999). Natural selection on thermogenic capacity of high‐altitude deer mice. Evolution 53, 1280–1287. [DOI] [PubMed] [Google Scholar]
- Herpin P & Lefaucheur L (1992). Adaptative changes in oxidative metabolism in skeletal muscle of cold‐acclimated piglets. J Therm Biol 17, 277–285. [Google Scholar]
- Hochachka PW (1985). Exercise limitations at high altitude: the metabolic problem and search for its solution In Circulation, Tespiration, and Metabolism, ed. Gilles R, pp. 240–249. Springer‐Verlag, Berlin. [Google Scholar]
- Hochachka PW, Stanley C, Merkt J & Sumar‐Kalinowski J (1983). Metabolic meaning of elevated levels of oxidative enzymes in high altitude adapted animals: An interpretive hypothesis. Respir Physiol 52, 303–313. [DOI] [PubMed] [Google Scholar]
- Hock RJ (1964). Physiological responses of deer mice to various native altitudes In The Physiological Effects of High Altitude, ed. Weihe WH, pp. 59–72. Macmillan, New York. [Google Scholar]
- Hood DA (2001). Invited review: contractile activity‐induced mitochondrial biogenesis in skeletal muscle. J Appl Physiol (1985) 90, 1137–1157. [DOI] [PubMed] [Google Scholar]
- Hoppeler H, Kleinert E, Schlegel C, Claassen H, Howald H, Kayar SR & Cerretelli P (1990). Morphological adaptations of human skeletal muscle to chronic hypoxia. Int J Sports Med 11, S3–S9. [DOI] [PubMed] [Google Scholar]
- Hoppeler H, Vogt M, Weibel ER & Fluck M (2003). Response of skeletal muscle mitochondria to hypoxia. Exp Physiol 88, 109–119. [DOI] [PubMed] [Google Scholar]
- Hutter D, Kingdom J & Jaeggi E (2010). Causes and mechanisms of intrauterine hypoxia and its impact on the fetal cardiovascular system: a review. Int J Pediatr 2010, 401323. [DOI] [PMC free article] [PubMed] [Google Scholar]
- Ivy CM & Scott GR (2015). Control of breathing and the circulation in high‐altitude mammals and birds. Comp Biochem Physiol A Mol Integr Physiol 186, 66–74. [DOI] [PubMed] [Google Scholar]
- Jackson CGR, Sillau AH & Banchero N (1987). Fiber composition and capillarity in growing guinea pigs acclimated to cold and cold plus hypoxia. Exp Biol Med 185, 101–106. [DOI] [PubMed] [Google Scholar]
- Jacobs RA, Lundby AM, Fenk S, Gehrig S, Siebenmann C, Flück D, Kirk N, Hilty MP & Lundby C (2016). Twenty‐eight days of exposure to 3454 m increases mitochondrial volume density in human skeletal muscle. J Physiol 594, 1151–1166. [DOI] [PMC free article] [PubMed] [Google Scholar]
- Jacobs RA, Siebenmann C, Hug M, Toigo M, Meinild A‐K & Lundby C (2012). Twenty‐eight days at 3454‐m altitude diminishes respiratory capacity but enhances efficiency in human skeletal muscle mitochondria. FASEB J 26, 5192–5200. [DOI] [PubMed] [Google Scholar]
- Kayser B, Hoppler H, Claassen H & Cerretelli P (1991). Muscle structure and performance capacity of Himalayan Sherpas. J Appl Physiol (1985) 70, 1938–1942. [DOI] [PubMed] [Google Scholar]
- Kayser B, Hoppeler H, Desplanches D, Marconi C, Broers B & Cerretelli P (1996). Muscle ultrastructure and biochemistry of lowland Tibetans. J Appl Physiol (1985) 81, 419–425. [DOI] [PubMed] [Google Scholar]
- Kinsey ST, Locke BR & Dillaman RM (2011). Molecules in motion: influences of diffusion on metabolic structure and function in skeletal muscle. J Exp Biol 214, 263–274. [DOI] [PMC free article] [PubMed] [Google Scholar]
- Kirby DM, Thorburn DR, Turnbull DM & Taylor RW (2007). Biochemical assays of respiratory chain complex activity. Mitochondria 80, 93–119. [DOI] [PubMed] [Google Scholar]
- Kowaltowski AJ & Vercesi AE (1999). Mitochondrial damage induced by conditions of oxidative stress. Free Radic Biol Med 26, 463–471. [DOI] [PubMed] [Google Scholar]
- Lau DS, Connaty AD, Mahalingam S, Wall N, Cheviron ZA, Storz JF, Scott GR & McClelland GB (2017). Acclimation to hypoxia increases carbohydrate use during exercise in high‐altitude deer mice. Am J Physiol Regul Integr Comp Physiol 312, R400–R411. [DOI] [PMC free article] [PubMed] [Google Scholar]
- León‐Velarde F, Sanchez J, Bigard AX, Brunet A, Lesty C & Monge C (1993). High altitude tissue adaptation in Andean coots: capillarity, fiber area, fiber type and enzymatic activities of skeletal muscle. J Comp Physiol B 163, 52–58. [DOI] [PubMed] [Google Scholar]
- Levett D, Radford EJ, Menassa DA, Graber EF, Morash AJ, Hoppeler H, Clarke K, Martin DS, Ferguson‐Smith AC, Montgomery HE, Grocott MPW, Murray AJ & the Caudwell Xtreme Everest Research Group (2012). Acclimatization of skeletal muscle mitochondria to high‐altitude hypoxia during an ascent of Everest. FASEB J 26, 1431–1441. [DOI] [PubMed] [Google Scholar]
- Lira VA, Benton CR, Yan Z & Bonen A (2010). PGC‐1α regulation by exercise training and its influences on muscle function and insulin sensitivity. Am J Physiol Endocrinol Metab 299, E145–E161. [DOI] [PMC free article] [PubMed] [Google Scholar]
- Lui MA, Mahalingam S, Patel P, Connaty AD, Ivy CM, Cheviron ZA, Storz JF, McClelland GB & Scott GR (2015). High‐altitude ancestry and hypoxia acclimation have distinct effects on exercise capacity and muscle phenotype in deer mice. Am J Physiol Regul Integr Comp Physiol 308, R779–R791. [DOI] [PMC free article] [PubMed] [Google Scholar]
- McClelland GB, Hochachka PW & Weber JM (1998). Carbohydrate utilization during exercise after high‐altitude acclimation: a new perspective. Proc Natl Acad Sci USA 95, 10288–10293. [DOI] [PMC free article] [PubMed] [Google Scholar]
- Mathers KE & Staples JF (2015). Saponin‐permeabilization is not a viable alternative to isolated mitochondria for assessing oxidative metabolism in hibernation. Biol Open 15, 858–864. [DOI] [PMC free article] [PubMed] [Google Scholar]
- Mathieu O, Krauer R, Hoppeler H, Gehr P, Lindstedt SL, Alexander RM, Taylor CR & Weibel ER (1981). Design of the mammalian respiratory system. VII. Scaling mitochondrial volume in skeletal muscle to body mass. Respir Physiol 44, 113–128. [DOI] [PubMed] [Google Scholar]
- Mathieu‐Costello O (2001). Muscle adaptation to altitude: tissue capillarity and capacity for aerobic metabolism. High Alt Med Biol 2, 413–425. [DOI] [PubMed] [Google Scholar]
- Mathieu‐Costello O & Agey PJ (1997). Chronic hypoxia affects capillary density and geometry in pigeon pectoralis muscle. Respir Physiol 109, 39–52. [DOI] [PubMed] [Google Scholar]
- Mineo PM, Cassell EA, Roberts ME & Schaeffer PJ (2012). Chronic cold acclimation increases thermogenic capacity, non‐shivering thermogenesis and muscle citrate synthase activity in both wild‐type and brown adipose tissue deficient mice. Comp Biochem Physiol A Mol Integr Physiol 161, 395–400. [DOI] [PMC free article] [PubMed] [Google Scholar]
- Murphy MP (2009). How mitochondria produce reactive oxygen species. Biochem J 417, 1–13. [DOI] [PMC free article] [PubMed] [Google Scholar]
- Murray AJ & Horscroft JA (2016). Mitochondrial function at extreme high altitude. J Physiol 594, 1137–1149. [DOI] [PMC free article] [PubMed] [Google Scholar]
- Natarajan C, Hoffmann FG, Lanier HC, Wolf CJ, Cheviron ZA, Spangler ML, Weber RE, Fago A & Storz JF (2015). Intraspecific polymorphism, interspecific divergence, and the origins of function‐altering mutations in deer mouse hemoglobin. Mol Biol Evol 32, 978–997. [DOI] [PMC free article] [PubMed] [Google Scholar]
- Pathi B, Kinsey ST, Howdeshell ME, Priester C, McNeill RS & Locke BR (2012). The formation and functional consequences of heterogeneous mitochondrial distributions in skeletal muscle. J Exp Biol 215, 1871–1883. [DOI] [PMC free article] [PubMed] [Google Scholar]
- Pathi B, Kinsey ST & Locke BR (2011). Influence of reaction and diffusion on spatial organization of mitochondria and effectiveness factors in skeletal muscle cell design. Biotechnol Bioeng 108, 1912–1924. [DOI] [PubMed] [Google Scholar]
- Pathi B, Kinsey ST & Locke BR (2013). Oxygen control of intracellular distribution of mitochondria in muscle fibers. Biotechnol Bioeng 110, 2513–2524. [DOI] [PMC free article] [PubMed] [Google Scholar]
- Picard M, Ritchie D, Wright KJ, Romestaing C, Thomas MM, Rowan SL, Taivassalo T & Hepple RT (2010). Mitochondrial functional impairment with aging is exaggerated in isolated mitochondria compared to permeabilized myofibers. Aging Cell 9, 1032–1046. [DOI] [PubMed] [Google Scholar]
- Schippers MP, Ramirez O, Arana M, Pinedo‐Bernal P & McClelland GB (2012). Increase in carbohydrate utilization in high‐altitude Andean mice. Curr Biol 22, 2350–2354. [DOI] [PubMed] [Google Scholar]
- Scott GR, Egginton S, Richards JG & Milsom WK (2009a). Evolution of muscle phenotype for extreme high altitude flight in the bar‐headed goose. Proc R Soc B 276, 3645–3653. [DOI] [PMC free article] [PubMed] [Google Scholar]
- Scott GR, Elogio TS, Lui MA, Storz JF & Cheviron ZA (2015a). Adaptive modifications of muscle phenotype in high‐altitude deer mice are associated with evolved changes in gene regulation. Mol Biol Evol 32, 1962–1976. [DOI] [PMC free article] [PubMed] [Google Scholar]
- Scott GR, Hawkes LA, Frappell PB, Butler PJ, Bishop CM & Milsom WK (2015b). How bar‐headed geese fly over the Himalayas. Physiology (Bethesda) 30, 107–115. [DOI] [PMC free article] [PubMed] [Google Scholar]
- Scott GR, Richards JG & Milsom WK (2009b). Control of respiration in flight muscle from the high‐altitude bar‐headed goose and low‐altitude birds. Am J Physiol Regul Integr Comp Physiol 297, R1066–R1074. [DOI] [PubMed] [Google Scholar]
- Sillau AH, Aquin L, Lechner AJ, Bui MV & Banchero N (1980). Increased capillary supply in skeletal muscle of guinea pigs acclimated to cold. Respir Physiol 42, 233–245. [DOI] [PubMed] [Google Scholar]
- Snyder LRG, Born S & Lechner AJ (1982). Blood oxygen affinity in high‐ and low‐altitude populations of the deer mouse. Respir Physiol 48, 89–105. [DOI] [PubMed] [Google Scholar]
- Spinazzi M, Casarin A, Pertegato V, Salviati L & Angelini C (2012). Assessment of mitochondrial respiratory chain enzymatic activities on tissues and cultured cells. Nat Protoc 7, 1235–1246. [DOI] [PubMed] [Google Scholar]
- Spurr AR (1969). A low‐viscosity epoxy resin embedding medium for electron microscopy. J Ultrastruct Res 26, 31–43. [DOI] [PubMed] [Google Scholar]
- Storz JF, Scott GR & Cheviron ZA (2010). Phenotypic plasticity and genetic adaptation to high‐altitude hypoxia in vertebrates. J Exp Biol 213, 4125–4135. [DOI] [PMC free article] [PubMed] [Google Scholar]
- Suarez RK, Lighton JR, Brown GS & Mathieu‐Costello O (1991). Mitochondrial respiration in hummingbird flight muscles. Proc Natl Acad Sci USA 88, 4870–4873. [DOI] [PMC free article] [PubMed] [Google Scholar]
- Treberg JR, Quinlan CL & Brand MD (2010). Hydrogen peroxide efflux from muscle mitochondria underestimates matrix superoxide production – a correction using glutathione depletion. FEBS J 277, 2766–2778. [DOI] [PMC free article] [PubMed] [Google Scholar]
- Ventura‐Clapier R, Kuznetsov A, Veksler V, Boehm E & Anflous K (1998). Functional coupling of creatine kinases in muscles: species and tissue specificity. Mol Cell Biochem 184, 231–247. [PubMed] [Google Scholar]
- Weibel ER (1979). Stereological Methods. Academic Press, Toronto. [Google Scholar]
- Weibel ER, Bacigalupe LD, Schmitt B & Hoppeler H (2004). Allometric scaling of maximal metabolic rate in mammals: muscle aerobic capacity as determinant factor. Respir Physiol Neurobiol 140, 115–132. [DOI] [PubMed] [Google Scholar]
- Welch KC, Altshuler DL & Suarez RK (2007). Oxygen consumption rates in hovering hummingbirds reflect substrate‐dependent differences in P/O ratios: carbohydrate as a premium fuel. J Exp Biol 210, 2146–2153. [DOI] [PubMed] [Google Scholar]
- West JB, Boyer SJ, Graber DJ, Hackett PH, Maret KH, Milledge JS, Peters RM, Pizzo CJ, Samaja M & Sarnquist FH (1983). Maximal exercise at extreme altitudes on Mount Everest. J Appl Physiol (1985) 55, 688–698. [DOI] [PubMed] [Google Scholar]
- Wickler SJ (1980). Maximal thermogenic capacity and body temperatures of white‐footed mice (Peromyscus) in summer and winter. Physiol Zool 53, 338–346. [Google Scholar]
- Zhang H, Bosch‐Marce M, Shimoda LA, Tan YS, Baek JH, Wesley JB, Gonzalez FJ & Semenza GL (2008). Mitochondrial autophagy is an HIF‐1‐dependent adaptive metabolic response to hypoxia. J Biol Chem 283, 10892–10903. [DOI] [PMC free article] [PubMed] [Google Scholar] [Retracted]