

Abstract
The double‐membrane‐bound autophagosome is formed by the closure of a structure called the phagophore, origin of which is still unclear. The endoplasmic reticulum (ER) is clearly implicated in autophagosome biogenesis due to the presence of the omegasome subdomain positive for DFCP1, a phosphatidyl‐inositol‐3‐phosphate (PI3P) binding protein. Contribution of other membrane sources, like the plasma membrane (PM), is still difficult to integrate in a global picture. Here we show that ER–plasma membrane contact sites are mobilized for autophagosome biogenesis, by direct implication of the tethering extended synaptotagmins (E‐Syts) proteins. Imaging data revealed that early autophagic markers are recruited to E‐Syt‐containing domains during autophagy and that inhibition of E‐Syts expression leads to a reduction in autophagosome biogenesis. Furthermore, we demonstrate that E‐Syts are essential for autophagy‐associated PI3P synthesis at the cortical ER membrane via the recruitment of VMP1, the stabilizing ER partner of the PI3KC3 complex. These results highlight the contribution of ER–plasma membrane tethers to autophagosome biogenesis regulation and support the importance of membrane contact sites in autophagy.
Keywords: autophagosome, contact sites, extended synaptotagmins, organelle biogenesis, PI3P
Subject Categories: Autophagy & Cell Death, Membrane & Intracellular Transport
Introduction
Macro‐autophagy (hereafter referred to as autophagy) is a highly regulated intracellular degradation pathway necessary for cellular homeostasis (Boya et al, 2013). Autophagy is initiated by the formation of a specific double‐membrane organelle called the autophagosome. The biogenesis of autophagosome is orchestrated by multiple signalling pathways and complexes that regulate membrane dynamics that contain autophagy‐related (ATG) proteins. Autophagy initiates with biogenesis of a pre‐autophagosomal double‐membrane structure, termed the phagophore, which emanates from the omegasome, a subdomain of the endoplasmic reticulum (ER) membrane positive for PI3P (phosphatidyl‐inositol‐3‐phosphate) and PI3P‐binding proteins (Axe et al, 2008). The PI3P pool engaged in autophagosome biogenesis is synthesized by the class 3 PI3kinase complex (PI3KC3), comprised of VPS34, VPS15, ATG14L, Beclin1, and regulating adaptors, such as VMP1, NRBF2 and Ambra1, and is dependent on ULK1 complex signalling (Nascimbeni et al, 2017). The phagophore then elongates and is close to form a mature autophagosome that will latter fuse with the lysosome.
Although the ER membrane requirement is well established, other membrane sources, like the Golgi apparatus, endosomes, the mitochondria and the plasma membrane (PM), have been proposed to participate, directly, indirectly or partially, in autophagosome biogenesis (Molino et al, 2017), from phagophore generation to growth of the organelle (Ravikumar et al, 2010a,b; Rubinsztein et al, 2012). The ER is a dynamic and complex membranous network that extends throughout the cell impacting a multiplicity of cellular functions (Friedman & Voeltz, 2011). There is growing evidence that close appositions between the ER and the membranes of virtually all other organelles play major roles in cell physiology (Helle et al, 2013). Notably, ER–mitochondria contact sites actively participate in autophagosome biogenesis via the regulation of PI3KC3 complex (Hamasaki et al, 2013).
ER‐PM contact sites are important for lipid metabolism and transport, notably of phosphoinositides, and these domains have the potential to affect membrane trafficking and signalling events that occur at the PM (Stefan et al, 2013). In higher eukaryotes, three ER‐localized proteins, the extended synaptotagmins (E‐Syts 1, 2 and 3), play crucial roles in tethering the ER to the PM and are thus considered as key regulators, as well as precise markers, of ER‐PM tethering zones (Giordano et al, 2013). Because both ER and PM have been directly associated with autophagy regulation and because ER tethering could be important for membrane remodelling, we hypothesized that the ER cooperates with plasma membrane during the very first steps of the autophagosome biogenesis via the establishment of ER‐PM specialized contact sites. Indeed, we show here that stress situations that induce autophagy lead as well to ER‐PM contact site mobilization, highlighting a connection between ER‐PM tethering and the autophagy machinery. We observed local recruitment of autophagic and pre‐autophagic markers at E‐Syts domains of the cortical ER during autophagy initiation. Further, autophagy was enhanced in E‐Syt‐overexpressing cells, whereas inhibition of E‐Syts expression reduced autophagosome biogenesis. Finally, we demonstrated that ER‐PM contact sites are required for local PI3P synthesis by the PIK3C3 complex. We found that the PIK3C3 complex at ER‐PM contact sites is mobilized at the ER membrane via the binding of VMP1 (Molejon et al, 2013a), the ER partner of Beclin1, the major regulator of autophagy‐associated PI3P synthesis.
Results
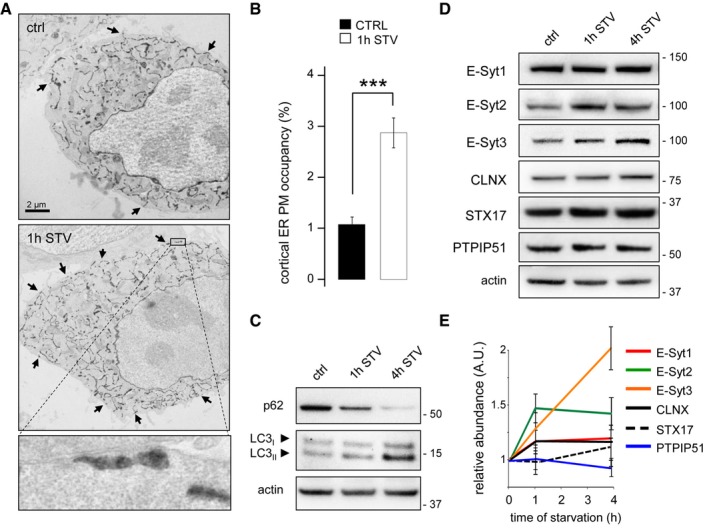
We first studied the behaviour of ER‐PM contact sites in conditions that promote autophagy using a HRP‐myc‐KDEL reporter that allows indirect visualization of ER lumen by electron microscopy (EM; Giordano et al, 2013). We analysed and quantified ER‐PM contact zones in control and in HeLa cells starved to induce autophagy. We observed a massive increase in the number of ER‐PM contact sites compared to control situation (Fig 1A and B), and this increase correlated with autophagy induction (Fig 1C). Levels of E‐Syt2 and 3 proteins increased after 1 and 4 h of starvation, whereas levels of calnexin (an ER marker), syntaxin 17 [STX17, previously identified as a marker of an autophagy‐related ER–mitochondria contact sites (Hamasaki et al, 2013)] or PTPIP51 [an ER–mitochondria tethering protein recently shown to participate in autophagy regulation (Gomez‐Suaga et al, 2017)] were not affected (Fig 1D and E). The increase in E‐Syt2 was also induced by mechanical stress in KEC cells (Fig EV1A), a condition that promotes autophagy (Orhon et al, 2016), and by serum starvation or mTOR chemical inhibition (Fig EV1B).
Figure 1. Starvation increases ER‐PM contact sites density.
-
AElectron micrographs of HeLa cells grown under complete medium conditions (control, ctrl) or starved for 1 h (1 h STV). HeLa cells were transfected with the ER luminal marker ssHRP‐myc‐KDEL (which enables ER identification via an electron‐dense (dark) HRP reaction) to allow detection of ER‐PM contact sites (black arrows). Scale bar, 2 μm. Representative images from one of three independent experiments are shown.
-
BQuantification of ER‐PM contact sites visualized in electron micrographs with 20 cells analysed per condition in each of three experiments. Means ± s.e.m. are plotted. ***P < 0.001, unpaired two‐tailed t‐test.
-
C–EHeLa cells were grown under control and starvation conditions for 1 and 4 h. Representative Western blots of lysates for (C) p62 and lipidated LC3 and (D) E‐Syts, calnexin (CLNX), STX17, and PTPIP51 are shown. Actin was used as a loading control. (E) Quantification of Western blots from three independent experiments. Means ± s.e.m. are plotted.
Figure EV1. Multiple autophagy stimuli induce E‐Syt2 expression.

- Mechanical stress: Western blots and protein quantifications of protein lysates from KEC cells under basal (ctrl) and mechanical stress (flow) conditions for 4–72 h (n = 3). Plotted are mean ± s.d.
- mTOR inhibition and serum starvation: Western blots and protein quantifications (compared to ctrl) of protein lysates from HeLa cells grown under basal (ctrl) and autophagy‐inducing conditions. Cells were cultured with 1.5 μM Torin1, an mTOR inhibitor, for 2 h or in a medium without serum for 1 h, respectively (n = 3). Plotted are mean ± s.d.
Since our data suggested that autophagy and formation of ER‐PM contact sites are stimulated in the same time frame, we next investigated whether autophagosomal markers could be detected at the cortical ER, near the PM. Indeed, in HeLa cells, we detected the phagophore, autophagosome and autolysosome marker LC3 near the cell boundary as early as 15 min post‐starvation, a time at which most of LC3 was associated with the ER marker Sec61β (Fig 2A). The presence of LC3 in the vicinity of the plasma membrane was further confirmed by total internal reflection fluorescence (TIRF) microscopy (Fig 2B). The number of LC3 puncta in the TIRF zone increased with time under starvation conditions (Fig 2B and C), showing that LC3 autophagic structures appear at the immediate vicinity of the PM during starvation‐induced autophagy. A similar LC3 pattern was observed in MDCK cells under mechanical stress (Orhon et al, 2016; Fig 2D). These results indicated that in different cell types treated with different autophagy inducers, LC3 staining was detected very close to the PM, suggesting that these autophagic structures might be associated with ER‐PM contact sites.
Figure 2. Early autophagic structures are detected in the vicinity of the plasma membrane.

- HeLa cells were transfected with RFP‐Sec61β (an ER marker) and immunostained for the autophagosome marker LC3. The two markers co‐distribute in the vicinity of the plasma membrane (empty arrowheads) after 15 min of starvation (STV 15 min) as shown by confocal microscopy.
- TIRF analysis after 0 (control), 15 (STV 15 min) and 60 (STV 60 min) min of starvation.
- Quantification of LC3 puncta per TIRF section (n = 3; 20 cells analysed per condition). **P < 0.01, ***P < 0.001, unpaired two‐tailed t‐test. Means ± s.e.m. are plotted.
- Representative confocal microscopy images and 3D reconstructions of MDCK cells immunostained for LC3, Na/K‐ATPase and DAPI under mechanical stress conditions. Arrowheads indicate LC3 puncta at vicinity of plasma membrane.
To analyse further whether ER‐PM contact zones are sites of autophagosome formation, we used tagged E‐Syt2 and E‐Syt3 proteins as markers of ER‐PM contact sites: while E‐Syt1 can be detected on perinuclear as well as cortical ER structures, E‐Syt2 and E‐Syt3 localizations are restricted only to cortical ER engaged in ER‐PM contact sites (Appendix Fig S1A and Fernández‐Busnadiego et al (2015); Giordano et al (2013)). In HeLa cells starved for 15 min, we observed co‐distribution of LC3 with the ER markers Sec61βRFP and E‐Syt2GFP by confocal microscopy (Fig EV2A and C) at the basal level of the cells and by super‐resolution two‐colour stimulated emission depletion (STED) microscopy (Fig 3A). 3D reconstructions showed that LC3 was often directly connected to the ER membrane via E‐Syt2‐positive ER domains (Fig 3B) and sometimes appeared within a membranous niche positive for Sec61βRFP and E‐Syt2GFP (Fig EV2A). Similar results were obtained when we used an antibody to ATG16L1 (Fig EV2B and C), a regulator of autophagosome biogenesis known to participate in the early events of LC3 recruitment to omegasome/phagophore structures (Wilson et al, 2014). The LC3‐positive structures that were in the vicinity of the PM were negative for Rubicon (Appendix Fig S2), excluding the possibility of a non‐autophagy‐related LC3‐associated phagocytosis (Levine et al, 2015). Using immunogold EM, we clearly observed E‐Syt2myc and LC3GFP co‐distribution on ER‐PM contact sites in HeLa cells starved for 60 min (Fig EV2D); these are likely the same autophagic structures that we observed directly by electron microscopy in the immediate vicinity of cortical ER and PM in the same conditions (Fig 3C).
Figure EV2. LC3 and ATG16L1 reside at ER‐PM contact sites under starvation conditions.

-
A, BConfocal microscope images and 3D reconstructions of HeLa cells co‐transfected with GFP‐E‐Syt2 and RFP‐Sec61β and immunostained for LC3 or ATG16L1 and DAPI. Arrowheads denote LC3 or ATG16L1 puncta near the E‐Syt2‐positive niche of the ER. Scale bars, 5 and 2.5 μm (magnified areas).
-
CQuantification of LC3 and ATG16L1 co‐distribution with E‐Syt2 at basal plan of the cell n = 80 cells. Mean ± s.e.m. shown.
-
DImmunogold electron micrographs of starved HeLa cells, showing co‐distribution of the myc‐E‐Syt2 and anti‐LC3 antibody at ER (empty arrowheads) and PM (black arrowheads) juxtaposition sites. Scale bar, 250 nm.
Figure 3. Autophagosomes can form at ER‐PM contact sites.

- STED images of the basal plane of a HeLa cell co‐transfected with vectors for expression of the ER marker Sec61βGFP and the ER‐PM contact marker mCherry‐E‐Syt3 and immunostained for the autophagosome marker LC3. Scale bars, 5 μm. Arrowheads indicate autophagic structures (LC3) arising from ER niches (Sec61β‐positive) at ER‐PM contact sites (E‐Syt3‐positive).
- Three‐dimensional reconstruction from confocal microscope images of HeLa cells co‐transfected with vectors for expression of Sec61βRFP and E‐Syt2GFP and immunostained for LC3. Scale bar, 2.5 μm. The arrowheads indicate the LC3‐positive structures.
- Electron micrographs of HeLa cells starved 1 h and transfected with a vector for expression of the ER luminal marker ssHRP‐myc‐KDEL, showing early autophagic structures in the proximity of the PM. Scale bar, 400 nm.
We next analysed distribution of the omegasome‐marker (Axe et al, 2008) DCFP1GFP in HeLa cells after a short time of starvation, to maximize detection of autophagosome biogenesis‐related events. We clearly observed co‐distribution of DFCP1 with membranes positive for E‐Syts, LC3 and Sec61βRFP by confocal microscopy (Fig 4A and B) and by time‐lapse microscopy (Fig 4C). These results strongly suggest that at least some autophagosome biogenesis occurs at ER‐PM contact sites. We then quantified the E‐Syt2‐positive omegasome structures and the omegasome structures at ER‐mitochondria contact sites identified by mitochondrial protein TOM20 (Hamasaki et al, 2013). Our results indicate that, within 15 min of autophagy induction, approximately 30% of DFCP1‐positive structures were associated with E‐Syt2‐positive domains (Fig EV3A and C), a ratio very close to the one we observed for DFCP1‐positive ER–mitochondria contact sites (Fig EV3B and C). These results were further confirmed by electron microscopy analyses (Fig EV3D). Together, these data demonstrate that autophagosome assembly at ER‐PM contact sites domains accounts for approximately 30% of total autophagosomes observed after a 15‐min starvation of HeLa cells.
Figure 4. LC3 and DFCP1 are present at ER‐PM contact sites under starvation conditions.
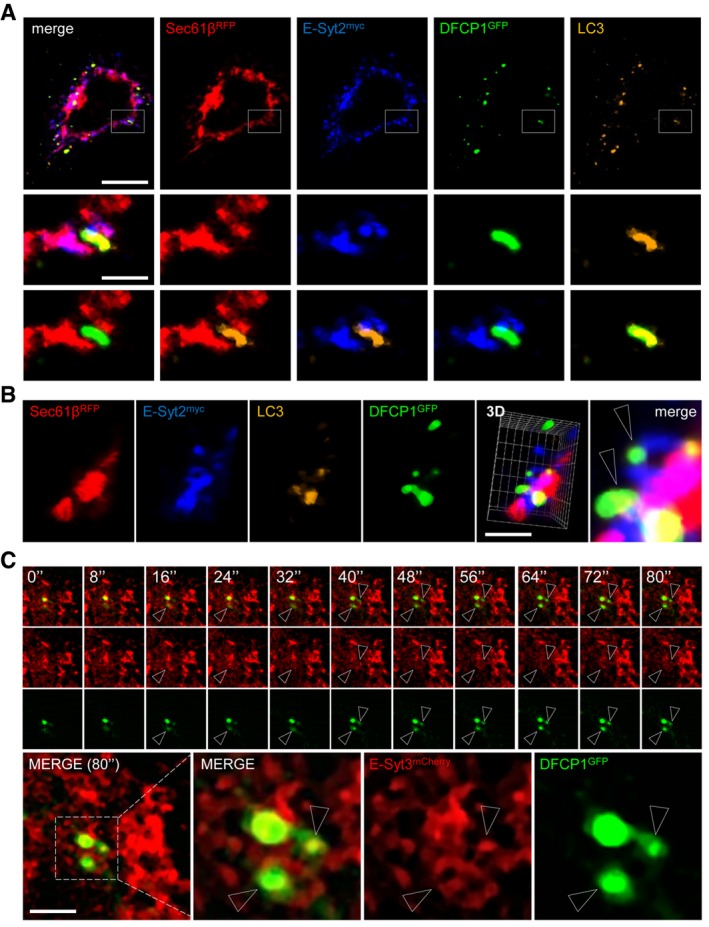
- Representative confocal microscopy images taken in the basal plane of a HeLa cell expressing myc‐E‐Syt2, RFP‐Sec61β and GFP‐DFCP1 and immunostained for LC3. Scale bars, 10 and 3 μm (magnified areas).
- 3D reconstructions of representative HeLa cell expressing myc‐E‐Syt2, RFP‐Sec61β and GFP‐DFCP1 and immunostained for LC3. Arrowheads denote DFCP1 and LC3 puncta connected with E‐Syt2‐positive niches of the ER. Scale bar, 5 μm.
- Time‐lapse confocal images of HeLa cells expressing mCherry‐E‐Syt3 and GFP‐DFCP1 after cells were starved for 15 min. Two channels were observed simultaneously using two cameras. Arrowheads denote DFCP1 puncta in E‐Syt2‐positive niches of the ER. Scale bar, 5 μm.
Figure EV3. Early autophagic structures form at ER‐PM and ER–mitochondria contact sites.

-
A, BConfocal microscope images of HeLa cells co‐transfected with GFP‐DFCP1 (an omegasome marker), RFP‐Sec61β (an ER marker) and myc‐E‐Syt2 (an ER‐PM contact sites marker) or immunostained for TOM20 (a mitochondria marker) under starved conditions (15 min). Arrowheads denote omegasome formation at (A) ER‐PM or (B) ER–mitochondria contact sites. Scale bars, 10 μm.
-
CQuantification of percent DFCP1‐positive structures at ER‐PM (Sec61β/E‐Syt2 interface) and ER–mitochondria (Sec61β/TOM20 interface) contact sites. Plotted are mean ± s.e.m., n = 80.
-
DElectron microscopy images of HeLa cells transfected with the ER luminal marker ssHRP‐myc‐KDEL and starved for 1 h showing autophagic structures adjacent (within 1 μm) to ER‐PM contact sites (ER‐PM), ER‐mitochondria contact sites (ER‐mito) and to neither organelle (cytoplasm). The quantification of these autophagic structures is shown as well. Plotted are means ± s.e.m., n = 80 cells.
As previously reported (Giordano et al, 2013), overexpression of E‐Syt2 or E‐Syt3 stabilized and increased the density of ER‐PM contact sites (Appendix Fig S2). In cells overexpressing E‐Syts, the lipidation of LC3 was increased and more LC3‐positive structures were observed both in fed and starved conditions compared to mock‐transfected cells (Fig 5A and B). Interestingly, LC3 puncta were significantly increased in the vicinity of the PM in E‐Syt3‐overexpressing cells (Fig 5C). Electron microscopy analyses showed twice as many autophagic structures in HeLa cells overexpressing E‐Syt2 as in control cells (Fig EV4A). In functional tests monitoring long‐lived protein degradation, which depends on autophagy, we observed a significant increase of protein degradation in E‐Syt2‐ and E‐Syt3‐overexpressing cells, as compared to control cells (Fig EV4B). Thus, the observed autophagic structures originating from the ER‐PM contact zones appear to be functional.
Figure 5. Overexpression of E‐Syt2 and E‐Syt3 induces autophagosome formation.
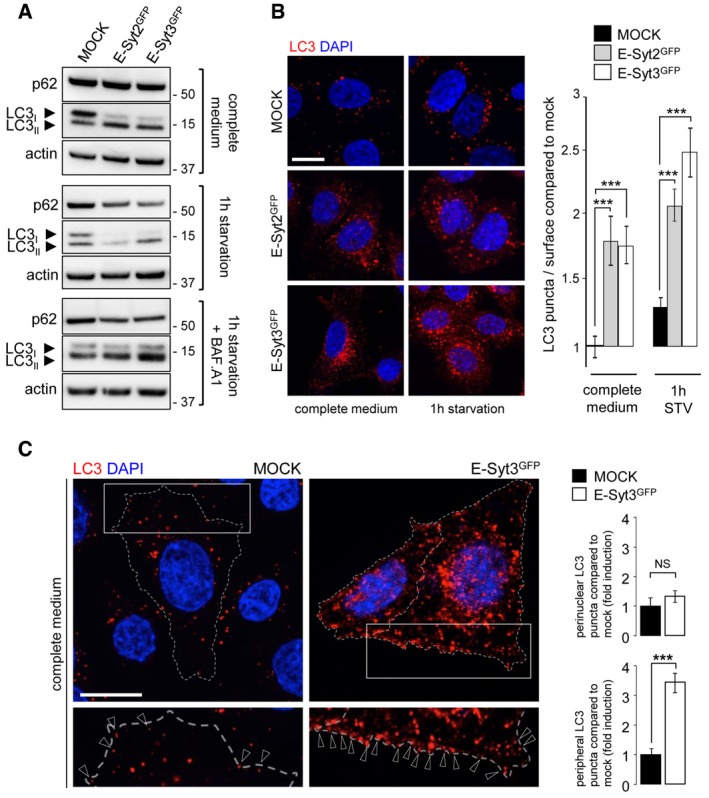
- Western blot analysis of the autophagic flux in cell lysates from control (mock) and GFP‐E‐Syt2 or GFP‐E‐Syt3‐expressing HeLa cells, under complete medium and starvation (1 h EBSS) conditions, without or with Bafilomycin A1 (+BAF. A1).
- HeLa cells expressing GFP‐E‐Syt2 or GFP‐E‐Syt3 were immunostained for LC3. Compared to control (mock), transfected cells showed a dramatic increase in LC3 puncta, in both basal (complete medium) and starved (1 h) conditions, as evidenced by counting of LC3 puncta (n = 3; 20 cells per condition).
- The increase in LC3 puncta observed in cells overexpressing E‐Syt3GFP (similar results were obtained with E‐Syt2GFP, data not shown) involves mainly peripheral rather than perinuclear cellular regions (n = 3). Arrowheads indicate peripheral LC3 puncta (n = 3; 20–70 cells per condition).
Figure EV4. Overexpression of E‐Syt2 and E‐Syt3 enhances autophagy.
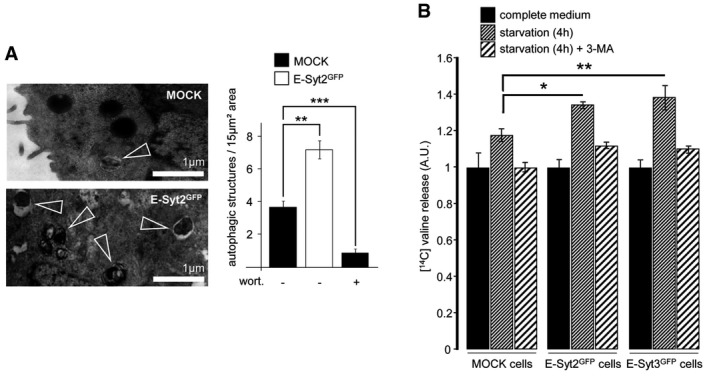
- An electron micrograph of GFP‐E‐Syt2‐expressing HeLa cells starved for 1 h, showing an increased number of autophagic structures (arrowheads) compared to starved control cells. Scale bar, 1 μm. Wortmannin (wort, 100 nM) was used as a negative control, and autophagic structures were counted in 15 μm2 areas (n = 10 cells).
- Proteolysis analysis showing an increased protein degradation rate in GFP‐E‐Syt2‐ and GFP‐E‐Syt3‐expressing cells (n = 3). 3‐methyladenine (3‐MA) was used at 10 mM.
We then sought to test how impairing ER‐PM contact sites formation would influence autophagy. To do this, we inhibited expression of the three E‐Syt proteins (E‐Syt1, E‐Syt2 and E‐Syt3) simultaneously using siRNAs targeting the mRNAs encoding each of these proteins (Fig 6A and B). Interestingly, in the E‐Syt‐deficient cells the total number of LC3GFP structures was decreased compared to control cells (Fig 6C and D). The difference was even more striking when we quantified the peripheral to perinuclear ratio of LC3 puncta in cells treated with Bafilomycin A1 (a V‐ATPase inhibitor preventing fusion between autophagosome and lysosome) to maximize the number of autophagic structures (Fig 6C and D). The decrease observed in siE‐Syt‐treated cells was primarily due to decreases in numbers of peripheral puncta rather than to decreases in perinuclear LC3.
Figure 6. Autophagosome biogenesis is reduced in E‐Syt‐deficient cells.

-
A, BHeLa cells were treated with control siRNA (siCTRL) or with siRNAs targeting mRNAs encoding each of the E‐Syts (siE‐Syts). (A) Western blots of cell lysates. Actin is used as a loading control. (B) E‐Syts mRNAs were quantified. Means ± s.d. are plotted (n = 3).
-
CHeLa cells stably transfected with GFP‐LC3 and treated with siE‐Syts or siCTRL were not treated (−BAF. A1) or were treated with Bafilomycin A1 (+BAF. A1). Representative images are shown. Empty arrowheads indicate peripheral LC3 puncta. Scale bars, 10 μm.
-
DQuantification of experiments shown in panel (C) (n = 3; 20 cells per condition). Means ± s.e.m. are plotted.
-
EHeLa cells treated with control siCTRL or with siE‐Syts were grown in complete medium or were starved for 1 or 4 h, and cells lysates were subjected to Western blot for indicated proteins.
-
FQuantification of Western blot shown in panel (E), with 20 cells analysed per condition (n = 5).
Western blot analyses performed following a time course of starvation‐induced autophagy revealed a decrease in LC3 lipidation as well as decreases of the amounts of the autophagosome biogenesis regulators ATG16L1 and ATG5—ATG12 in E‐Syt‐deficient cells (Fig 6E and F). Moreover, using the LC3GFP‐RFP tandem dye, which is widely used to measure autophagic flux (Klionsky et al, 2016), we observed that the GFP/RFP ratio was not modified in the E‐Syt‐deficient cells compared to control cells (Fig EV5). Together, these data suggest that, although the number of autophagic structures was diminished when ER‐PM contact sites were reduced, the maturation and transport to lysosomes of the remaining autophagosomes were not altered.
Figure EV5. Autophagosome maturation is not affected in E‐Syt‐deficient cells.
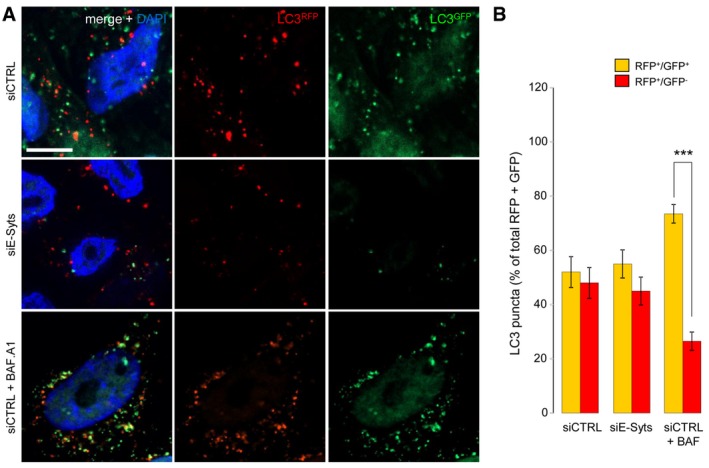
-
A, BHeLa cells stably transfected with mRFP‐GFP‐LC3 and treated with siE‐Syts have fewer autophagosomes, but autophagosomes have normal functionality, as evidenced by (A) microscopy and (B) by RFP+/GFP+ and RFP+/GFP− LC3‐puncta counting. Cells treated with Bafilomycin A1 (+BAF. A1) and siCTRL were used as a positive functionality control and showed decreased autophagosome maturation (i.e. reduced RFP+/GFP− LC3‐puncta compared to siCTRL‐treated cells) as expected (n = 3). ***P < 0.001, unpaired two‐tailed t‐test. Scale bar, 10 μm. Plotted are mean ± s.e.m.
One of the major molecular events responsible for autophagosome biogenesis is the synthesis of PI3P at the omegasome on the ER membrane (Axe et al, 2008; Lamb et al, 2013; Roberts & Ktistakis, 2013). PI3P is synthesized not only at the omegasome membrane but also on early endosomes as well (Di Paolo & De Camilli, 2006; Marat & Haucke, 2016). We observed that the omegasome‐marker and PI3P binding protein DFCP1 co‐distributed with E‐Syt2 domains on the ER (Fig 4). Therefore, we looked directly for PI3P lipid in proximity to these ER‐PM contact sites during short‐term starvation. Interestingly, we observed PI3P‐positive structures [detected by FYVEGST/fluorescent anti‐GST antibody indirect staining (Khaldoun et al, 2014)] in the immediate vicinity of ER membrane regions positive for E‐Syt3 and LC3 but not in regions stained by endosomal marker EEA1 after 15 min of starvation (Appendix Fig S3A and B). We obtained similar results using 2x‐FYVEGFP dye to stain for PI3P (Appendix Fig S3C) and when cells were stained using ATG16L1 and VPS35 (Seaman et al, 1998) to mark early autophagic structures and early endosomes, respectively (Appendix Fig S3D).
Our results suggest that E‐Syts directly or indirectly participate in autophagosome biogenesis. Because we observed PI3P at E‐Syts domains after autophagy induction, we speculated that these proteins are involved in regulation of PI3P synthesis at ER‐PM contact site‐associated autophagosome biogenesis. To assess this hypothesis, we quantified PI3P puncta in control cells and cells deficient in all three E‐Syt proteins under both fed and starved conditions. We used wortmannin, a drug that inhibits VPS34 enzymatic activity (Powis et al, 1994), as a negative control. After a short period of starvation E‐Syt‐deficient cells had fewer PI3P‐positive structures than control cells (Fig 7A and B). By quantification of the early endosomal pool of PI3P (identified by co‐localization with EEA1) and the non‐early endosomal pool of PI3P (EEA1‐negative puncta), which accounts mostly for autophagy‐associated structures, we were able to determine that this decrease affected the autophagy‐related PI3P pool only (Fig 7C). This suggests that E‐Syts proteins, and by extension, the ER‐PM contact sites regulated by E‐Syts are associated with the local PI3P synthesis necessary for ER‐PM‐associated autophagosome biogenesis.
Figure 7. Autophagy‐associated PI3P synthesis is affected in cells lacking E‐Syts.

-
ARepresentative confocal images of HeLa cells transfected with non‐targeting siRNA (siCTRL) or with siRNAs targeted to the three E‐Syts (siE‐Syts) grown under basal and starvation conditions with or without wortmannin (WORT, a PI3K inhibitor) and immunostained for PI3P (detected by the GST‐2xFYVE peptide), EEA1 (an endosomal marker) and DAPI (to stain nuclei). Scale bars, 10 μm.
-
B, CQuantifications of confocal images for (B) PI3P‐positive and (C) PI3P‐ and EEA1‐positive structures per area (250 μm2). Plotted are means ± s.e.m. of 15–30 images from three independent experiments; ***P < 0.001, unpaired two‐tailed t‐test.
-
DWestern blots of protein lysates and immunoprecipitates from siCTRL‐ or siE‐Syt‐transfected HeLa cells immunostained for VPS34. Actin was used as a loading control.
-
EQuantification of in vitro VPS34 enzymatic activity in siCTRL‐ and siE‐Syt‐transfected HeLa cells. NS, non‐significant, unpaired two‐tailed t‐test (n = 3). Means ± s.e.m. are plotted.
-
FHeLa cells transfected with GFP‐E‐Syt2 and RFP‐Sec61β (an ER marker) were immunostained for WIPI2 (a PI3P‐binding protein) and DAPI. Empty arrowheads indicate co‐distribution of Sec61β/WIPI2/E‐Syt2. Scale bars, 5 μm.
-
G, HRepresentative confocal images of (left) HeLa cells transfected with the ER‐PM markers GFP‐E‐Syt2 and mCherry‐E‐Syt3 (wt) and siCTRL; (middle) HeLa cells transfected with siE‐Syts and GFP‐E‐Syt2 and mCherry‐E‐Syt3 vectors (rescue experiment); (right) HeLa cells transfected with siE‐Syts and vectors for expression of the tethering‐defective mutants GFP‐∆C2C‐E‐Syt2 and mCherry‐∆C2C‐E‐Syt3. Cells were immunostained for WIPI2 and with DAPI, and (G) perinuclear and (H) peripheral planes are shown. Scale bars, 10 μm. WIPI2 staining is shown as glow picture (signal intensity).
-
IQuantifications of perinuclear and peripheral WIPI2 puncta from experiments described in panels (G and H). Plotted are means ± s.e.m. of 15–30 images. ***P < 0.001, NS, non‐significant, unpaired two‐tailed t‐test.
-
JWestern blots from protein lysates of the cells from experiments described in panels (G, H) immunostained as indicated. Actin was used as a loading control.
To further understand this mechanism, we analysed levels of proteins that are directly implicated in the early steps of autophagosome biogenesis, namely components of the ULK1/ATG1 complex (composed of ULK1, ATG13, FIP200 and ATG101) and the PI3K class III complex (PI3KC3, composed of VPS34, VPS15, Beclin1, ATG14L and other regulators; Alers et al, 2012; Rubinsztein et al, 2012; Lamb et al, 2013) in E‐Syt‐deficient cells. Interestingly, there were no detectable differences in levels of ATG13 protein or ULK1 dephosphorylated at serine 757, a key signal for activation of autophagosomal pathway (Alers et al, 2012), in cells lacking the E‐Syts and control cells (Fig EV6A). Further, ULK1 puncta formation did not differ in E‐Syt‐deficient and control cells (Fig EV6B and C). In contrast, levels of Beclin1 and ATG14L [two pivotal regulators of PI3KC3 (Liang et al, 1999; Sun et al, 2008; Itakura et al, 2008)] and, to a lesser extent, lipid kinase VPS34 were decreased in cells lacking E‐Syts compared to control cells (Fig EV6A). This might explain why the autophagosomal pool of PI3P was diminished when ER‐PM tethering was inhibited. We next measured the VPS34 activity in vitro after immunoprecipitation of VPS34 from control cells and cells treated with siRNAs targeting E‐Syts mRNAs (Fig 7D). We did not observe a significant difference in the in vitro production of PI3P (Fig 7E). Since we did observe alterations in Beclin1 and ATG14L levels (Fig EV6A), we hypothesized that the stability of PI3KC3 regulators alters PI3P synthesis without affecting VPS34 itself.
Figure EV6. The ULK1 complex is not affected in E‐Syt‐deficient cells.
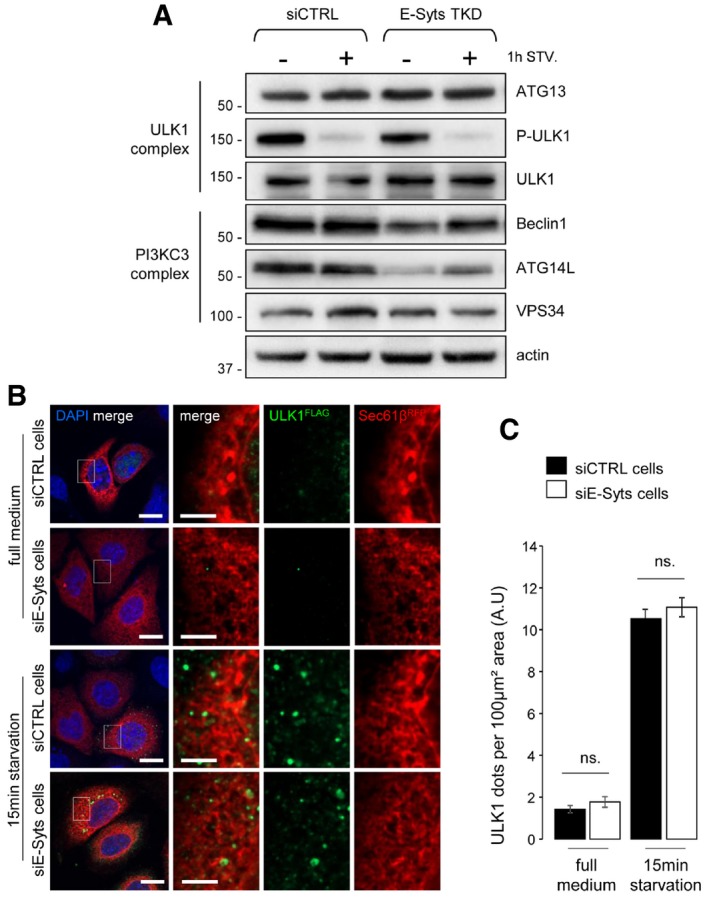
- Western blots of protein lysates from siCTRL‐ and siE‐Syt‐treated HeLa cells grown in complete (−) and 1 h of starvation (+1 h STV.) conditions (n = 3). Actin is used as a loading control.
- Confocal microscope images of HeLa cells co‐transfected with FLAG‐ULK1 and RFP‐Sec61β. Nuclei are marked with DAPI. Scale bars, 10 and 4 μm (magnified areas).
- Quantification of ULK1 puncta in images from (B) (n = 3; 20 cells analysed). Mean ± s.e.m. are plotted. NS, non‐significant, unpaired two‐tailed t‐test.
We then studied the behaviour of WIPI2, an ATG16L1‐binding protein implicated in early steps of phagophore assembly, which has been reported to directly bind to PI3P (Polson et al, 2010; Dooley et al, 2014; Wilson et al, 2014). WIPI2 co‐distributed with E‐Syt2GFP after 15 min of starvation (Fig 7F), confirming that the PI3P pool observed at ER‐PM contact sites was indeed related to the autophagosome assembly machinery. We then analysed the distribution of WIPI2 protein after 15 min of starvation in cells treated with siRNAs designed to inhibit E‐Syts expression and co‐transfected with vectors for expression of wild‐type E‐Syt2 and E‐Syt3 or with E‐Syts mutants (ΔC2C E‐Syts) unable to promote ER to PM tethering (Giordano et al, 2013). Interestingly, we noted that distribution of WIPI2 to the periphery (i.e., the PM vicinity) was lost in cells lacking E‐Syts and rescued by wild‐type E‐Syts, but not by ΔC2C E‐Syts. Conversely, perinuclear distribution of WIPI2 was not affected and resulted similar in all samples (Fig 7G–I). Biochemical analysis showed significantly less WIPI2, Beclin1, ATG14L, and VMP1 [a PI3KC3 partner protein (Molejon et al, 2013a)] in cells transfected with siRNA targeting E‐Syts mRNAs and the vectors for ΔC2C‐E‐Syts expression compared to siRNA‐treated cells expressing the wild‐type E‐Syts (Fig 7J). These experiments suggest that the tethering functions of E‐Syt2 and 3 are required for the stability of the PI3KC3 complex during autophagosome biogenesis at ER‐PM contact sites.
To further analyse the relationships of E‐Syts domains to PI3KC3 regulation during autophagy initiation, we focused on the ER protein VMP1, which was previously reported to play essential roles in autophagy by the direct recruitment of Beclin1 and by promoting PI3P synthesis (Molejon et al, 2013a; Calvo‐Garrido et al, 2014). As expected, VMP1 was co‐distributed with ER markers and LC3‐positive vesicles after autophagy induction (Fig 8A). Moreover, VMP1 was observed on membrane structures positive for E‐Syts and LC3 (Fig 8B and C). We then focused our analyses on Beclin1, the partner of VMP1 in the PI3KC3 complex during autophagy. Interestingly, we observed the co‐distribution of VMP1 with Beclin1 and E‐Syt3 in the vicinity of PM by confocal microscopy (Fig 9A) as well as by time‐lapse microscopy upon autophagy induction (Fig 9B). Finally, we observed that the amounts of VMP1, Beclin1, and ATG14L were increased in cells overexpressing E‐Syts (Fig 9C), indicating that stability and/or the turnover of these proteins is regulated by E‐Syts.
Figure 8. VMP1 co‐distributes with E‐Syt2 and E‐Syt3 during autophagosome biogenesis.

- Confocal images of HeLa cells co‐transfected with the ER marker RFP‐Sec61β and GFP‐VMP1 and immunostained for the autophagosome marker LC3, showing the localization of VMP1, after 15 min of starvation. ER‐associated and non‐associated LC3‐positive autophagic structures are indicated by white and yellow arrowheads, respectively; autophagosomes are indicated by light blue arrowheads.
- Confocal images of HeLa cells co‐transfected with the ER‐PM contact marker mCherry‐E‐Syt3 and GFP‐VMP1, starved for 15 min and immunostained for LC3, showing the localization of VMP1 at ER‐PM contact sites associated or not with LC3‐positive autophagic structures (white and empty arrowheads, respectively).
- Confocal images of HeLa cells co‐transfected with RFP‐Sec61β, myc‐E‐Syt2 and GFP‐VMP1, starved for 15 min and immunostained for LC3. DAPI is used to mark nuclei. Arrowheads indicate local codistribution of GFP‐VMP1, myc‐E‐Syt2 and RFP‐Sec61β.
Figure 9. E‐Syt2 and E‐Syt3 are interacting partners of VMP1 and Beclin1 at ER‐PM contact sites.

- Representative confocal images of HeLa cells expressing GFP‐VMP1, FLAG‐Beclin1 and mCherry‐E‐Syt3 and immunostained for DAPI. Empty arrowheads indicate sites of co‐distribution of VMP1, Beclin1 and E‐Syt3. Scale bar, 10 μm.
- Time‐lapse images of HeLa cells expressing mCherry‐E‐Syt3, GFP‐VMP1 and CFP‐Beclin1 under starved conditions (5 min). Three channels were observed simultaneously using three cameras. Empty arrowheads indicate VMP1 present at ER‐PM contact sites positive for the early autophagy marker Beclin1. Scale bar, 5 μm.
- Western blots of protein lysates from HeLa cells transfected with vectors for expression of GFP‐E‐Syt2 or mCherry‐E‐Syt3 or both or with empty vector. The analysed antibodies are listed on the left. Actin was used as a loading control.
- Western blots of protein lysates and immunoprecipitates of HeLa cells transiently co‐transfected with vectors for expression of myc‐Beclin1 and GFP‐E‐Syt2 or empty vector; cells were grown in complete medium or starved for 30 min. Samples were immunoprecipitated using GFP‐trap beads and immunostained with indicated antibodies.
The above‐described results suggest that E‐Syts platforms could recruit PI3KC3 complex proteins, notably Beclin1 and the ER‐associated regulator VMP1. Indeed, co‐immunoprecipitations experiments revealed that VMP1 and Beclin1 co‐immunoprecipitated with E‐Syt2 immediately after autophagy induction (Fig 9D, left panel). Of note, this triple association was diminished after 30 min of starvation (Fig 9D, right panel), suggesting that the complex dissociates after autophagosome formation. This was indirectly confirmed by analysis of the interaction of E‐Syt2 protein with a VMP1 mutant (ΔatgD VMP1) lacking the domain responsible for the interaction with Beclin1 (Molejon et al, 2013a). Under these conditions, a permanent association of E‐Syt2 and ΔatgD VMP1 was observed by co‐immunoprecipitation (Appendix Fig S4A) and by immunofluorescence (Appendix Fig S4B). Our data suggest that VMP1 permanently interacts with E‐Syt2 and that stress‐induced mobilization of Beclin1 leads to formation of a complex of Beclin1 with VMP1‐E‐Syt2 at ER‐PM contact sites to ensure temporal and spatial regulation of PI3P synthesis required for autophagosome biogenesis.
Discussion
Although tremendous efforts have been made to better identify the sources of autophagosome membranes, many aspects of autophagosome biogenesis remain to be clarified. Autophagy induction and regulation depend on and interplay among endo‐membranes, intracellular signalling and enzymatic complexes (Molino et al, 2017). ER membrane dynamics appear to be central in the omegasome to phagophore transition sequence, and ER interconnections and dialogs with other organelles are tantalizing candidates to decipher the membrane mobilization that occurs during the initiation of autophagy. Various membranes appear to be involved in autophagosome assembly such as PM and endosomes (Ravikumar et al, 2010b; Rubinsztein et al, 2012; Tooze, 2013), Golgi (Geng et al, 2010), ER exit sites (Carlos Martín Zoppino et al, 2010; Graef et al, 2013), ERGIC domains and vesicles (Ge et al, 2013), lipid droplets (Dupont et al, 2014; Shpilka et al, 2015) and mitochondria (Hailey et al, 2010; Gomez‐Suaga et al, 2017). The ability of the ER to establish contacts with other organelles was elegantly illustrated in a study that established the requirement for ER–mitochondria contact sites precise targeting and regulation of ATG protein functions (Hamasaki et al, 2013). ER is also engaged in contact sites with the PM. These contact sites are associated with stress sensing and are under the regulation of key proteins, including the E‐Syts, that are physical regulators of the ER to PM tethering (Elbaz & Schuldiner, 2011; Pérez‐Lara & Jahn, 2015).
Here, we report that ER‐PM contact sites positively regulate the formation of a specific pool of autophagosomes. Our findings demonstrate that a direct dialog exists between the ER and the PM during autophagosome biogenesis that does not involve vesicular trafficking from the PM (Ravikumar et al, 2010a; Puri et al, 2013). Interestingly, we showed that the contribution of ER‐PM contact sites to autophagosome biogenesis is as important as the contribution of ER–mitochondria contact sites. The ER–mitochondria contacts seem to be more important for basal autophagy, whereas the ER‐PM tethering appears to be dedicated to autophagy induced by nutritional and putatively other stresses.
Accordingly, we demonstrated that E‐Syts proteins, previously shown to be stress sensors and membrane trafficking, phosphoinositide and lipid‐transfer regulators (Giordano et al, 2013; Stefan et al, 2013; Schauder et al, 2014; Fernández‐Busnadiego et al, 2015), contribute to autophagy‐related PI3P synthesis at the cortical ER engaged in PM tethering. More precisely, our data indicate that E‐Syts stabilize the PI3KC3 complex at ER membrane through interaction with VMP1, an ER membrane protein shown to recruit the ATG machinery (Itakura & Mizushima, 2010). VMP1 recruits its PI3KC3 binding partner Beclin1 (Molejon et al, 2013a) to cortical ER for local and dedicated PI3P pool synthesis. The tethering function of E‐Syt2 and 3 (namely the C2C domain) was required for the proper autophagosome biogenesis on contact sites. Determining whether the SMP domain of E‐Syts, previously shown to be responsible for lipid transfer (Schauder et al, 2014; Liou & Chang, 2015), is necessary for this process will deepen our understanding of the molecular mechanisms of E‐Syts‐VMP1‐Beclin1 dialog on contact sites. Interestingly, VMP1 protein was recently shown to participate in a certain number of ER‐driven contact sites (Tábara & Escalante, 2016). VMP1 was previously demonstrated to interact with Beclin1 (Molejon et al, 2013a,b). These data together suggest that VMP1 is thus to be considered as a scaffold for membrane tethering and for ER micro‐domains engaged in autophagy regulation.
Our data yielded a comprehensive view of the mechanisms and subcellular locations of autophagosome biogenesis during the stress response by highlighting the importance of the PI3KC3 spatial regulation. We propose that, depending on the stress status of the cell, the autophagic machinery mobilizes different membrane compartments to ensure a local autophagy‐dedicated PI3P pool synthesis, crucial for autophagosome biogenesis (Lamb et al, 2013; Tooze, 2013). ER–mitochondria contact sites were shown to participate in autophagosome biogenesis through the STX17‐dependent stabilization of ATG14L on the ER domains directly connected to mitochondria (Hamasaki et al, 2013). Here, we report that ER‐PM contact sites are also able to mobilize the PI3KC3 complex via the VMP1‐Beclin1‐E‐Syt2 local and transient interaction at ER domains facing the PM.
Biogenesis of autophagosomes at ER–mitochondria contact sites and ER‐PM contact sites may differ by spatial localization and the identities of scaffolding and regulatory proteins. The presence of PI3KC3 complex, and thus of PI3P, suggests that these ER‐driven membrane contact sites (with PM, mitochondria and maybe others) act as local platforms for PI3KC3 complex recruitment and “membrane modelling moulds or niches” to ensure proper assembly of phagophore components. Then, by interacting with different partner proteins at different sites, VMP1 (and probably other still‐unidentified proteins) adapts the autophagy process to different requirements. If this is the case, local partner proteins other than E‐Syts and STX17 will likely be identified in the near future. Our study suggests that the ER must engage tethering domains to initiate pre‐autophagosomal structure assembly. Future studies will interrogate whether other membrane sources reported to participate in autophagosome biogenesis act through the formation of specific ER‐driven contact sites, which have not been explored yet.
Materials and Methods
Statistical analyses
No statistical methods were used to predetermine sample size. The experiments were not randomized. The investigators were not blinded to allocation during experiments and outcome assessment.
Cell culture
Unless specified, all cell lines were from ATCC. HeLa cells were grown in minimum essential medium (MEM), supplemented with GlutaMAX, 10% FCS and non‐essential amino acids mix (Gibco) at 37°C and 5% CO2. Kidney mouse epithelial cells (KECs) and Madin–Darby canine kidney (MDCK) epithelial cells were cultured in Dulbecco's modified Eagle medium (DMEM) supplemented with 10% FCS. HeLa cells stably expressing the mRFP‐GFP/LC3 reporter (Kimura et al, 2007) were a kind gift from T. Yoshimori (Osaka University, Osaka, Japan). GFP‐LC3 HeLa cells were grown in 10% FCS‐RPMI 1640, supplemented with GlutaMAX (Gibco) and the selection‐reagent G418 (500 mg/ml, Sigma). For starvation analyses, cells were washed three times and incubated in Earle's balanced salt solution (EBSS) for the indicated times (15 min, 1 or 4 h).
Mechanical stress induction
Kidney mouse epithelial cells (KECs) or MDCK cells were seeded into closed perfusion chambers (Microslide I0.6 Luer; channel dimensions 50 × 5 × 0.4 mm with iBiTreat, Ibidi) and cultured for at least 3 days to allow polarization and maximum ciliogenesis. The chamber was connected to a computer‐controlled set‐up containing an air‐pressure pump and a two‐way switching valve (Ibidi pump system 10902). To generate the flux, 20 ml of cell‐culture medium was pumped in unidirectional manner between two reservoirs through the flow channel at a rate corresponding to a shear stress of 1 dyn/cm2. Cells were collected after 4, 24, 48 and 72 h. KEC protein lysates were processed as described in the immunoblotting section, and MDCK cells were fixed and analysed by immunofluorescence, as specified in the cell fluorescence immunostaining section.
Plasmids and siRNAs
Expression vector for RFP‐Sec61β was a kind gift from T. Rapoport (Harvard University, Cambridge, MA, USA; Shibata et al, 2008). GFP‐Rubicon expression vector was a kind gift from T. Yoshimori (Osaka University). GFP‐DFCP1 and GFP‐2xFYVE were kind gifts from N. Ktistakis (Cambridge University, Cambridge, UK) and J. Gruenberg (University of Geneva, Geneva, Switzerland), respectively. Expression vectors for GFP‐, mCherry‐, and myc‐E‐Syt2 and 3, as well as GFP‐∆C2C‐E‐Syt2, mCherry‐∆C2C‐E‐Syt3 were gifts from P. De Camilli (Department of Cell Biology, Yale School of Medicine, New Haven, CT, USA). ssHRP‐myc‐KDEL was from T. Schikorski (Universidad Central Del Caribe, Bayamon, Puerto Rico). FLAG‐ULK1 was from James Murray (Trinity College, Dublin, Ireland). FLAG‐Beclin1 was from B. Levine (UT Southwestern Medical Center, Texas, USA). GFP‐VMP1 and GFP‐∆atgD‐VMP1 were cloned in pEGFP‐N1 (Clontech), containing full‐length rat VMP1 cDNA (NM_138839) or VMP1ΔAtg subcloned within the HindIII and BamHI restriction sites. siRNA duplexes targeting E‐Syt‐1 (SI00110306 and SI00110299), E‐Syt2 (SI04906545 and SI04181058), E‐Syt3 (SI04228448 and SI04166785) were purchased from Qiagen. Control siRNA was from Dharmacon‐Thermo Scientific.
Transfection
For electron and light microscopy analyses, cells were transfected with plasmids for GFP‐E‐Syt2 and/or GFP‐E‐Syt3 overexpression 24 h before analysis using Fugene HD (Promega) according to the manufacturer's protocol. For other experiments, transfection was at a reduced ratio of plasmid and transfection reagent (1:3.5). siRNA transfections were performed using RNAi MAX (Invitrogen), and cells were cultured for 72 h prior to analysis.
RNA extraction and quantification
RNA was extracted from cells using the NucleoSpin RNA kit according to the manufacturer's guidelines (Macherey‐Nagel). cDNA was made from 1 μg of RNA with MMLV reverse transcriptase using random hexamer primers (Life Technologies). qRT–PCR was performed using iTAQ SYBR Green (Bio‐Rad) and a Viia7 Real‐time PCR System (Applied Biosystems); transcript levels were normalized to the internal control, the reference gene S26. The exon–exon boundary‐spanning sequences of the primers used for E‐Syt1, E‐Syt2, E‐Syt3 and S26 were previously published. Relative quantification was calculated using the ΔΔCT method.
Antibodies and reagents
The following antibodies were used for immunoblotting. Guinea pig‐anti‐p62/SQSTM1 (Progen Biotechnik GmbH, 1:10,000), rabbit‐anti‐LC3B (Sigma, 1:10,000), rabbit‐anti‐E‐Syt1 (Sigma, 1:500), rabbit‐anti‐E‐Syt2 (Sigma, 1:500), rabbit‐anti‐E‐Syt3 (Sigma, 1:500), rabbit‐anti‐STX17 (Sigma, 1:500), mouse‐anti‐calnexin (BD Transduction Laboratories, clone 37, 1:2,000), rabbit‐anti‐PTPIP51 (Sigma, 1:1,000), rabbit‐anti‐ATG16L1 (MBL, 1:1,000), mouse‐anti‐ATG5 (Nanotools, clone 7C6, 1:2,000), mouse‐anti‐RFP (Chromotek, clone 6G6, 1:1,000), mouse‐anti‐GFP (Roche, clones 7.1 and 13.1, 1:2,000), mouse‐anti‐WIPI2 (AbD Serotec, clone 2A2, 1:1,000), rabbit‐anti‐VMP1 (Cell Signaling, 1:1,000), mouse‐anti‐ANXA2 (BD Transduction Laboratories, clone HH7, 1:2,500), mouse‐anti‐VPS15 (Abnova, clone 1B5, 1:1,000), rabbit‐anti‐ATG13 (Sigma, 1:1,000), rabbit‐anti‐phospho‐ULK1 (Ser757; Cell Signaling, 1:1,000), rabbit‐anti‐ULK1 (Sigma, 1:1,000), mouse‐anti‐Beclin1 (BD Transduction Laboratories, clone 20, 1:1,000), rabbit‐anti‐ATG14 (Sigma, 1:1,000), rabbit‐anti‐VPS34 (Cell Signaling, 1:1,500), mouse‐anti‐actin (Millipore, clone C4, 1:50,000). For immunoprecipitation of VPS34, we used the rabbit‐anti‐VPS34 (Echelon, 1:125).
The following antibodies were used for immunostaining: mouse‐anti‐LC3B (MBL, clone 4E12, 1:200), rabbit‐anti‐LC3B (MBL, 1:200), mouse‐anti‐Na/K‐ATPase (Millipore, clone C464.6, 1:200), rabbit‐anti‐ATG16L1 (MBL, 1:200), mouse‐anti‐WIPI2 (AbD Serotech, clone 2A2, 1:200), mouse‐anti‐EEA1 (BD Transduction Laboratories, clone 14, 1:200), FITC‐conjugated goat‐anti‐GST (Abcam, 1:200), mouse‐anti‐VPS35 (Abcam, 1:200), mouse‐anti‐myc (Sigma, clone 9E10, 1:200), rabbit‐anti‐TOM20 (Santa Cruz, 1:200). Secondary HRP conjugate anti‐rabbit IgG (GE Healthcare, 1:10,000), HRP conjugate anti‐mouse IgG (Bio‐Rad, 1:20,000) and HRP conjugate anti‐guinea pig (Sigma, 1:10,000) were used for immunoblotting. Alexa Fluor‐conjugated secondary antibodies (donkey anti‐mouse IgG and donkey anti‐Rabbit IgG, Life Technologies, 1:200) were used for fluorescence microscopy. The GST‐FYVE‐FYVE peptide (1:1,000) was a gift from J. Gruenberg (University of Geneva, Geneva, Switzerland). The following reagents were used to treat cells: Bafilomycin A1 (Sigma, 200 nM), wortmannin (Sigma, 100 nM) and 3‐methyladenine (3‐MA, Sigma, 10 mM), and Torin1 (Calbiochem, 1.5 μM).
Western blotting
Immunoblot analyses were performed with precast gradient gels (4–12% Bis‐Tris, Invitrogen) using standard methods. Briefly, cells were washed twice with ice‐cold PBS and lysed on ice in NP‐40 buffer (150 mM NaCl, 20 mM Tris–HCl at pH 8, 1 mM EDTA and 1% NP‐40) for 30 min in the presence of a protease and phosphatase inhibitors cocktail (ThermoFisher Scientific). The solubilized fraction was recovered in the supernatant after centrifugation at 12,000 g for 15 min, and protein concentration was measured by the BCA protein assay kit (Pierce) using bovine serum albumin (BSA) as a standard. Protein lysates in protein sample buffer (Invitrogen) were incubated for 10 min at 70°C, separated by SDS–PAGE, transferred onto PVDF membranes, then subjected to Western blot analysis and finally visualized using a chemiluminescent HRP substrate (Millipore) and a ChemiDoc MP Imaging System (Bio‐Rad). Quantification of band intensities was carried out using the Image Lab software (Bio‐Rad).
Immunoprecipitation analysis
Immunoprecipitation analysis was performed using the GFP beads (GFP‐Trap Chromotek). Ten million HeLa cells previously co‐transfected with myc‐Beclin1 and GFP‐E‐Syt2 or GFP empty vector or with GFP‐VMP1, GFP‐ΔatgD‐VMP1 or GFP empty vector were suspended in lysis buffer (10 mM Tris, pH 7.5, 150 mM NaCl, 0.5% mM EDTA, 0.5% Nonidet P‐40) and protease and phosphatase inhibitor cocktail (Pierce). Cell lysates were centrifuged at 15,000 g for 15 min. The resulting supernatant was incubated with anti‐GFP beads for 1 h, while rotating at 4°C. Beads were collected by centrifugation and washed six times, then bead‐bounded samples were eluted in SDS sample buffer, boiled for 5 min, loaded onto SDS–PAGE gels and blotted on PVDF membranes as described in the Western blotting section.
VPS34 immunoprecipitation and activity assay
Immunoprecipitation of VPS34 was performed using the Protein G Sepharose 4 Fast Flow (GE Healthcare) and the rabbit‐anti‐VPS34 antibody (Echelon, 1:125), following the manufacturer's instructions. Briefly, 1 × 10⁷ HeLa cells previously transfected with siCTRL or with siE‐Syts were suspended in lysis buffer (20 mM Tris, pH 7.5, 137 mM NaCl, 1 mM MgC12, 1 mM CaC12, 1% Nonidet P‐40, 10% glycerol) and protease and phosphatase inhibitor cocktail (Pierce). Cell lysates were centrifuged at 15,000 g for 15 min. The resulting supernatant was incubated with anti‐VPS34 overnight at 4°C on a rotating wheel, followed by a 1‐h incubation with the washed Sepharose beads, while rotating at 4°C. Beads were collected by centrifugation and washed six times, and then bead‐bounded samples were immediately added to VPS34 reaction buffer (10 mM Tris, pH 8, 100 mM NaCl, 1 mM EDTA, 10 mM MnCl2 and 50 μM ATP) to start the PI3P in vitro synthesis. PI3P production was detected using an ELISA (Echelon) following the manufacturer's instructions. Samples were eluted in SDS sample buffer, boiled for 5 min, loaded onto SDS–PAGE gels and blotted on PVDF membranes, as described in the Western blotting section.
Proteolysis assay
HeLa cells were first transfected with control or E‐Syt2 or 3 cDNA and then proteins were radiolabelled by incubation in complete medium containing 0.2 μCi/ml of L‐[U‐14 C] valine. After 20 h, cells are incubated with fresh complete medium containing 10 mM cold valine for 1 h to degrade short‐lived proteins. After this period, the medium was removed and replaced with fresh medium supplemented with 10 mM cold valine, and incubated for further 4 h. To stimulate autophagy, EBSS containing 10 mM cold valine and 0.1% of bovine serum albumin were used. 3‐MA (10 mM, Sigma‐Aldrich) was added in EBSS to inhibit autophagy. Trichloroacetic acid (TCA)‐precipitable radioactivity in the cells monolayers and the TCA‐soluble radioactivity released into the media were determined. Valine release (a measure of proteolysis) was calculated as a ratio of TCA‐soluble supernatant to total cell‐associated radioactivity.
Fluorescence microscopy immunostaining
Cells were seeded onto 13‐mm glass coverslips and fixed with 4% paraformaldehyde in PBS for 15 min. Cells were then washed with PBS, blocked with 10% FCS in PBS for 30 min, followed by incubation with primary antibody in permeabilization/blocking buffer (PBS with 10% FCS and 0.05% saponin) for 1 h at room temperature (or overnight at 4°C). Coverslips were PBS‐washed before and after adding secondary antibody for 1 h in blocking buffer. Coverslips were mounted on microscope slides using Mowiol with or without DAPI.
Image acquisition, processing and quantifications
Images were obtained using either a Zeiss Apotome.2 fluorescence microscope or Zeiss LSM 700 confocal microscope using a 63× oil‐immersion objective. Image analysis was performed using Zen light Zeiss LSM software, in which background was reduced using brightness and contrast adjustments applied to the whole image. 3D reconstructions were generated in Imaris software using full confocal z‐stacks of each cell. The number and percentage of cellular area occupied by LC3 puncta were determined on digital images with Icy software (http://icy.bioimageanalysis.org). For LC3 puncta counting, perinuclear and peripheral cell boundaries were manually traced.
STED microscopy
Super‐resolution two‐colour stimulated emission depletion (STED) microscopy was performed with a Leica TCS SP8 STED microscope equipped with a 100× oil STED objective and operated with the LAS AF imaging software (version 2.7.3.9723; Leica). mCherry‐labelled probes were excited with a 580‐nm white light laser, and Alexa Fluor 532‐labelled probes were excited with 532‐nm light; both were depleted with the 660‐nm laser. GFP‐labelled probes were imaged with confocal resolution. Images were deconvoluted with Huygens Professional (Scientific Volume Imaging B.V.).
Video microscopy
For confocal imaging of live cells, cells seeded onto 25‐mm round glass coverslips, treated as indicated, were placed on the stage of a Leica SP5 inverted microscope at 37°C and under 5% CO2 atmosphere. Autophagy was induced by EBSS starvation directly under the microscope.
Electron microscopy analysis and quantification
HRP detection
HeLa cells expressing ssHRP‐myc‐KDEL were fixed on coverslips with 1.3% glutaraldehyde in 0.1 M cacodylate buffer and washed in 0.1 M ammonium phosphate (pH 7.4) buffer for 1 h. HRP was visualized with 0.5 mg/ml DAB and 0.005% H2O2 in 0.1 M ammonium phosphate (pH 7.4) buffer. Development of HRP (DAB dark reaction product) took between 5 and 20 min and was stopped by extensive washes with cold water. Cells were post‐fixed in 2% OsO4, 1% K3Fe(CN)6 in 0.1 M cacodylate buffer at 4°C for 1 h, washed in cold water and then contrasted in 0.5% uranyl acetate for 2 h at 4°C, dehydrated in an ethanol series and embedded in Epon as for conventional EM (Giordano et al, 2013). Ultrathin sections were counterstained with 2% uranyl acetate before observation.
Immunogold labelling
HeLa cells were fixed with a mixture of 2% PFA and 0.125% glutaraldehyde in 0.1 M phosphate buffer (pH 7.4) for 2 h and processed for ultracryomicrotomy as described previously (Slot & Geuze, 2007). Ultrathin cryosections were double‐immunogold‐labelled with antibodies and protein A coupled to 10 or 15 nm gold (CMC, UMC). Sections of resin‐embedded cells and immunogold‐labelled cryosections were observed under a FEI Tecnai 12 microscope equipped with a CCD (SiS 1kx1k keenView) camera.
Analysis of GFP‐E‐Syt2‐overexpressing cells
HeLa cells seeded on coverslips were transfected with GFP‐E‐Syt2, and GFP‐positive cells were selected by FACS (BD FACSAria III) at the SFR Necker (Paris) cell sorting facility and were treated with or without EBSS medium and with or without wortmannin (100 nM) for 1 h. The samples were washed three times in PBS, incubated 1 h at 4°C in osmic acid (1% in sodium phosphate buffer) and dehydrated in graded ethanol solutions (2 × 10 min in 70%, 2 × 10 min in 90% and 2 × 10 min in 100% ethanol). The samples were then incubated twice for 1 min in propylene oxide and for 10 min in 50% Epon–50% propylene oxide, then embedded in Epon and incubated for polymerization for 24 h at 60°C. Finally, 90‐nm sections were cut on a Reichert Ultracut S and placed on a grid for staining for 10 min with uranyl acetate (2%) and 4 min with lead citrate at room temperature. Samples were analysed with a JEOL 1011 transmission electron microscope, and the images were recorded at 80 kV with a GATAN Erlangshen 1000 camera at the Cochin Imaging Electron Microscopy facility (Institut Cochin, Paris).
Quantification
For the quantification in HRP‐stained Epon sections, the total length of plasma membrane and the length of the closely associated HRP‐positive ER segments (< 30 nm) were measured by iTEM software (Olympus) on acquired micrographs of HeLa cells for each of 20 cell profiles. Cells were randomly selected for analysis without prior knowledge of transfected plasmid or siRNA. For early autophagic structures and autophagosomes quantification in GFP‐E‐Syt2‐overexpressing cells, we counted 10 cells for each condition. The number of autophagic structures localized either adjacent (within 1 μm) to ER‐PM contact sites (ER‐PM), to ER–mitochondria contact sites (ER‐mito), or to neither organelle (cytoplasm) was measured by iTEM software (Olympus) on acquired micrographs of HRP‐myc‐KDEL‐expressing HeLa cells for each of 20 cell profiles. All data are presented as mean ± s.e.m. of three experimental replicates.
TIRF microscopy
TIRF microscopy was performed using a Nikon Eclipse Ti microscope, equipped with an incubation chamber (37°C), a 100× TIRF objective (oil‐immersion, Nikon), a QuantEM 512 camera, a double‐colour TIRF set‐up (laser lines: 488 and 568 nm). HeLa cells seeded on coverslips and transfected with RFP‐Sec61β were treated with or without EBSS for 15 min or 1 h, then fixed and incubated with anti‐LC3 antibody, as described above. TIRF signal quantifications were made via Icy software (http://icy.bioimageanalysis.org).
Statistical analysis and reproducibility
Statistical analyses were performed by unpaired, two‐tailed Student's t‐test, using GraphPad Prism 6. In panels showing Western blotting or immunofluorescence analysis, unless stated otherwise, images are representative of three independent experiments with similar results. The number of independent experiments or cell numbers is given in the figure's legend.
Data availability
All data supporting the findings of this study are available from the authors on request.
Author contributions
ACN: designed and performed most of the experiments, analysed the data and contributed to writing the paper. FG: designed, performed and analysed most of the electron microscopy experiments. ND: performed and analysed the experiments related to mechanical stress and proteolysis assays, as well as immunoprecipitation experiments. DG: contributed to the immunofluorescence microscopy experiments and immunoprecipitation data analysis. MIV: contributed to data interpretation. PC: contributed to experimental design, data analysis and interpretation, and writing of the paper. EM: coordinated the study, designed and performed light microscopy experiments, analysed the data and wrote the paper.
Conflict of interest
The authors declare that they have no conflict of interest.
Supporting information
Appendix
Expanded View Figures PDF
Review Process File
Acknowledgements
We warmly thank T. Yoshimori, P. De Camilli, N. Ktistakis, T. Rapoport, J. Murray, J. Gruenberg and T. Schikorski for kindly sharing their tools and reagents with us. We thank as well our team colleagues for fruitful discussions and constant support, and we thank Zeina Chamoun for critical reading of the manuscript. We also acknowledge the Necker Institute Imaging and FACS Facilities (SFR Necker INSERM US24, CNRS UMS 3633), particularly Meriem Garfa‐Traoré, Raphaëlle Desvaux, Nicolas Goudin, and Jérome Mégret, as well as Alain Schmitt at the Cochin Imaging Electron Microscopy facility and also the ImagoSeine core facility of the Institut Jacques Monod. The work was supported by institutional funding from INSERM, CNRS and University Paris Descartes and grants from ANR, ECOsSUD and INCa to P.C. and E.M. and from CNRS, ANR and CIG to F.G. A.C.N. and N.D are supported by fellowships from Association pour la Recherche sur le Cancer (ARC).
The EMBO Journal (2017) 36: 2018–2033
References
- Alers S, Loffler AS, Wesselborg S, Stork B (2012) The incredible ULKs. Cell Commun Signal 10: 7 [DOI] [PMC free article] [PubMed] [Google Scholar]
- Axe EL, Walker SA, Manifava M, Chandra P, Roderick HL, Habermann A, Griffiths G, Ktistakis NT (2008) Autophagosome formation from membrane compartments enriched in phosphatidylinositol 3‐phosphate and dynamically connected to the endoplasmic reticulum. J Cell Biol 182: 685–701 [DOI] [PMC free article] [PubMed] [Google Scholar]
- Boya P, Reggiori F, Codogno P (2013) Emerging regulation and functions of autophagy. Nat Cell Biol 15: 713–720 [DOI] [PMC free article] [PubMed] [Google Scholar]
- Calvo‐Garrido J, King JS, Muñoz‐Braceras S, Escalante R (2014) Vmp1 regulates PtdIns3P signaling during autophagosome formation in Dictyostelium discoideum . Traffic 15: 1235–1246 [DOI] [PubMed] [Google Scholar]
- Carlos Martín Zoppino F, Damián Militello R, Slavin I, Álvarez C, Colombo MI (2010) Autophagosome formation depends on the small GTPase Rab1 and functional ER exit sites. Traffic 11: 1246–1261 [DOI] [PubMed] [Google Scholar]
- Di Paolo G, De Camilli P (2006) Phosphoinositides in cell regulation and membrane dynamics. Nature 443: 651–657 [DOI] [PubMed] [Google Scholar]
- Dooley HC, Razi M, Polson HEJ, Girardin SE, Wilson MI, Tooze SA (2014) WIPI2 links LC3 conjugation with PI3P, autophagosome formation, and pathogen clearance by recruiting Atg12‐5‐16L1. Mol Cell 55: 238–252 [DOI] [PMC free article] [PubMed] [Google Scholar]
- Dupont N, Chauhan S, Arko‐Mensah J, Castillo EF, Masedunskas A, Weigert R, Robenek H, Proikas‐Cezanne T, Deretic V (2014) Neutral lipid stores and lipase PNPLA5 contribute to autophagosome biogenesis. Curr Biol 24: 609–620 [DOI] [PMC free article] [PubMed] [Google Scholar]
- Elbaz Y, Schuldiner M (2011) Staying in touch: the molecular era of organelle contact sites. Trends Biochem Sci 36: 616–623 [DOI] [PubMed] [Google Scholar]
- Fernández‐Busnadiego R, Saheki Y, De Camilli P (2015) Three‐dimensional architecture of extended synaptotagmin‐mediated endoplasmic reticulum‐plasma membrane contact sites. Proc Natl Acad Sci USA 112: E2004–E2013 [DOI] [PMC free article] [PubMed] [Google Scholar]
- Friedman JR, Voeltz GK (2011) The ER in 3D: a multifunctional dynamic membrane network. Trends Cell Biol 21: 709–717 [DOI] [PMC free article] [PubMed] [Google Scholar]
- Ge L, Melville D, Zhang M, Schekman R (2013) The ER‐Golgi intermediate compartment is a key membrane source for the LC3 lipidation step of autophagosome biogenesis. Elife 2: e00947 [DOI] [PMC free article] [PubMed] [Google Scholar]
- Geng J, Nair U, Yasumura‐Yorimitsu K, Klionsky DJ (2010) Post‐Golgi Sec proteins are required for autophagy in Saccharomyces cerevisiae. Mol Biol Cell 21: 2257–2269 [DOI] [PMC free article] [PubMed] [Google Scholar]
- Giordano F, Saheki Y, Idevall‐Hagren O, Colombo SF, Pirruccello M, Milosevic I, Gracheva EO, Bagriantsev SN, Borgese N, De Camilli P (2013) PI(4,5)P(2)‐dependent and Ca(2+)‐regulated ER‐PM interactions mediated by the extended synaptotagmins. Cell 153: 1494–1509 [DOI] [PMC free article] [PubMed] [Google Scholar]
- Gomez‐Suaga P, Paillusson S, Stoica R, Noble W, Hanger DP, Miller CCJ (2017) The ER‐mitochondria tethering complex VAPB‐PTPIP51 regulates autophagy. Curr Biol 27: 371–385 [DOI] [PMC free article] [PubMed] [Google Scholar]
- Graef M, Friedman JR, Graham C, Babu M, Nunnari J (2013) ER exit sites are physical and functional core autophagosome biogenesis components. Mol Biol Cell 24: 2918–2931 [DOI] [PMC free article] [PubMed] [Google Scholar]
- Hailey DW, Rambold AS, Satpute‐Krishnan P, Mitra K, Sougrat R, Kim PK, Lippincott‐Schwartz J (2010) Mitochondria supply membranes for autophagosome biogenesis during starvation. Cell 141: 656–667 [DOI] [PMC free article] [PubMed] [Google Scholar]
- Hamasaki M, Furuta N, Matsuda A, Nezu A, Yamamoto A, Fujita N, Oomori H, Noda T, Haraguchi T, Hiraoka Y, Amano A, Yoshimori T (2013) Autophagosomes form at ER‐mitochondria contact sites. Nature 495: 389–393 [DOI] [PubMed] [Google Scholar]
- Helle SCJ, Kanfer G, Kolar K, Lang A, Michel AH, Kornmann B (2013) Organization and function of membrane contact sites. Biochim Biophys Acta 1833: 2526–2541 [DOI] [PubMed] [Google Scholar]
- Itakura E, Kishi C, Inoue K, Mizushima N (2008) Beclin 1 forms two distinct phosphatidylinositol 3‐kinase complexes with mammalian Atg14 and UVRAG. Mol Biol Cell 19: 5360–5372 [DOI] [PMC free article] [PubMed] [Google Scholar]
- Itakura E, Mizushima N (2010) Characterization of autophagosome formation site by a hierarchical analysis of mammalian Atg proteins. Autophagy 6: 764–776 [DOI] [PMC free article] [PubMed] [Google Scholar]
- Khaldoun SA, Emond‐Boisjoly M‐A, Chateau D, Carrière V, Lacasa M, Rousset M, Demignot S, Morel E (2014) Autophagosomes contribute to intracellular lipid distribution in enterocytes. Mol Biol Cell 25: 118–132 [DOI] [PMC free article] [PubMed] [Google Scholar]
- Kimura S, Noda T, Yoshimori T (2007) Dissection of the autophagosome maturation process by a novel reporter protein, tandem fluorescent‐tagged LC3. Autophagy 3: 452–460 [DOI] [PubMed] [Google Scholar]
- Klionsky DJ, Abdelmohsen K, Abe A, Abedin MJ, Abeliovich H, Acevedo Arozena A, Adachi H, Adams CM, Adams PD, Adeli K, Adhihetty PJ, Adler SG, Agam G, Agarwal R, Aghi MK, Agnello M, Agostinis P, Aguilar PV, Aguirre‐Ghiso J, Airoldi EM et al (2016) Guidelines for the use and interpretation of assays for monitoring autophagy (3rd edition). Autophagy 12: 1–222 [DOI] [PMC free article] [PubMed] [Google Scholar]
- Lamb CA, Yoshimori T, Tooze SA (2013) The autophagosome: origins unknown, biogenesis complex. Nat Rev Mol Cell Biol 14: 759–774 [DOI] [PubMed] [Google Scholar]
- Levine B, Liu R, Dong X, Zhong Q (2015) Beclin orthologs: integrative hubs of cell signaling, membrane trafficking, and physiology. Trends Cell Biol 25: 533–544 [DOI] [PMC free article] [PubMed] [Google Scholar]
- Liang XH, Jackson S, Seaman M, Brown K, Kempkes B, Hibshoosh H, Levine B (1999) Induction of autophagy and inhibition of tumorigenesis by beclin 1. Nature 402: 672–676 [DOI] [PubMed] [Google Scholar]
- Liou J, Chang CL (2015) Unveiling physiological functions of extended synaptotagmins. Cell Cycle 14: 799–800 [DOI] [PMC free article] [PubMed] [Google Scholar]
- Marat AL, Haucke V (2016) Phosphatidylinositol 3‐phosphates‐at the interface between cell signalling and membrane traffic. EMBO J 35: 561–579 [DOI] [PMC free article] [PubMed] [Google Scholar]
- Molejon MI, Ropolo A, Lo Re A, Boggio V, Vaccaro MI (2013a) The VMP1‐Beclin 1 interaction regulates autophagy induction. Sci Rep 3: 1055 [DOI] [PMC free article] [PubMed] [Google Scholar]
- Molejon MI, Ropolo A, Vaccaro MI (2013b) VMP1 is a new player in the regulation of the autophagy‐specific phosphatidylinositol 3‐kinase complex activation. Autophagy 9: 933–935 [DOI] [PMC free article] [PubMed] [Google Scholar]
- Molino D, Zemirli N, Codogno P, Morel E (2017) The journey of the autophagosome through mammalian cell organelles and membranes. J Mol Biol 429: 497–514 [DOI] [PubMed] [Google Scholar]
- Nascimbeni AC, Codogno P, Morel E (2017) Phosphatidylinositol‐3‐phosphate in the regulation of autophagy membrane dynamics. FEBS J 284: 1267–1278 [DOI] [PubMed] [Google Scholar]
- Orhon I, Dupont N, Zaidan M, Boitez V, Burtin M, Schmitt A, Capiod T, Viau A, Beau I, Wolfgang Kuehn E, Friedlander G, Terzi F, Codogno P (2016) Primary‐cilium‐dependent autophagy controls epithelial cell volume in response to fluid flow. Nat Cell Biol 18: 657–667 [DOI] [PubMed] [Google Scholar]
- Pérez‐Lara Á, Jahn R (2015) Extended synaptotagmins (E‐Syts): architecture and dynamics of membrane contact sites revealed. Proc Natl Acad Sci USA 112: 4837–4838 [DOI] [PMC free article] [PubMed] [Google Scholar]
- Polson HEJ, de Lartigue J, Rigden DJ, Reedijk M, Urbé S, Clague MJ, Tooze SA (2010) Mammalian Atg18 (WIPI2) localizes to omegasome‐anchored phagophores and positively regulates LC3 lipidation. Autophagy 6: 506–522 [DOI] [PubMed] [Google Scholar]
- Powis G, Bonjouklian R, Berggren MM, Gallegos A, Abraham R, Ashendel C, Zalkow L, Matter WF, Dodge J, Grindey G (1994) Wortmannin, a potent and selective inhibitor of phosphatidylinositol‐3‐kinase. Cancer Res 54: 2419–2423 [PubMed] [Google Scholar]
- Puri C, Renna M, Bento CF, Moreau K, Rubinsztein DC (2013) Diverse autophagosome membrane sources coalesce in recycling endosomes. Cell 154: 1285–1299 [DOI] [PMC free article] [PubMed] [Google Scholar]
- Ravikumar B, Moreau K, Jahreiss L, Puri C, Rubinsztein DC (2010a) Plasma membrane contributes to the formation of pre‐autophagosomal structures. Nat Cell Biol 12: 747–757 [DOI] [PMC free article] [PubMed] [Google Scholar]
- Ravikumar B, Moreau K, Rubinsztein DC (2010b) Plasma membrane helps autophagosomes grow. Autophagy 6: 1184–1186 [DOI] [PMC free article] [PubMed] [Google Scholar]
- Roberts R, Ktistakis NT (2013) Omegasomes: PI3P platforms that manufacture autophagosomes. Essays Biochem 55: 17–27 [DOI] [PubMed] [Google Scholar]
- Rubinsztein DC, Shpilka T, Elazar Z (2012) Mechanisms of autophagosome biogenesis. Curr Biol 22: R29–R34 [DOI] [PubMed] [Google Scholar]
- Schauder CM, Wu X, Saheki Y, Narayanaswamy P, Torta F, Wenk MR, De Camilli P, Reinisch KM (2014) Structure of a lipid‐bound extended synaptotagmin indicates a role in lipid transfer. Nature 510: 552–555 [DOI] [PMC free article] [PubMed] [Google Scholar]
- Seaman MN, McCaffery JM, Emr SD (1998) A membrane coat complex essential for endosome‐to‐Golgi retrograde transport in yeast. J Cell Biol 142: 665–681 [DOI] [PMC free article] [PubMed] [Google Scholar]
- Shibata Y, Voss C, Rist JM, Hu J, Rapoport TA, Prinz WA, Voeltz GK (2008) The reticulon and DP1/Yop1p proteins form immobile oligomers in the tubular endoplasmic reticulum. J Biol Chem 283: 18892–18904 [DOI] [PMC free article] [PubMed] [Google Scholar]
- Shpilka T, Welter E, Borovsky N, Amar N, Mari M, Reggiori F, Elazar Z (2015) Lipid droplets and their component triglycerides and steryl esters regulate autophagosome biogenesis. EMBO J 34: 2117–2131 [DOI] [PMC free article] [PubMed] [Google Scholar]
- Slot JW, Geuze HJ (2007) Cryosectioning and immunolabeling. Nat Protoc 2: 2480–2491 [DOI] [PubMed] [Google Scholar]
- Stefan CJ, Manford AG, Emr SD (2013) ER‐PM connections: sites of information transfer and inter‐organelle communication. Curr Opin Cell Biol 25: 434–442 [DOI] [PMC free article] [PubMed] [Google Scholar]
- Sun Q, Fan W, Chen K, Ding X, Chen S, Zhong Q (2008) Identification of Barkor as a mammalian autophagy‐specific factor for Beclin 1 and class III phosphatidylinositol 3‐kinase. Proc Natl Acad Sci USA 105: 19211–19216 [DOI] [PMC free article] [PubMed] [Google Scholar]
- Tábara L‐C, Escalante R (2016) VMP1 establishes ER‐microdomains that regulate membrane contact sites and autophagy. PLoS One 11: e0166499 [DOI] [PMC free article] [PubMed] [Google Scholar]
- Tooze SA (2013) Current views on the source of the autophagosome membrane. Essays Biochem 55: 29–38 [DOI] [PubMed] [Google Scholar]
- Wilson MII, Dooley HCC, Tooze SAA (2014) WIPI2b and Atg16L1: setting the stage for autophagosome formation. Biochem Soc Trans 42: 1327–1334 [DOI] [PubMed] [Google Scholar]
Associated Data
This section collects any data citations, data availability statements, or supplementary materials included in this article.
Supplementary Materials
Appendix
Expanded View Figures PDF
Review Process File
Data Availability Statement
All data supporting the findings of this study are available from the authors on request.