

Abstract
Aims
Midazolam is the drug of choice for palliative sedation and is titrated to achieve the desired level of sedation. Because of large inter‐individual variability (IIV), however, the time it takes to achieve adequate sedation varies widely. It would therefore greatly improve clinical care if an individualized dose could be determined beforehand. To find clinically relevant parameters for dose individualization, we performed a pharmacokinetic study on midazolam, 1OH‐midazolam (1‐OH‐M) and 1OH‐midazolam‐glucuronide (1‐OH‐MG) in terminally ill patients.
Methods
Using nonlinear mixed effects modelling (NONMEM 7.2), a population pharmacokinetic analysis was conducted with 192 samples from 45 terminally ill patients who received midazolam either orally or subcutaneously. The covariates analysed were patient characteristics, co‐medication and blood chemistry levels.
Results
The data were accurately described by a one compartment model for midazolam, 1‐OH‐M and 1‐OH‐MG. The population mean estimates for midazolam, 1‐OH‐M and 1‐OH‐MG clearance were 8.4 l h−1 (RSE 9%, IIV 49%), 45.4 l h−1 (RSE 12%, IIV 60.5%) and 5.1 l h−1 (RSE 11%, IIV 49.9%), respectively. 1‐OH‐MG clearance was correlated with the estimated glomular filtration rate (eGFR) explaining 28.4% of the IIV in 1‐OH‐MG clearance. In addition, low albumin levels were associated with decreased midazolam clearance, explaining 18.2% of the IIV.
Conclusion
Our study indicates albumin levels and eGFR as relevant clinical parameters to optimize midazolam dosing in terminally ill patients. The correlation between low albumin levels and decreased midazolam clearance is probably a result of inflammatory response as high CRP levels were correlated in a similar way.
Keywords: drug metabolism, NONMEM, palliative care, pharmacokinetics, sedation
What is Already Known about this Subject
While a lot of physiological changes occur at the end of life, very little is known about how these changes can affect the pharmacokinetics of drugs given in this phase.
A recent study in critically ill children showed that inflammation and organ failure can result in decreased midazolam clearance.
Animal studies and some preliminary studies in patients with cancer have shown that cancer and inflammation are associated with reduced hepatic metabolism of CYP enzymes.
What this Study Adds
Using a population approach with sparse sampling, we were able to accurately describe the pharmacokinetics of midazolam in terminally ill patients. As this method minimizes the patient's burden, it is a useful approach in future PK studies in this vulnerable population.
Midazolam clearance was decreased in patients with low albumin levels. This is possibly due to inflammatory response or a catabolic state.
Tables of Links
| LIGANDS |
|---|
| Midazolam |
Introduction
Midazolam is often used in terminally ill patients and is the drug of choice for palliative sedation 3, 4, 5, 6. It is metabolized in a two‐phase process. The first step is hydroxylation via CYP3A, mainly into α‐hydroxy‐midazolam (1‐OH‐M) and for a very small amount into 4‐hydroxy‐midazolam (4‐OH‐M). The 1‐OH‐M metabolite is active with an approximate potency of 80–100% of midazolam 7, 8, 9. After hydroxylation, midazolam is further metabolized through UDP‐glucuronosyltransferases (UGT) 1A4, 2B4 and 2B7 with α‐hydroxy‐midazolam glucuronide (1‐OH‐MG) as its major metabolite 10. 1‐OH‐MG is much less active (around 10% of the activity of midazolam) but in high concentrations, as in the case of accumulation due to renal failure, it can contribute substantially to the overall effect 7.
When midazolam is prescribed for palliative sedation, its dose is titrated to achieve the desired level of sedation 3, 5. Unfortunately the time it takes to reach adequate sedation varies widely between patients and awaking from a sedative state often occurs 11. A possible explanation for this might be large inter‐individual variability (IIV) in midazolam pharmacokinetics, which has already been shown in other populations 12, 13, 14, 15, 16. Large variability is also expected in terminally ill patients due to the heterogeneity of the population, including severe co‐morbidities (e.g. renal failure) and physiological changes that occur over time (e.g. cachexia, inflammation and concomitant medication use) 17, 18, 19, 20. Failure to respond (rapidly) to midazolam treatment is of clinical concern, especially when sedation is required to treat refractory symptoms. Patients could therefore potentially benefit if an individualized dose is determined beforehand. A first step in developing such an individualized dosing algorithm is to gain more insight into the pharmacokinetics in this population. To this end, and to find clinically relevant parameters for dose individualization, we performed a population pharmacokinetic study of midazolam and its two major metabolites (1‐OH‐M and 1‐OH‐MG) in terminally ill patients.
Methods
Study design
The study (NL32520.078.10) was approved by the Medical Ethics Committee of the Erasmus University Medical Centre Rotterdam and was performed in accordance with the principles of the Declaration of Helsinki and its later amendments. The study was conducted in the palliative care centre, Laurens Cadenza Zuid in Rotterdam, the Netherlands, over a two‐year period. Patients were eligible if they had a terminal illness, survival prognosis of more than 2 days and less than 3 months and administration of midazolam. Informed consent was asked shortly after admittance to the palliative care centre and included patients were followed until the time of death. Midazolam was given to treat insomnia or as palliative sedation in accordance with the national guidelines 6. Midazolam was given orally or administered subcutaneously as bolus injection or infusion. The exact times of administration were recorded in the patient record. Any concomitant medication was also registered in the patient's record. Demographic characteristics (age, gender, weight, race, primary diagnosis and time of death) were extracted from the electronic medical records. Primary diagnosis of the patient's terminal illness was classified using the International Statistical Classification of Diseases and Related Health Problems – 10th Revision (ICD‐10).
Blood sampling and assay
Sparse sampling was performed randomly and blood samples were collected during both the pre‐terminal and terminal stages. The terminal stage for a patient was defined as the last hours to days before death in which a patient becomes bedbound, semi‐comatose, is not able to take more than sips of fluid and is no longer able to take oral medication 21. Samples were collected either via venapuncture or indwelling venous catheter, and were centrifuged after which the plasma was collected and stored at −80°C until analysis. Blood sampling was preferably performed at the same time as sampling for clinical chemistry (standard of care) for which serum levels of albumin, creatinine, urea, bilirubin, gamma‐glytamyl transpeptidase (GGT), alkaline phosphatase (ALP), alanine transaminase (ALT), aspartate transaminase (AST), and C‐reactive protein (CRP) were determined.
Midazolam, 1‐OH‐M, 4‐OH‐M and 1‐OH‐MG were analysed in the plasma samples using liquid chromatography–tandem mass spectroscopy (LC–MS/MS) with electrospray ionization in the positive ionization mode on a Shimadzu LC‐30 (Nishinokyo‐Kuwabaracho, Japan) system coupled to an ABSciex (Framingham, MA, USA) API5500Q MS. To precipitate proteins 75 μl acetonitrile/methanol 84:16 (v/v%) containing the internal standards midazolam‐d5, 1‐OH‐midazolam‐d5, and 4‐OH‐midazolam‐d5 was added to 10 μl of patients’ plasma. Samples were vortexed, stored at −20°C for 30 min to optimize protein precipitation, vortexed again and centrifuged. Three μl was injected onto a Thermo Scientific Hypersil Gold (50 × 2.1 mm, 1.9 μm) column. A stepwise chromatographic gradient was applied using 0.05% ammonium formate /0.10% formic acid in water as mobile phase A and acetonitrile as mobile phase B. The flow rate was 0.4 ml min−1 and the column was kept at 40°C. Using multiple reaction monitoring (MRM) with positive ionization mode, midazolam, 1‐OH‐M, 4‐OH‐M and 1‐OH‐MG were measured as [M+H]+ using the mass transitions 326.1/291.1, 342.1/168.1, 342.1/234.1 and 518.1/324.1, respectively. The lower limit of quantification was 4 μg l−1 for midazolam, 2 μg l−1 for 1‐OH‐M and 4‐OH‐M, and 8 μg l−1 for 1‐OH‐MG. The method was validated over a range of 4–1000 μg l−1 for midazolam and 2–500 μg l−1 for 1‐OH‐M and 4‐OH‐M, and 8–2000 μg l−1 for 1‐OH‐MG. The accuracies ranged from 94.3% to 104.7%. Intra‐day precision was below 8.2% and inter‐day precisions below 12.9%.
Population pharmacokinetic method
Pharmacokinetic analysis was conducted using nonlinear mixed effects modelling using NONMEM® version 7.2 (ICON Development Solutions, Ellicott City, MD), PsN® (version 4.4.8) and Pirana (version 2.9.2).
Base model development
The data were log‐transformed and concentrations of 1‐OH‐M and 1‐OH‐MG were adjusted to their midazolam equivalents using the molecular weight. Bioavailability of subcutaneous midazolam was assumed to be 100% 22. One‐, two‐ and three‐compartment models were tested for midazolam and its metabolites using the first‐order conditional estimation method with interaction (FOCE+I) and the ADVAN7 subroutine. First a structural model for midazolam was developed. These parameters were then fixed to test the different structural models for 1‐OH‐M and 1‐OH‐MG. The volume of distribution (V) of 1‐OH‐M was assumed to be equal to the volume of distribution of midazolam. IIV was assessed on each parameter using an exponential model. Residual variability was tested as additive, proportional and combined error models. Since the parent and metabolite concentrations were measured in the same samples using a single assay, a correlation between the residual errors was incorporated in the model. Model selection was based on minimum objective function value (OFV) parameter precision, error estimates, shrinkage values and visual inspection of the goodness of fit plots.
Covariate model development
Demographic and disease characteristics including age, gender, race, primary diagnosis, renal function (estimated glomerular filtration rate (eGFR), plasma creatinine, and plasma urea), hepatic function (plasma levels of bilirubin, GGT, ALP, ALT, and AST), C‐reactive protein (CRP), albumin and the concomitant use of CYP3A inductor and inhibitors were evaluated as potential model covariates. Time to death (TTD) was also evaluated as a covariate. This parameter cannot be used as a covariate parameter for a priori prediction of individual pharmacokinetic changes but it may give insight in quantitative changes at the end of life that are not predicted by standard blood chemistry tests. The relationship between covariates and individual estimates was first investigated graphically and was further tested in a univariate analysis. Covariates that significantly (P ≤ 0.05) improved the model were added to the full model. A backward elimination process was then performed with statistical significance indicated by P ≤ 0.001.
Continuous covariates were normalized to the population median values and incorporated as power model functions (eq. 1). Categorical covariates were transformed to binary covariates and incorporated as shown in eq. (2).
| (1) |
| (2) |
where θ i is the individual model predicted pharmacokinetic parameter (e.g. clearance) for an individual with covariate value cov i, θ pop is the population estimate for that parameter, cov m represents the median covariate value and θ cov the covariate effect. In the equation for categorical covariates cov i is either 1 or 0.
To evaluate the time to death (TTD) as a covariate, the time dependency of the parameters was modelled as a first‐order process given by:
| (3) |
where θ Δ is the change in parameter value from its initial value and θ rate is a first‐order rate constant determining the rate at which the parameter value changes over time. θ rate was not constrained to be positive or negative so, although physiologically unlikely, an increase in time was also possible.
Model evaluation
A bootstrap with 200 runs was performed on the final model to evaluate the validity of the parameter estimates and their corresponding 95% confidence intervals (CIs). Due to the study design, i.e. sparse sampling, different dosing regimens and both oral and subcutaneous administrations, a visual predictive check could not be performed to evaluate the model. We therefore evaluated the predictive performance of the final model using a normalized prediction distribution errors (NPDE) analysis. This simulation‐based analysis can be used to evaluate models developed on datasets with variable dosing regimens. The analytical value of this method has been described previously by Comets et al. 23.
Simulations
To illustrate the effect of the significant covariates found in the covariate analysis, deterministic simulations were performed. The plasma concentrations of midazolam, 1‐OH‐M and 1‐OH‐MG were simulated over a time course of 72 h after the administration of a 10 mg midazolam loading dose followed by 5 mg midazolam six times daily via subcutaneous bolus injection. To simulate the plasma concentration in the typical patient, the IIV and residual error were set to zero.
Results
A total of 45 terminally ill patients were included in the study. Their median age was 71 years (range 43–93), 51.1% were female and the median duration of admittance (from moment of admittance until time of death) was 29 days (range 7–457). All but one patient (97.8%) had advanced malignancy as primary diagnosis. Patient characteristics are given in Table 1. Oral midazolam was administered as a 7.5 mg dose up to four times daily. The subcutaneous doses used were between 2.5 and 180 mg a day. A total of 139 blood samples were collected which were analysed for midazolam, 1‐OH‐M, 4‐OH‐M and 1‐OH‐MG concentrations. Figure 1 gives the plasma concentration–time profiles of a representative patient in the last week before death.
Table 1.
Patient characteristics over the time course of the study
| Characteristics | n = 45 |
|---|---|
| Age, years (median, range) | 71 (43–93) |
| Male, n (%) | 22 (48.9) |
| Female, n (%) | 23 (51.1) |
| Ethnic origin, n (%) | |
| Caucasian | 41 (91.1) |
| Afro‐Caribbean | 3 (6.7) |
| Unknown | 1 (2.2) |
| Primary diagnosis, n (%) | |
| Neoplasm | 44 (97.8) |
| Disease of the respiratory system | 1 (2.1) |
| Blood chemistry, serum levels at admission (median, range) | |
| Albumin, g l−1 | 25 (13–39) |
| Urea, mmol l−1 | 7.6 (1.5–66.9) |
| Bilirubin, μmol l−1 | 9 (2–256) |
| Gamma‐glytamyl transpeptidase, U l−1 | 62 (7–3859) |
| Alkaline phosphatase, U l−1 | 118 (20–2371) |
| Alanine transaminase, U l−1 | 14 (7–632) |
| Aspartate transaminase, U l−1 | 30 (13–2710) |
| C‐reactive protein, U l−1 | 92 (1–625) |
| Creatinine, μmol l−1 | 67 (20–806) |
| eGFR by standard MDRDa, ml min−1/1.73 m−2 | 104 (6–328) |
| eGFR by original MDRDb, ml min−1/1.73 m−2 | 85 (4–228) |
| Patients using dexamethasone c , n (%) | 17 (37.8) |
| Patients using phenytoin c , n (%) | 1 (2.2) |
| Duration of stay, days (median, range) | 29 (7–457) |
| Blood samples collected, n (median, range) | 2 (1–10) |
eGFR: estimated glomerular filtration rate, MDRD: modification of diet in renal disease.
The abbreviated MDRD equation consists of four variables (age, gender, race and serum creatinine) as shown in eq. (4).
The original MDRD formula consist of six variables (age, gender, race, serum creatinine, serum albumin and serum urea) as shown in eq. (5).
During any time while receiving midazolam treatment.
Figure 1.

Dose and concentration data of a patient representative for the study population in the last week before death. Top: Time profile of the estimated glomerular filtration rate (eGFR) (green) and albumin levels (blue) and the 5 mg subcutaneous midazolam doses (orange) over time in the last week before death. Bottom: Post‐hoc predictions of concentration of midazolam (green), 1‐OH‐M (blue) and 1‐OH‐MG (orange) and their corresponding measured midazolam concentrations (open circles) in the last week before death. The concentrations of both metabolites are shown as the therapeutic equivalents of midazolam, so 1‐OH‐M concentrations are multiplied by 0.8 and 1‐OH‐MG by 0.1
Structural model
The percentage of concentrations below the quantification limit (BQL) were 14%, 16% and 10% for midazolam, 1‐OH‐M and 1‐OH‐MG, respectively. More than half of these BQL concentrations where measured in samples taken more than 3 days after the last midazolam dose and 92% of these BQL concentrations were measured in samples taken more than 12 h after the last dose. As a result midazolam, 1‐OH‐M and in most cases also 1‐OH‐MG were no longer detectable. The BQL data were therefore discarded using the M1 method discussed previously by Ahn et al. 24. The amount of BQL data of 4‐OH‐M was 75% and as data on 4‐hydroxy‐midazolam‐glucuronide were lacking, this metabolite was not incorporated in the pharmacokinetic model.
The data were best described by a one‐compartment model for midazolam and two one‐compartment models for both its metabolites (1‐OH‐M and 1‐OH‐MG) (Figure 2, Table 2) with an additive residual error on logarithmic transformed concentrations. As there was limited data available in the absorption phase, the absorption constants (Ka) could not be estimated. They were therefore derived from literature (5.5 h−1 for oral administration, 10 h−1 for subcutaneous injection) 16, 22, 25. IIV was included on midazolam clearance, F of oral midazolam, V of midazolam, 1‐OH‐M clearance and 1‐OH‐MG clearance as all of these significantly improved the model. The correlation between IIV of midazolam clearance and F of oral midazolam was high (0.93) and therefore fixed to unity. In all cases an exponential model for IIV proved superior to an additive model.
Figure 2.

Schematic representation of the structural model for midazolam and its two main metabolites. F: bioavailability of oral midazolam; Cl1: midazolam clearance and formation of 1‐OH‐M; Cl2: 1‐OH‐M clearance and formation of 1‐OH‐MG; Cl3: 1‐OH‐MG clearance
Table 2.
Parameter estimates of the base model, final model and bootstrap analysis
| Parameter | Structural model | Final model | RSE % | Shrinkage % | Bootstrap of the final model | ||
|---|---|---|---|---|---|---|---|
| Average | 95% CI (lower) | 95% CI (upper) | |||||
| OFV | −109.113 | −146.519 | |||||
| Midazolam | |||||||
| F | 0.204 | 0.279 | 12.6 | — | 0.288 | 0.227 | 0.857 |
| Cl (l h−1) | 7.76 | 8.42 | 9.0 | — | 8.52 | 7.18 | 10.4 |
| V (l) | 117 | 113 | 13.1 | — | 111 | 84.0 | 137 |
| 1‐OH‐Midazolam (1‐OH‐M) a | |||||||
| Cl (l h−1) | 43.8 | 45.4 | 11.5 | — | 46.0 | 36.8 | 60.4 |
| 1‐OH‐Midazolam glucuronide (1‐OH‐MG) | |||||||
| Cl (l h−1) | 3.82 | 5.10 | 11.0 | — | 5.18 | 4.08 | 6.50 |
| V (l) | 3.47 | 2.98 | 71.5 | — | 2.97 | 0.85 | 13.7 |
| Covariate effect midazolam clearance | |||||||
| Albumin | — | 1.08 | 21.2 | — | 1.02 | 0.38 | 1.47 |
| Covariate effect on 1OH‐midazolam glucuronide clearance | |||||||
| eGFR b | — | 0.53 | 20.7 | — | 0.52 | 0.31 | 0.82 |
| IIV (%) | |||||||
| F | 48.7% | 50.6% | 17.4 | 12.8 | 48.4% | 32.0% | 61.3% |
| Midazolam Cl | 59.9% | 49.0% | 14.0 | 12.8 | 47.5% | 31.4% | 60.2% |
| Midazolam V | 72.6% | 70.9% | 15.1 | 16.6 | 70.2% | 46.9% | 93.2% |
| 1‐OH‐M Cl | 55.4% | 60.5% | 18.0 | 12.2 | 58.0% | 32.8% | 79.6% |
| 1‐OH‐MG Cl | 69.4% | 49.9% | 23.1 | 23.0 | 49.0% | 26.7% | 73.4% |
| Residual variability | |||||||
| Midazolam | 26.7% | 26.8% | 13.3 | 20.4 | 26.8% | 21.3% | 34.2% |
| 1‐OH‐M | 42.7% | 42.3% | 21.6 | 18.5 | 41.3% | 21.7% | 56.7% |
| 1‐OH‐MG | 48.4% | 46.4% | 13.1 | 18.6 | 44.4% | 30.1% | 55.2% |
OFV: objective function value, F: bioavailability, CL: clearance, V: volume of distribution, eGFR: estimated glomerular filtration rate, MDRD: modification of diet in renal disease, 1‐OH‐M: 1OH‐midazolam, 1‐OH‐MG: 1OH‐midazolam‐glucuronide.
The volume of distribution of 1‐OH‐M was set equal to that of midazolam itself.
GFR was estimated using the standard four‐variable MDRD equation.
Covariate analysis
In the covariate analysis all possible covariates, as mentioned in the methods section, were tested on all parameters including IIV (F, V of midazolam and clearance of midazolam, 1‐OH‐M and 1‐OH‐MG). This univariate analysis with a significance threshold of 0.05 resulted in 16 significant covariates. After backward elimination with a lower threshold of 0.001, only two covariates remained in the final model. The first covariate was estimated glomular filtration rate (eGFR) on 1‐OH‐MG clearance (eq. 4), and the second covariate was the correlation of albumin on midazolam clearance (eq. 5). CRP levels were also correlated with midazolam clearance, and depending on the order of the backwards elimination, either albumin or CRP remained in the final model. As the difference in these OFV between albumin and CRP was minimal, the decision to include albumin instead of CRP was based on the fact that albumin is a more specific marker for overall condition than CRP. The results of the univariate analysis, in terms of decrease in OFV and covariate effect are shown in Table 3. The addition of albumin on midazolam clearance reduced the IIV from 59.9% to 49.0%, thus explaining 18.2% of the IIV on midazolam clearance. Incorporation of eGFR as a covariate on 1‐OH‐MG clearance reduced the IIV from 69.7% to 49.9%, thereby explaining 28.4% of the IIV on 1‐OH‐MG clearance.
Table 3.
Covariate effects in univariate analysis compared to the structural model
| ΔOFV | Covariate effect | Included after backward elimination | |
|---|---|---|---|
| Covariates on midazolam clearance | |||
| Serum albumin | −7.54 | 0.84 | Yes |
| CRP | −7.51 | −0.12 | No |
| AST | −4.73 | −0.16 | No |
| Time to death a | −4.69 | 2.29 and 0.05 | No |
| Covariates on midazolam volume of distribution | |||
| ALT | −6.29 | 0.22 | |
| AST | −9.06 | 0.22 | No |
| Weight | −4.73 | 1.52 | No |
| Dexamethasone use b | −4.56 | 1.67 | No |
| Time to death a | −6.50 | −71.6 and 0.05 | No |
| Covariates on 1‐OH‐M clearance | |||
| ‐b c | −3.86 | −0.21 | No |
| CRP | −10.18 | 0.19 | No |
| Covariates on 1‐OH‐MG clearance | |||
| Serum creatinine | −17.20 | −0.50 | No |
| eGFR‐a c | −20.92 | 0.47 | Yes |
| eGFR‐b c | −22.49 | 0.49 | No |
| Serum urea | −19.74 | −0.53 | No |
| Time to death a | −15.25 | 4.21 and 0.11 | No |
CRP: C‐reactive protein, AST: aspartate transaminase, ALT: alanine transaminase, eGFR: estimated glomerular filtration rate
Time to death was incorporated as a covariate as a first‐order process, therefore the first mentioned value describes the total change in the parameter value (ΔTTD) and the second value the rate in days (see eq. 3).
Dexamethasone use was defined as the use of dexamethasone for at least 2 days, no longer than 7 days ago.
The glomular filtration rate was calculated using both the standard four‐variable MDRD equation (eGFR‐a) and the original six‐variable MDRD (eGFR‐b).
| (4) |
| (5) |
In the final model the population mean estimates for clearance were 8.42 l h−1 (RSE 9%) for midazolam; 45.4 l h−1 (RSE 12%) for 1‐OH‐M and 5.1 l h−1 (RSE 11%) for 1‐OH‐MG. The population mean estimates for volume of distribution were 113 l (RSE 13%) for midazolam and 1‐OH‐M compartments (which were assumed to be equal) and 2.98 l (RSE 71%) for the 1‐OH‐MG compartment. The bioavailability (F) of oral midazolam was 27.9%. An overview of all parameter estimates is given in Table 2.
Model evaluation
Figure 3A–F shows that both the population predictions and individual predictions were evenly distributed around the line of unity when plotted against the observations. A bootstrap analysis of the final model was performed to obtain 95% CIs for all parameters. Results of the bootstrap are shown in Table 3. Evaluation of the predictive performance by NPDE analysis showed accurate predictive ability, with the distribution of the NPDEs not deviating significantly from a normal distribution (with global adjusted P‐values of 0.75, 0.20 and 0.41 for midazolam, 1‐OH‐M and 1OH‐MG, respectively), and the majority of the NPDEs having values between −2 and 2 (Figure 3G–I).
Figure 3.
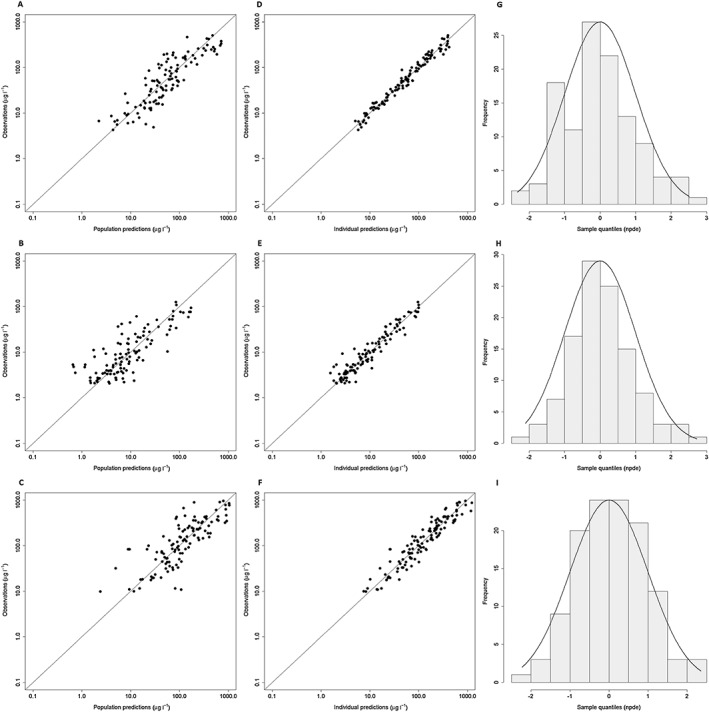
Goodness of fit plots of the final model. Population predictions vs. observations of midazolam (A), 1‐OH‐M (B) and 1‐OH‐MG (C) and individual predictions vs. observations of midazolam (D), 1‐OH‐M (E) and 1‐OH‐MG (F) with the solid line displaying the line of unity. Normalized prediction distribution error (NPDE) plots for midazolam (G), 1‐OH‐M (H) and 1‐OH‐MG (I) showing NPDE quantiles (grey bars) vs. a normal distribution (solid line)
Simulations
Based on the final model, the midazolam clearance is reduced by 30% (from 12.1 l h−1 to 8.4 l h−1) when albumin decreases from 35 g l−1 to 25 g l−1. A further decrease in albumin to 15 g l−1 decreases midazolam clearance by another 42% to a value of 4.8 l h−1. The effect of this drop in midazolam clearance on midazolam and metabolite concentrations is shown in Figure 4. The effect of eGFR on 1‐OH‐MG clearance in our final model results in a reduction in clearance of 27% (from 4.7 l h−1 to 3.5 l h−1) when eGFR decreases from 90 to 50 ml min−1. A further decline in eGFR to 30 ml min−1 reduces the 1‐OH‐MG clearance by another 24% to 2.7 l h−1. The effect of this decrease in clearance on the plasma concentrations is shown in Figure 5.
Figure 4.

Simulated plasma profiles of midazolam and the total effective concentration (calculated as the sum of parent and both metabolites with 1‐OH‐M accounting for 80% and 1‐OH‐MG for 10% of the midazolam potency) for patients with plasma albumin levels of 15 g l−1 (green), 25 g l−1 (blue), and 35 g l−1 (orange) and stable eGFR of 90 ml min−1. After a 10 mg midazolam loading dose followed by 5 mg six times daily all via subcutaneous bolus injection
Figure 5.

Simulated plasma profiles of midazolam and the total effective concentration (calculated as the sum of parent and both metabolites with 1‐OH‐M accounting for 80% and 1‐OH‐MG for 10% of the midazolam potency) for patients with an estimated glomerular filtration rate (eGFR) of 10 ml min−1 (green), 30 ml min−1 (blue), 60 ml min−1 (orange) and 90 ml min−1 (light green) and stable plasma albumin levels of 25 g l−1. After a 10 mg midazolam loading dose followed by 5 mg six times daily all via subcutaneous bolus injection
Discussion
To our knowledge, this is the first population pharmacokinetic study of midazolam and its metabolites in terminally ill adult patients. With sparse sampling we were able to accurately describe the pharmacokinetics of midazolam, 1‐OH‐M and 1‐OH‐MG. The large IIV in pharmacokinetics may contribute to the large inter‐patient difference in sedation in clinical practice. About one‐third of the IIV in 1‐OH‐MG clearance could be explained by incorporating eGFR as a covariate in the model, confirming that 1‐OH‐MG clearance declined as a result of renal insufficiency. We also observed a positive correlation between albumin levels and midazolam clearance, explaining 18.2% of the IIV on midazolam clearance. These are important findings as these patient characteristics may be used to develop an individualized dosing regimen.
A positive correlation between albumin levels and midazolam clearance (with low albumin levels relating to a decrease in clearance) has been described before in the 1980s by Vree et al. 26. It was suggested that this reduced clearance was a result of decreased protein binding. Although midazolam is indeed highly protein bound (95–98%) primarily to albumin 27, 28, it seems unlikely that protein binding is the cause of the decreased clearance shown in our study when we take into account the following equation for clearance:
| (6) |
Based on this equation, a decrease in albumin, which would increase the unbound drug concentration (Fu), would result in either an unchanged or increased clearance, depending on the extraction ratio of the drug 29, 30. With an increase in Fu, an increase in volume of distribution would also be expected. This was, however, not the case as albumin was not found to be a significant covariate on volume of distribution in our study (ΔOFV = 0.014), further contradicting an effect via protein binding.
We therefore propose that the mechanism behind the reduced clearance may be due to an underlying inflammatory response or catabolic state. In cancer patients, hypoalbuminaemia can be an expression of inflammation and it has already been shown that inflammation can result in reduced CYP3A activity 19, 20, 31, 32, 33. Furthermore, albumin levels showed some correlation (r = −0.69) with CRP levels (Figure S1 supplementary material), and in the univariate covariate analysis CRP also showed a correlation with midazolam clearance, supporting our theory of an underlying common process. Albumin and not CRP was incorporated in the model, because in terminally ill patients albumin is a more pronounced marker of overall condition and more commonly used in clinical practice 34, 35. In addition, albumin does not fluctuate as much as CRP, which makes it a better candidate for a future dosing regimen. Whether albumin is also a better marker for CYP3A clearance in other populations remains unclear. It might be that albumin has a better correlation with CYP3A activity in this population as it is sign of a prolonged inflammatory/catabolic state, whereas CRP is more an expression of an acute process. To determine whether albumin, CRP or possibly another inflammatory marker is the best indicator for CYP3A activity, more research is needed. The correlation between midazolam clearance and inflammation is clinically important as inflammation plays a crucial role in cancer and the CYP3A enzyme metabolizes not only midazolam but more than 50% of all therapeutic drugs 36, 37.
Our study also showed that eGFR was correlated with 1‐OH‐MG clearance. This correlation is a result of the fact that 1‐OH‐MG is excreted renally. It is relevant in the terminally ill population as renal insufficiency is common and, although 1‐OH‐MG is only 10% as potent as midazolam itself, high concentrations can lead to increased sedation 7. As shown in Figure 5, an eGFR of 50 ml min−1 can already contribute significantly to the sedative effect of midazolam. Midazolam is believed to be sedative from concentrations of 100 μg l−1 and upwards and as 1‐OH‐MG has a potency of around 10%, 1‐OH‐MG concentrations of 500 μg l−1, which were also seen in our study, already contribute to half of the sedative effect. However, it is important to note that the method to estimate the globular filtration rate probably overestimates the renal function in terminally ill patients as it is dependent on the creatinine production from muscle tissue. Our study tested eGFR calculated by the four‐variable modification of diet in renal disease (MDRD) (eq. 7) as well as eGFR calculated by the original six‐variable equation (eq. 8) as a covariate 38. As the difference between the two was minimal, we incorporated the simpler four‐variable equation in our final model as this is the most commonly used equation.
| (7) |
| (8) |
Our finding for midazolam clearance (population mean: 8.42 l h−1) is in agreement with previous studies in critically ill patients 39, 40. It is also comparable to the estimated clearance found in a recent study in critically ill children where they also found an effect of inflammation (to compare these values, the results of Vet et al. were adapted to values for a 70 kg individual) 32. In our model, a patient with a healthy albumin level of 45 g l−1 would have a midazolam clearance of 15.3 l h−1, which is also in line with the results of other studies in healthy volunteers and obese patients 16, 25, 41, although some studies in obese patients and patients who had undergone bariatric surgery have even higher clearance values 25, 42. The estimated value for volume of distribution is also similar to that of the studies in critically ill patients and that of the most recent study in obese patients 32, 39, 42. However, unlike some of the other studies, we were not able to accurately quantify a peripheral compartment for midazolam. This is due to the sparse sampling in this study which has presumably resulted in insufficient data to quantify a two‐compartment model. Another contrast with previous studies is the lower estimate for the volume of distribution of 1‐OH‐MG, of 2.98 l. As 1‐OH‐MG is a hydrophilic metabolite, a low volume of distribution was expected. In terminally ill patients this could be even more reduced as these patients are older (median age of 71), have a diminished intake of oral fluids and become dehydrated. The high RSE of 71% for this parameter, however, indicates that it was difficult to obtain and accurate estimate of the V of 1‐OH‐MG. This is probably because patients without renal insufficiency eliminate 1‐OH‐MG more rapidly.
Finally, a notable difference with previous studies is the large IIV in volume of distribution of midazolam in the final model. Other studies also found large IIV in their base models but were able to correct for this using weight as a covariate 16, 42. Unfortunately, in our study, data on weight was available for only 53% of the patients, and the weights that were available were only collected at time of admission. As a result, the plots showing the available data on weight vs. volume of distribution or the IIV on volume of distribution did seem to show a correlation (supplementary material). However, this effect was not significant in the covariate analysis. This lack of data on weight is a limitation in our study. We therefore highly recommend that in future pharmacokinetic studies in the terminally ill population, weight is monitored regularly.
A possible limitation of our study is that it did not include intravenously administered midazolam, as this route of administration is seldom used in palliative care. As a result, the bioavailability of subcutaneous midazolam could not be estimated and was assumed to be 100%. This seems reasonable and is in line with the study of Pecking et al. 22. However, in that study F was reported as 0.96 ± 0.14 so there is some uncertainty in this number, which could have had a small effect on the estimates for clearance and volume of midazolam.
Another possible limitation of our study was that we did not include the 4‐OH‐M metabolite in our model. We did measure 4‐OH‐M in our samples, but as only a low percentage of midazolam is converted into 4‐OH‐M, 75% of these concentrations were below the lower limit of detection. This lack of data meant that we were only able to estimate the fraction of midazolam that is metabolized into 4‐OH‐M (which was around 10%) but we were unable to accurately estimate a volume of distribution or clearance for 4‐OH‐M. As only a low percentage is converted into 4‐OH‐M and this metabolite has a lower affinity to the receptor compared to the 1‐OH‐M metabolite, this is probably of low clinical interest 43. As the 4‐OH‐M metabolite was not included in the model and the true fraction metabolized is unknown, the clearance and distribution volumes of the other metabolites are apparent values.
Overall this study shows that it is possible to accurately describe a drug's pharmacokinetics and find clinically relevant parameters for dose individualization using population pharmacokinetics in terminally ill patients. This is very important as large inter‐patient variability in these patients is of clinical concern and therefore more research is needed in this population. Using a population approach with sparse sampling minimizes the patient's burden, which is crucial in this vulnerable population. Concerning midazolam, we have shown that low albumin levels may indicate a decreased capacity to metabolize midazolam, possibly as a result of inflammatory response. This is of clinical importance as hypoalbuminaemia is common in both cancer patients and cachectic patients. Therefore the dose of midazolam (and possibly also other drugs that are metabolized via CYP3A) may have to be decreased in these patients. Another possible reason to adjust the midazolam dose might be a decrease in renal function, as in these patients the 1‐OH‐MG metabolite can accumulate. These important insights into the pharmacokinetics of midazolam and its metabolites in terminally ill patients may be a first step in explaining the different response to midazolam treatment. However, it is also known that there is a large variability in response to plasma levels 12, 13. Therefore, further studies on the pharmacodynamics in this population are needed before any firm conclusions can be drawn on dose adjustments.
Competing Interests
There are no competing interests to declare. No sources of funding were used in the preparation of this manuscript.
Supporting information
Figure S1 Correlation of albumin (g l−1) and CRP (mg l−1) with the corresponding linear regression line
Figure S2 Correlation of weight (the known weights at time of admission) vs. volume of distribution (V) of midazolam and the interindividual variability (IIV) on volume of distribution (V) of midazolam with the corresponding linear regression lines
Figure S3 Simulated plasma profiles of midazolam and the total effective concentration (calculated as the sum of parent and both metabolites with 1‐OH‐M accounting for 80% and 1‐OH‐MG for 10% of the midazolam potency) for patients with an C‐reactive protein (CRP) concentration of 1 mg l−1 (green), 50 mg l−1 (blue), 100 mg l−1 (orange) and 200 mg l−1 (light green) and stable eGFR of 90 ml min−1, after a 10 mg midazolam loading dose followed by 5 mg six times daily all via subcutaneous bolus injection
Franken, L. G. , Masman, A. D. , de Winter, B. C. M. , Baar, F. P. M. , Tibboel, D. , van Gelder, T. , Koch, B. C. P. , and Mathot, R. A. A. (2017) Hypoalbuminaemia and decreased midazolam clearance in terminally ill adult patients, an inflammatory effect?. Br J Clin Pharmacol, 83: 1701–1712. doi: 10.1111/bcp.13259.
References
- 1. Southan C, Sharman JL, Benson HE, Faccenda E, Pawson AJ, Alexander SP, et al. The IUPHAR/BPS Guide to PHARMACOLOGY in 2016: towards curated quantitative interactions between 1300 protein targets and 6000 ligands. Nucl Acids Res 2016; 44: D1054–D1068. [DOI] [PMC free article] [PubMed] [Google Scholar]
- 2. Alexander SPH, Fabbro D, Kelly E, Marrion N, Peters JA, Benson HE, et al. The Concise Guide to PHARMACOLOGY 2015/16: Enzymes. Br J Pharmacol 2015; 172: 6024–6109. [DOI] [PMC free article] [PubMed] [Google Scholar]
- 3. Lux MR, Protus BM, Kimbrel J, Grauer P. A survey of hospice and palliative care physicians regarding palliative sedation practices. Am J Hosp Palliat Care 2017; 34: 217–222. [DOI] [PubMed] [Google Scholar]
- 4. Masman AD, van Dijk M, Tibboel D, Baar FP, Mathot RA. Medication use during end‐of‐life care in a palliative care centre. Int J Clin Pharm 2015; 37: 767–775. [DOI] [PMC free article] [PubMed] [Google Scholar]
- 5. Cherny NI, Grp EGW. ESMO clinical practice guidelines for the management of refractory symptoms at the end of life and the use of palliative sedation. Ann Oncol 2014; 25: 143–152. [DOI] [PubMed] [Google Scholar]
- 6. Verhagen EH, de Graeff A, Verhagen CAHHVM, Hesselmann, GM , van Wijlick, EHJ . Palliative sedation: nationwide guideline, version 2.0. Integraal Kanker Centrum Nederland, 2009.
- 7. Bauer TM, Ritz R, Haberthur C, Ha HR, Hunkeler W, Sleight AJ, et al. Prolonged sedation due to accumulation of conjugated metabolites of midazolam. Lancet 1995; 346: 145–147. [DOI] [PubMed] [Google Scholar]
- 8. Ziegler WH, Schalch E, Leishman B, Eckert M. Comparison of the effects of intravenously administered midazolam, triazolam and their hydroxy metabolites. Br J Clin Pharmacol 1983; 16 (Suppl 1): 63S–69S. [DOI] [PMC free article] [PubMed] [Google Scholar]
- 9. Mandema JW, Tuk B, van Steveninck AL, Breimer DD, Cohen AF, Danhof M. Pharmacokinetic‐pharmacodynamic modeling of the central nervous system effects of midazolam and its main metabolite alpha‐hydroxymidazolam in healthy volunteers. Clin Pharmacol Ther 1992; 51: 715–728. [DOI] [PubMed] [Google Scholar]
- 10. Seo KA, Bae SK, Choi YK, Choi CS, Liu KH, Shin JG. Metabolism of 1′‐ and 4‐hydroxymidazolam by glucuronide conjugation is largely mediated by UDP‐glucuronosyltransferases 1A4, 2B4, and 2B7. Drug Metab Dispos 2010; 38: 2007–2013. [DOI] [PubMed] [Google Scholar]
- 11. Morita T, Chinone Y, Ikenaga M, Miyoshi M, Nakaho T, Nishitateno K, et al. Efficacy and safety of palliative sedation therapy: a multicenter, prospective, observational study conducted on specialized palliative care units in Japan. J Pain Symptom Manage 2005; 30: 320–328. [DOI] [PubMed] [Google Scholar]
- 12. Oldenhof H, de Jong M, Steenhoek A, Janknegt R. Clinical pharmacokinetics of midazolam in intensive care patients, a wide interpatient variability? Clin Pharmacol Ther 1988; 43: 263–269. [DOI] [PubMed] [Google Scholar]
- 13. Bleasel MD, Peterson GM, Dunne PF. Plasma concentrations of midazolam during continuous subcutaneous administration in palliative care. Palliat Med 1994; 8: 231–236. [DOI] [PubMed] [Google Scholar]
- 14. Bastiaans DE, Swart EL, van Akkeren JP, Derijks LJ. Pharmacokinetics of midazolam in resuscitated patients treated with moderate hypothermia. Int J Clin Pharm 2013; 35: 210–216. [DOI] [PubMed] [Google Scholar]
- 15. Boulieu R, Lehmann B, Salord F, Fisher C, Morlet D. Pharmacokinetics of midazolam and its main metabolite 1‐hydroxymidazolam in intensive care patients. Eur J Drug Metab Pharmacokinet 1998; 23: 255–258. [DOI] [PubMed] [Google Scholar]
- 16. Brill MJ, van Rongen A, Houwink AP, Burggraaf J, van Ramshorst B, Wiezer RJ, et al. Midazolam pharmacokinetics in morbidly obese patients following semi‐simultaneous oral and intravenous administration: a comparison with healthy volunteers. Clin Pharmacokinet 2014; 53: 931–941. [DOI] [PMC free article] [PubMed] [Google Scholar]
- 17. Franken LG, de Winter BC, van Esch HJ, van Zuylen L, Baar FP, Tibboel D, et al. Pharmacokinetic considerations and recommendations in palliative care, with focus on morphine, midazolam and haloperidol. Expert Opin Drug Metab Toxicol 2016; 12: 669–680. [DOI] [PubMed] [Google Scholar]
- 18. Franken LG, Masman AD, de Winter BC, Koch BC, Baar FP, Tibboel D, et al. Pharmacokinetics of morphine, morphine‐3‐glucuronide and morphine‐6‐glucuronide in terminally ill adult patients. Clin Pharmacokinet 2016; 55: 697–709. [DOI] [PMC free article] [PubMed] [Google Scholar]
- 19. Slaviero KA, Clarke SJ, Rivory LP. Inflammatory response: an unrecognised source of variability in the pharmacokinetics and pharmacodynamics of cancer chemotherapy. Lancet Oncol 2003; 4: 224–232. [DOI] [PubMed] [Google Scholar]
- 20. Harvey RD, Morgan ET. Cancer, inflammation, and therapy: effects on cytochrome p450‐mediated drug metabolism and implications for novel immunotherapeutic agents. Clin Pharmacol Ther 2014; 96: 449–457. [DOI] [PubMed] [Google Scholar]
- 21. Ellershaw J, Ward C. Care of the dying patient: the last hours or days of life. BMJ 2003; 326: 30–34. [PMC free article] [PubMed] [Google Scholar]
- 22. Pecking M, Montestruc F, Marquet P, Wodey E, Homery MC, Dostert P. Absolute bioavailability of midazolam after subcutaneous administration to healthy volunteers. Br J Clin Pharmacol 2002; 54: 357–362. [DOI] [PMC free article] [PubMed] [Google Scholar]
- 23. Comets E, Brendel K, Mentre F. Computing normalised prediction distribution errors to evaluate nonlinear mixed‐effect models: the npde add‐on package for R. Comput Methods Programs Biomed 2008; 90: 154–166. [DOI] [PubMed] [Google Scholar]
- 24. Ahn JE, Karlsson MO, Dunne A, Ludden TM. Likelihood based approaches to handling data below the quantification limit using NONMEM VI. J Pharmacokinet Pharmacodyn 2008; 35: 401–421. [DOI] [PubMed] [Google Scholar]
- 25. Brill MJ, van Rongen A, van Dongen EP, van Ramshorst B, Hazebroek EJ, Darwich AS, et al. The pharmacokinetics of the CYP3A substrate midazolam in morbidly obese patients before and one year after bariatric surgery. Pharm Res 2015; 32: 3927–3936. [DOI] [PMC free article] [PubMed] [Google Scholar]
- 26. Vree TB, Shimoda M, Driessen JJ, Guelen PJ, Janssen TJ, Termond EF, et al. Decreased plasma albumin concentration results in increased volume of distribution and decreased elimination of midazolam in intensive care patients. Clin Pharmacol Ther 1989; 46: 537–544. [DOI] [PubMed] [Google Scholar]
- 27. Dundee JW, Halliday NJ, Harper KW, Brogden RN. Midazolam: a review of its pharmacological properties and therapeutic use. Drugs 1984; 28: 519–543. [DOI] [PubMed] [Google Scholar]
- 28. Roche Netherlands BV . Dormicum: summary of product characteristics, 2015.
- 29. Benet LZ, Hoener BA. Changes in plasma protein binding have little clinical relevance. Clin Pharmacol Ther 2002; 71: 115–121. [DOI] [PubMed] [Google Scholar]
- 30. Rowland M, Tozer TN, Rowland M. Clinical pharmacokinetics and pharmacodynamics: concepts and applications. Philadelphia, PA: Wolters Kluwer Health/Lippincott William & Wilkins, 2011. [Google Scholar]
- 31. Rivory LP, Slaviero KA, Clarke SJ. Hepatic cytochrome P450 3A drug metabolism is reduced in cancer patients who have an acute‐phase response. Br J Cancer 2002; 87: 277–280. [DOI] [PMC free article] [PubMed] [Google Scholar]
- 32. Vet NJ, Brussee JM, de Hoog M, Mooij MG, Verlaat CW, Jerchel IS, et al., SKIC . Inflammation and organ failure severely affect midazolam clearance in critically ill children. Am J Respir Crit Care Med 2016; 194: 58–66. [DOI] [PubMed] [Google Scholar]
- 33. Matsunaga T, Maruyama M, Matsubara T, Nagata K, Yamazoe Y, Ohmori S. Mechanisms of CYP3A induction by glucocorticoids in human fetal liver cells. Drug Metab Pharmacokinet 2012; 27: 653–657. [DOI] [PubMed] [Google Scholar]
- 34. Vigano A, Bruera E, Jhangri GS, Newman SC, Fields AL, Suarez‐Almazor ME. Clinical survival predictors in patients with advanced cancer. Arch Intern Med 2000; 160: 861–868. [DOI] [PubMed] [Google Scholar]
- 35. Vigano A, Dorgan M, Buckingham J, Bruera E, Suarez‐Almazor ME. Survival prediction in terminal cancer patients: a systematic review of the medical literature. Palliat Med 2000; 14: 363–374. [DOI] [PubMed] [Google Scholar]
- 36. Coussens LM, Werb Z. Inflammation and cancer. Nature 2002; 420: 860–867. [DOI] [PMC free article] [PubMed] [Google Scholar]
- 37. Rendic S. Summary of information on human CYP enzymes: human P450 metabolism data. Drug Metab Rev 2002; 34: 83–448. [DOI] [PubMed] [Google Scholar]
- 38. Levey AS, Coresh J, Greene T, Stevens LA, Zhang YL, Hendriksen S, et al., Chronic Kidney Disease Epidemiology Collaboration . Using standardized serum creatinine values in the modification of diet in renal disease study equation for estimating glomerular filtration rate. Ann Intern Med 2006; 145: 247–254. [DOI] [PubMed] [Google Scholar]
- 39. Swart EL, de Jongh J, Zuideveld KP, Danhof M, Thijs LG, Strack van Schijndel RJ. Population pharmacokinetics of lorazepam and midazolam and their metabolites in intensive care patients on continuous venovenous hemofiltration. Am J Kidney Dis 2005; 45: 360–371. [DOI] [PubMed] [Google Scholar]
- 40. Swart EL, Zuideveld KP, de Jongh J, Danhof M, Thijs LG, Strack van Schijndel RJ. Comparative population pharmacokinetics of lorazepam and midazolam during long‐term continuous infusion in critically ill patients. Br J Clin Pharmacol 2004; 57: 135–145. [DOI] [PMC free article] [PubMed] [Google Scholar]
- 41. van Rongen A, Kervezee L, Brill M, van Meir H, den Hartigh J, Guchelaar HJ, et al. Population pharmacokinetic model characterizing 24‐hour variation in the pharmacokinetics of oral and intravenous midazolam in healthy volunteers. CPT Pharmacometrics Syst Pharmacol 2015; 4: 454–464. [DOI] [PMC free article] [PubMed] [Google Scholar]
- 42. van Rongen A, Vaughns JD, Moorthy GS, Barrett JS, Knibbe CA, van den Anker JN. Population pharmacokinetics of midazolam and its metabolites in overweight and obese adolescents. Br J Clin Pharmacol 2015; 80: 1185–1196. [DOI] [PMC free article] [PubMed] [Google Scholar]
- 43. Arendt RM, Greenblatt DJ, Liebisch DC, Luu MD, Paul SM. Determinants of benzodiazepine brain uptake: lipophilicity versus binding affinity. Psychopharmacology (Berl) 1987; 93: 72–76. [DOI] [PubMed] [Google Scholar]
Associated Data
This section collects any data citations, data availability statements, or supplementary materials included in this article.
Supplementary Materials
Figure S1 Correlation of albumin (g l−1) and CRP (mg l−1) with the corresponding linear regression line
Figure S2 Correlation of weight (the known weights at time of admission) vs. volume of distribution (V) of midazolam and the interindividual variability (IIV) on volume of distribution (V) of midazolam with the corresponding linear regression lines
Figure S3 Simulated plasma profiles of midazolam and the total effective concentration (calculated as the sum of parent and both metabolites with 1‐OH‐M accounting for 80% and 1‐OH‐MG for 10% of the midazolam potency) for patients with an C‐reactive protein (CRP) concentration of 1 mg l−1 (green), 50 mg l−1 (blue), 100 mg l−1 (orange) and 200 mg l−1 (light green) and stable eGFR of 90 ml min−1, after a 10 mg midazolam loading dose followed by 5 mg six times daily all via subcutaneous bolus injection