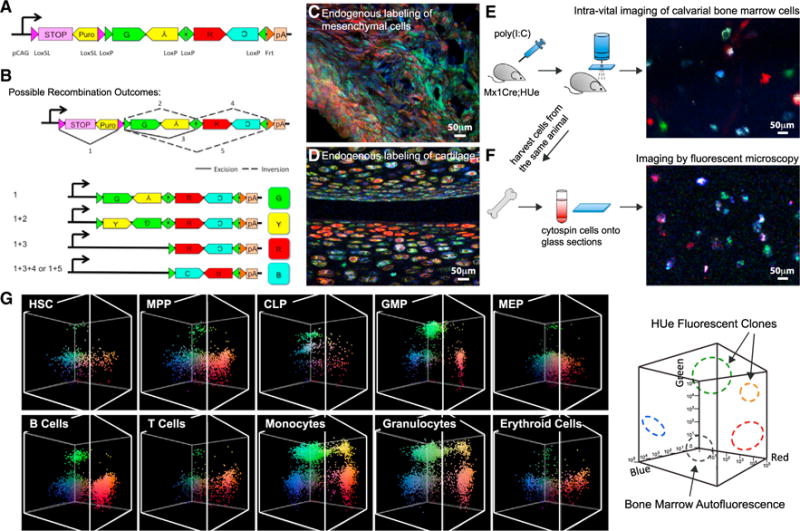
Figure 1. Endogenous Labeling of Individual Cells with Different Colors.

(A) HUe transgene construct contains GFP, EYFP, tDimer2, mCerulean fluorescent cDNAs arranged in tandem invertible segments flanked by four LoxP sites. A LoxP variant floxed STOP sequence was inserted in front of the fluorescent cassette, thereby prohibiting background fluorescence in the absence of Cre recombinase.
(B) Cre-mediated excision of the STOP sequence and random inversion or excision of the fluorescent cassette generates four possible color outcomes. Color complexity is further increased by insertion of multiple copies of transgene into the mouse genome. A HUe founder line with 20 copies of transgene inserted can have 103 color combinations.
(C) Testing the efficiency of expression of fluorescent proteins by crossing the HUe mice with different strains containing a Cre-driving promoter. When the HUe mouse was crossed to the limb mesenchyme-specific Prx1-CreER strain, we observed efficient endogenous labeling of cells in a fracture callus with various colors.
(D) Chondrocytes were labeled with color diversity when the HUe mouse was mated to a collagen-specific Cre driver, Col(II)-CreER.
(E) Hematopoietic cell labeling was assessed by crossing the Mx1-Cre strain with HUe (Mx1-Cre;HUe). When the Mx1-Cre;HUe mouse was given a pulse of pIpC, multi-colored hematopoietic cells within the calvarial cavity could be visualized using an intra-vital fluorescent microscopy system.
(F) Bone marrow cells of the same animal could be extracted and re-visualized on glass sections with fluorescent confocal microscopy.
(G) Clonal quantification of hematopoietic sub-compartments. Flow cytometry can identify and isolate hematopoietic stem cells (HSCs), progenitor cells: multipotent progenitors (MPPs), common lymphoid progenitors (CLPs), granulocyte macrophage progenitors (GMPs), megakaryocyte erythroid progenitors (MEPs), and mature cells of different lineages: B cells, T cells, monocytes, granulocytes, and erythroid cells. Endogenous HUe fluorescence from these populations is shown in the 3D graphs with × axis(tDimer2, red fluorescence),y axis(Cerulean, blue fluorescence), and z axis(EYFP, green fluorescence) representing increasing fluorescent intensities in log scale. The panel shows that hematopoietic cells at all hierarchy can be identified and clones within each compartment can be isolated by flow cytometry.
See also Figures S1 and S2 and Table S1.
