Abstract
Objective:
To evaluate the role of exponential apparent diffusion coefficient (ADC) as a tool for differentiating benign and malignant breast lesions.
Patients and Methods:
This prospective observational study included 88 breast lesions in 77 patients (between 18 and 85 years of age) who underwent 3T breast magnetic resonance imaging (MRI) including diffusion-weighted imaging (DWI) using b-values of 0 and 800 s/mm2 before biopsy. Mean exponential ADC and ADC of benign and malignant lesions obtained from DWI were compared. Receiver operating characteristics (ROC) curve analysis was undertaken to identify any cut-off for exponential ADC and ADC to predict malignancy. P value of <0.05 was considered statistically significant. Histopathology was taken as the gold standard.
Results:
According to histopathology, 65 lesions were malignant and 23 were benign. The mean ADC and exponential ADC values of malignant lesions were 0.9526 ± 0.203 × 10⁻³ mm2/s and 0.4774 ± 0.071, respectively, and for benign lesions were 1.48 ± 0.4903 × 10⁻³ mm2/s and 0.317 ± 0.1152, respectively. For both the parameters, differences were highly significant (P < 0.001). Cut-off value of ≤0.0011 mm2/s (P < 0.0001) for ADC provided 92.3% sensitivity and 73.9% specificity, whereas with an exponential ADC cut-off value of >0.4 (P < 0.0001) for malignant lesions, 93.9% sensitivity and 82.6% specificity was obtained. The performance of ADC and exponential ADC in distinguishing benign and malignant breast lesions based on respective cut-offs was comparable (P = 0.109).
Conclusion:
Exponential ADC can be used as a quantitative adjunct tool for characterizing breast lesions with comparable sensitivity and specificity as that of ADC.
Keywords: Apparent diffusion coefficient, breast MRI, diffusion-weighted imaging, exponential apparent diffusion coefficient
Introduction
High field strength (3T) magnetic resonance imaging (MRI) is now increasingly being used for detection and diagnosis of breast lesions due to its better spatial resolution, higher signal-to-noise ratio (SNR), and shorter image acquisition time.[1] Though dynamic contrast-enhanced MRI (DCE-MRI) has high sensitivity, its relative low specificity and low positive predictive value in distinguishing malignant and benign breast lesions causes unnecessary biopsies.[2] Diffusion-weighted imaging (DWI) is a noncontrast, functional MRI sequence that has shown promise in increasing DCE-MRI specificity.[3,4]
DWI is a fat-saturated T2-weighted spin echo prepared echo planar image sequence with diffusion gradients applied before and after the 180 degree pulse.[3] DWI may be acquired for several (minimum of two) b values, where b determines the degree of diffusion weighting; apparent diffusion coefficient (ADC) is then calculated by using the formula “S = S0 × exp(–b × ADC)” where S is the signal intensity after application of the diffusion gradient and S0 is the signal intensity on the diffusion image acquired at b = 0 s/mm2.[5,6] At low b-value, the contribution of perfusion to the ADC is higher than diffusion effects.[7,8] At higher b-values, only diffusion effect remains, increased contrast resolution is achieved but at the expense of SNR.[3,8,9]
DWI measures the water molecules mobility (Brownian motion) in vivo on unenhanced MRI sequences and noninvasively evaluates tissue biophysical characteristics such as cell density, membrane integrity, and extracellular matrix composition.[10] The image contrast in DWI is determined by the random microscopic motion of the water molecules with low diffusibility of water molecules corresponding to lower signal loss and hyperintense areas; high diffusion corresponds to a higher signal loss and hypointense areas.[11] However, the signal intensity of DWI is also influenced by the intrinsic T2 properties of the tissue being examined along with water diffusibility; therefore, benign lesions with high intrinsic T2 signal intensity can also appear bright on DWI because of the T2 “Shine-Through” effect.[12] This T2 shine-through effect can be eliminated by generating ADC map from two or more DWI sets and exponential ADC images which depends only on the diffusion of water molecules but also on T2 signal characteristics.[12] ADC is a quantitative measure directly proportional to water diffusion.[13] Increased cellular density in malignant lesions compared to benign lesions and normal breast tissue results in decreased space for extracellular water diffusion and renders these lesions hyperintense on DWI and hypointense on ADC maps.[9,10] The exponential ADC image is obtained on a workstation using the formula Sb/S0 = Exponential ADC = exp [−(b × ADC)], where b stands for the b value of the DWI sequence (i.e., b = 800 s/mm2 in our study), and Sb and S0 are the signal intensities on the diffusion-weighted image and the reference image, respectively.[12,14] In case of true diffusion restriction, the exponential ADC images retain the hyperintense signal as seen on DWI while T2 shine through images are isointense, thus improving tissue contrast and eliminating the T2 shine through effect.[12,14,15] DWI has its limitations too. It is more prone to susceptibility artefacts and image distortion making characterization of small lesions difficult.[2,4]
Our study aims to evaluate the role of exponential ADC as a tool for differentiating benign and malignant breast lesions.
Patients and Methods
Study population
This is a prospective observational study conducted in the Department of Radio-diagnosis in collaboration with the Department of General Surgery and Department of Pathology of IPGME and R-SSKM Hospital, Kolkata. The study was approved by the “Institutional Ethical Committee”. Seventy-seven women with 88 suspicious breast lesions who underwent MR mammogram in our hospital between January 2015 and May 2016 were included in the study.
Inclusion criteria
Female patients with suspicious breast lesions assessed by clinical/physical examination and/or ultrasonography and/or mammography.
Exclusion criteria
Less than 1 cm contrast enhancing masses
Previous or current neoadjuvant or radiation therapy
Previous interventional or surgical procedures in the 3 months preceding the examination
Male patients presenting with breast lumps
Patients without histopathological confirmation of the breast lesion
Patients who had general contraindications to MRI were excluded such as:
Patients having history of allergic manifestation to contrast or other drug
Patients with implanted cardiac pacemaker, aneurysm clips, cochlear, or other such devices contraindicated for MRI examination
Patients having claustrophobia
Unwillingness to be a part of the study.
All the patients signed a written informed consent form in their own local language followed by history taking and general and local examination. MRI was done during the second week of menstrual cycle for premenopausal women. MRI included both DCE and DWI sequences.
MRI acquisition and postprocessing
Bilateral breast MRI was performed using 3.0T MR (Signa HDx 3.0T, GE Medical Systems) with a dedicated 16-channel bilateral breast coil with patient in the prone position. Bilateral breast MRI was done using the following protocol – an axial T2 sequence (TR/TE 3300/85; slice thickness 4 mm without any interslice gap; field of view (FOV) 32 × 32; matrix size 288 × 256); an axial STIR sequence (TR/TE 3125/68; inversion time 175 ms; slice thickness 4 mm without any interslice gap; FOV 32 × 32; matrix size 288 × 192); echo planar imaging (EPI)-based DWI sequence in axial planes at b values of 0 and 800 s/mm2 (TR/TE 5825/minimum; slice thickness 4 mm; interslice gap 0; FOV 32 × 32 and matrix size 96 × 140; bandwidth 125 kHz; number of excitation 16; acquisition time 4–5 min depending on number of slices); an axial VIBRANT multiphase three-dimensional (3D) T1-weighted dynamic gradient-echo sequence obtained after 10 ml intravenous bolus injection of gadolinium DTPA at a rate of 2.5 ml/s followed by a 20-ml saline flush (flip angle 12°; slice thickness 2 mm with no interslice gap; FOV 36 × 36; matri × 320 × 320). Dynamic study comprised one precontrast and 7 postcontrast series, each phase lasting 1 min 21 s. Automated subtracted images were obtained for each of the seven phases. Kinetic curve assessment of the fastest enhancing component of the lesion or the most suspicious curve pattern in the lesion was assessed with the available software (Functool) in GE Workstation.
MRI interpretation
Lesions were assigned BI-RADS value based on DCE morphologic and kinetic curve features. DWI were obtained before DCE-MRI. A radiologist with 10 years of experience in MRI measured ADC and exponential ADC values. Region of interest (ROI) was placed on slice with the largest diameter showing the highest signal intensity on DWI image. ROI was automatically placed in the exponential ADC and ADC maps corresponding to the selected ROI in the DWI image by the “Functool” software. ROI did not include cystic, hemorrhagic, or necrotic areas. Size of ROI was not fixed and it varied according to the size of the area showing diffusion restriction. The ADC and exponential ADC values were calculated by the “Functool” software. The lesions showing varied ADC and Exponential ADC values, the lowest ADC and the corresponding exponential ADC value was taken into calculation.
Reference standard
All lesions with a MR BI-RADS category 3, 4, or 5 were ascertained with surgically excised specimen (n = 70) or with 14-gauge core needle biopsy under ultrasound (n = 18). Histopathological diagnosis was taken as the gold standard.
Statistical analysis
Data have been summarized as mean and standard deviation for numerical variables. Normality was tested by Kolmogorov–Smirnov goodness-of-fit test to a normal distribution, and age, ADC, and exponential ADC data showed normal distribution. They were compared between benign and malignant subgroups by Student's independent samples t-test. P < 0.05 was considered to be statistically significant. ROC curve analysis was undertaken to identify any cut-off for ADC or exponential ADC to predict malignancy. The performance of ADC and exponential ADC in distinguishing between benign and malignant breast lesions based on respective cut-offs were compared by Mc Nemar's Chi-square test. The extent of agreement between individual diagnostic parameters and the gold standard diagnosis of histopathology was estimated as Cohen's kappa with its 95% confidence interval. MedCalc version 11.6 (Mariakerke, Belgium: MedCalc Software 2011) and Statistica version 6 (Tulsa, Oklahoma: StatSoft Inc., 2001) software were used for the analysis.
Results
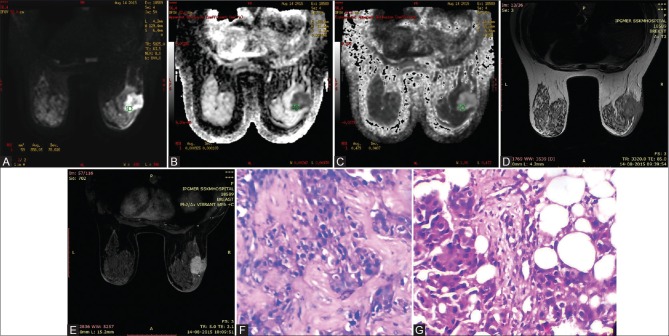
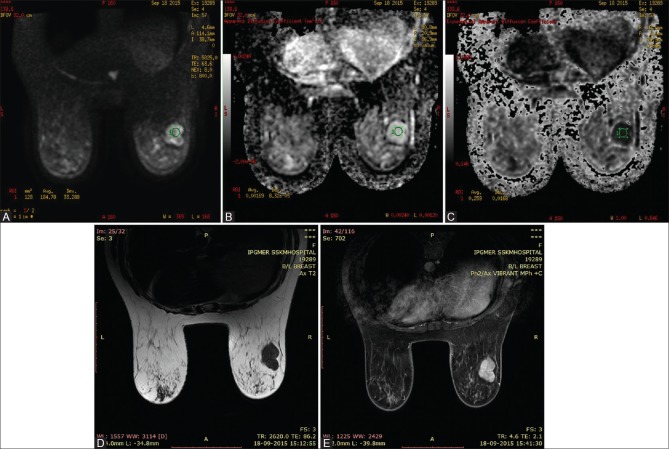
Seventy-seven women (between 18 and 85 years of age, mean age 67 years) with 88 breast lesions were included in the study, of which 65 were malignant and 23 were benign [Figure 1]. The mean age of women with malignant breast lesions was 48.1 years (age range 22–85 years; standard deviation 12.7) and for benign it was 36.2 years (age range 18–49 years; standard deviation 9.04). The mean size of ROI was 77.63 mm2 (range 46.8–118.4 mm2; standard deviation 19.42). According to the final histopathology the malignant lesions were – invasive ductal carcinoma (n = 47) [Figure 2], invasive ductal carcinoma with ductal carcinoma in situ (n = 3), inflammatory intraductal carcinoma (n = 8), pure mucinous carcinoma (n = 1), mixed mucinous carcinoma (n = 1), infiltrating lobular carcinoma (n = 1), invasive papillary carcinoma (n = 1), malignant phylloides (n = 1), and invasive metaplastic carcinoma (n = 2), while the benign lesions included fibroadenoma (n = 4), idiopathic granulomatous mastitis (n = 5), benign phylloides (n = 1), fibrocystic disease of breast (n = 4), fibroadenolipoma (n = 2), benign proliferative lesion (n = 1), ductal adenoma (n = 2), tubular adenoma (n = 1), hyalinized fibroadenoma (n = 1) [Figure 3], fibroadenosis with epitheliosis (n = 1), and intraductal papilloma (n = 1).
Figure 1.
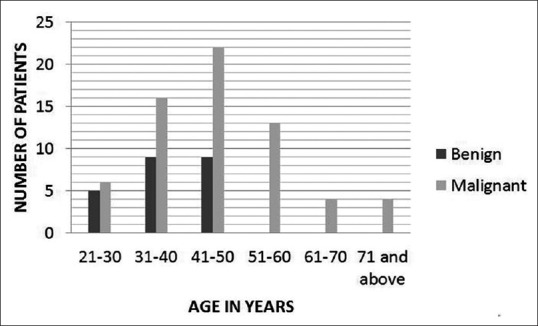
Bar chart showing distribution of benign and malignant breast lesions in different age groups
Figure 2(A-G).
40 year old woman with invasive ductal carcinoma in right breast. Axial DWI (b 800s/mm2) shows tumor as high signal intensity in both DWI and EXPONENTIAL ADC map images (A and C respectively) and low signal intensity in ADC map image (B). ADC and EXPONENTIAL ADC values were 0.000926mm2/s and 0.479 respectively. An irregularly marginated hypointense lesion is seen on T2WI (D) with heterogenous enhancement on post-contrast study (E). (F) (H&E 10×10) and (G) (H&E 40×10)-Section shows infiltration of stroma by cords and nests of pleomorphic malignant ductal cells
Figure 3(A-E).
37 year old woman with hyalinised fibroadenoma in right breast. Axial Diffusion-weighted imaging at b800 demonstrates high signal intensity in the right breast (A), high signal intensity on the corresponding ADC map (B) and low signal intensity in corresponding exponential ADC image (C), consistent with no diffusion restriction. The ADC and EXPONENTIAL ADC values were 0.00169mm2/s and 0.259 respectively. Axial T2 WI (D) shows a well defined hypointense lesion in the right breast. The lesion shows homogenous enhancement on post contrast study (E)
Statistically significant difference was observed between the mean exponential ADC and ADC values of benign and malignant lesions. The mean ADC and exponential ADC values of malignant lesions were 0.9526 ± 0.203 × 10⁻³ mm2/s and 0.4774 ± 0.071, respectively, and for benign lesions were 1.48 ± 0.49 × 10⁻³ mm2/s and 0.317 ± 0.115, respectively. For both the parameters, differences were highly significant (P < 0.001).
ROC curve analysis [Figure 4] suggested that ADC ≤1.1 × 10⁻³ mm2/s indicates the possibility of malignancy in the breast lesion with 92.3% (95% CI 83.0–97.5) sensitivity and 73.9% specificity (95% CI 51.6–89.8); when ROC was higher than 0.4 [Figure 5], sensitivity and specificity of exponential ADC value of malignancy were 93.9% (95% CI 85.0–98.3) and 82.6% (95% CI 61.2–95), respectively.
Figure 4.
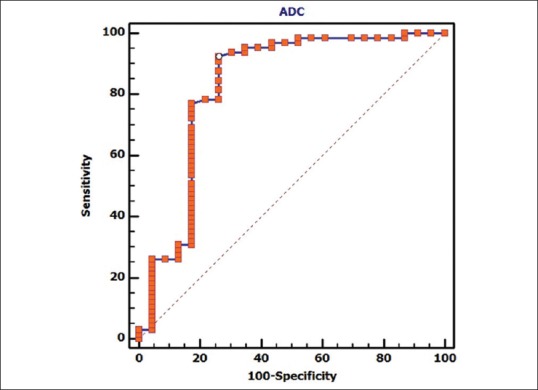
Graph shows receiver operating characteristic (ROC) curve to see if there is any cut-off for the apparent diffusion coefficient (ADC) parameter for predicting malignancy. Area under the curve, which represents the probability the lesion, will be classified accurately as benign or malignant according to the ADC value, is 0.827. ROC curve analysis is suggesting that ADC ≤; 0.0011 indicates the possibility of malignancy in the breast lesion with 92.3% (95% CI 83.0 – 97.5) sensitivity and 73.9% specificity (95% CI 51.6 – 89.8)
Figure 5.
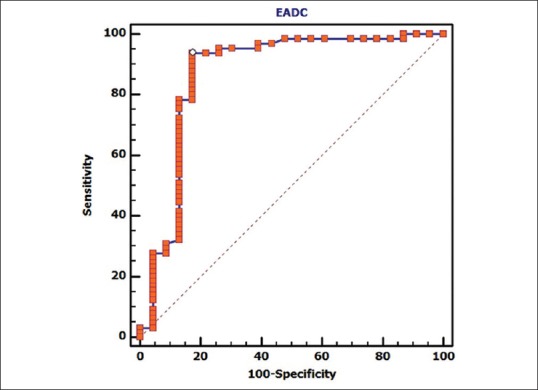
Graph shows receiver operating characteristic (ROC) curve for exponential apparent diffusion coefficient (exponential ADC). Area under the curve, which represents the probability the lesion, will be classified accurately as benign or malignant according to the exponential ADC value, is 0.868. ROC curve analysis is suggesting that exponential ADC >0.4 indicates the possibility of malignancy in the breast lesion with 93.9% (95% CI 85.0 – 98.3) sensitivity and 82.6% specificity (95% CI 61.2 ¬– 95)
The performance of ADC and exponential ADC in distinguishing between benign and malignant breast lesions based on the respective cut-offs was compared by Mc Nemar's Chi-square test which showed the two modalities to be comparable (P = 0.109).
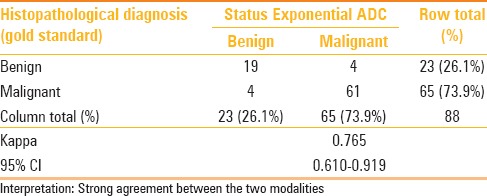
The strength of agreement when compared between individual diagnostic parameters (ADC, exponential ADC) and the gold standard diagnosis of histopathology estimated as Cohen's kappa with its 95% confidence interval were better with exponential ADC [Tables 1 and 2]. Kappa statistics is derived as measure of agreement (adjusted against the proportion of disagreement) and in this case has been calculated from cut-off derived from the ROC. Therefore, the sensitivity and specificity obtained through the ROC analysis is reported.
Table 1.
Cross-tabulation of diagnosis by ADC cut-off vis-a-vis the gold standard histopathological diagnosis: With extent of agreement depicted as Cohen's Kappa
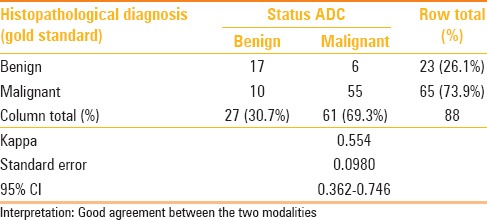
Table 2.
Cross-tabulation of diagnosis by Exponential ADC cut-off vis-a-vis the gold standard histopathological diagnosis: With extent of agreement depicted as Cohen's Kappa
Discussion
In our study, we evaluated the role of exponential ADC and ADC in distinguishing benign and malignant breast lesions at b-value of 800 s/mm2. To our knowledge, this is the first study to calculate the mean exponential ADC and cut-off value for differentiating benign and malignant breast lesions. No additional sequence is required for interpretation of exponential ADC, thus saving time. The mean exponential ADC values for malignant and benign lesions were 0.4774 and 0.317, respectively.
The mean ADC value of malignant lesions was 0.9526 ± 0.203 × 10⁻³ mm2/s and that for benign lesions was 1.48 ± 0.49 × 10⁻³ mm2/s. These values are in agreement with the results of previous studies by Woodhams et al.,[16] Abdulghaffar et al.,[17] Park et al.,[18] Bansal et al.,[19] Palle et al.,[20] and Kul et al.[4]
The cutoff values for ADC and exponential ADC derived from ROC analysis were 1.1 × 10⁻³ mm2/s and 0.4, respectively, for predicting malignancy. Fifty-five lesions of the 65 malignant and 17 of the 23 malignant lesions were classified correctly using the ADCs, resulting in 92.3% sensitivity and 73.9% specificity; whereas 61 out of 65 malignant lesions and 19 out of 23 benign lesions were correctly classified using the exponential ADC cutoff of 0.4, resulting in higher sensitivity and specificity (93.9% and 82.6%, respectively).
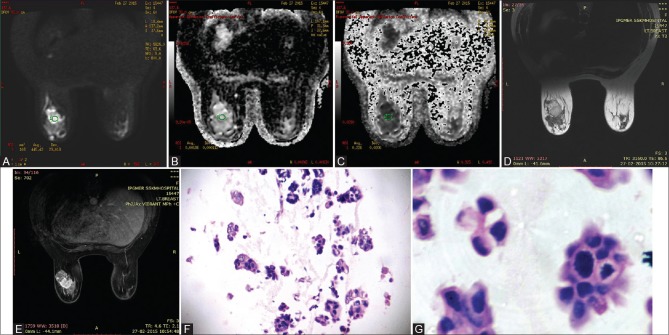
Six lesions were false positive, as suggested by ADC. These lesions include four cases of idiopathic granulomatous mastitis, one case of fibroadenosis with epitheliosis and one case of fibrocystic disease of the breast. The mean ADCs of idiopathic granulomatous mastitis (mean 0.9132 × 10⁻³ mm2/s, range 0.632–1.15 × 10⁻³ mm2/s) is significantly lower than those of benign lesions. Similarly the mean exponential ADC value for idiopathic granulomatous mastitis (0.4886, range 0.4–0.604) were higher than those of benign lesions. All four false positive cases, as suggested by exponential ADC, were idiopathic granulomatous mastitis. There were four false negative lesions taking exponential ADC cutoff of 0.4, which includes one case of pure mucinous carcinoma, one case of mixed mucinous carcinoma, and two cases of invasive intraductal carcinomas in comparison to ten false negative lesions suggested by ADC (which includes seven cases of invasive intraductal carcinomas, one case each of invasive metaplastic, pure and mixed mucinous carcinomas). Both pure mucinous carcinoma [Figure 6] and mixed mucinous carcinoma showed higher ADC values (1.86 × 10⁻³ mm2/s and 1.53 × 10⁻³ mm2/s, respectively) and lower exponential ADC values (0.226 and 0.303, respectively), giving false negative results. These lesions reduced the specificity of DWI.
Figure 6(A-G).
41 year old woman with pure mucinous carcinoma in left breast. Axial DWI (b 800s/mm2) shows tumor as high signal intensity in both DWI and ADC map images (A and B) and low signal intensity in corresponding exponential ADC image (C), consistent with no diffusion restriction. ADC and EXPONENTIAL ADC values were 0.00186mm2/s and 0.226 respectively. Lesion shows mixed signal intensity on T2WI (D) and heterogenous enhancement on post contrast study (E). (F) (H&E 10×10) & (G) (H&E 40×10) showing clumps of malignant ductal cells floating in pools of extracellular mucin
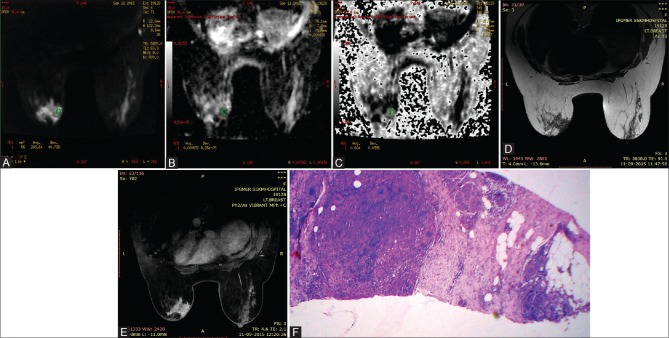
High ADC and lower exponential ADC values were observed in cases of both pure and mixed mucinous carcinomas, which may be due to low density of tumor cells and rich mucin content as compared to high cellularity of IDC. These results are in agreement with the the results of Jin et al.[21] and Woodhams et al.[22] in whose study the mucinous carcinoma showed very high ADC values. Regarding false positive case, idiopathic granulomatous mastitis [Figure 7] showed relatively low ADC values and high exponential ADC values. Bansal et al.[19] also reported false positive results in case of idiopathic granulomatous mastitis.
Figure 7(A-F).
49 year women with idiopathic granulomatous mastitis of left breast. Axial DWI at b800s/mm2 shows areas of hyperintensity within the mass (A) with corresponding areas of hypointensity in ADC image (B) and hyperintensity in EXPONENTIAL ADC image (C), consistent with diffusion restriction. ADC and EXPONENTIAL ADC values were 0.000632 mm2/s and 0.604 respectively. Lesion is hypointense on axial T2WI (D) & shows heterogenous enhancement in post contrast study (E) (H&E 40×10): Microphotograph shows presence of collection of epithelioid cells in fibrocollagenous stroma (F)
Limitations of the study
Our study has some limitations. First, lesions less than 1 cm were not included in the study as placement of ROI and interpretation of ADC and exponential ADC would have been difficult and erroneous due to partial volume effect. Second, absence of in-situ and grade 1 breast carcinomas in the study which reflects the current presentation of breast carcinoma in a tertiary care centre of eastern India, where breast carcinomas are diagnosed at an advanced stage in a majority of cases due to lack of awareness among local women and standardized screening protocol. Cut-off values obtained in this study might not be generalizable to other DWI acquisition schemes because of disunified diffusion gradient factor b. A large cohort is required to validate the results. Finally, overlap still existed between ADC and exponential ADC map values between benign and malignant lesions. ADC and exponential ADC maP values may be unreliable for mucinous carcinoma and idiopathic granulomatous mastitis.
Conclusion
Exponential ADC can be used as a quantitative adjunct tool for characterizing breast lesions with comparable sensitivity and specificity as that of ADC, apart from being used as a visual aid to the radiologist and clinicians. However, DWI and its quantitative parameters ADC and exponential ADC have a limited role in evaluating idiopathic granulomatous mastitis and mucinous carcinomas. More studies are required to validate the role of exponential ADC in characterizing breast lesions.
Financial support and sponsorship
Nil.
Conflicts of interest
There are no conflicts of interest.
References
- 1.Tan SL, Rahmat K, Rozalli FI, Mohd-Shah MN, Aziz YF, Yip CH, et al. Differentiation between benign and malignant breast lesions using quantitative diffusion-weighted sequence on 3 T MRI. Clin Radiol. 2014;69:63–71. doi: 10.1016/j.crad.2013.08.007. [DOI] [PubMed] [Google Scholar]
- 2.Woodhams R, Ramadan S, Stanwell P, Sakamoto S, Hata H, Ozaki M, et al. Diffusion-weighted imaging of the breast: Principles and clinical applications. Radiographics. 2011;31:1059–84. doi: 10.1148/rg.314105160. [DOI] [PubMed] [Google Scholar]
- 3.Melsaether A1, Gudi A. Breast magnetic resonance imaging performance: Safety, techniques, and updates on diffusion-weighted imaging and magnetic resonance spectroscopy. Top Magn Reson Imaging. 2014;23:373–84. doi: 10.1097/RMR.0000000000000035. [DOI] [PubMed] [Google Scholar]
- 4.Kul S, Cansu A, Alhan E, Dinc H, Gunes G, Reis A. Contribution of diffusion-weighted imaging to dynamic contrast-enhanced MRI in the characterization of breast tumors. AJR Am J Roentgenol. 2011;196:210–7. doi: 10.2214/AJR.10.4258. [DOI] [PubMed] [Google Scholar]
- 5.Park MY, Byun JY. Understanding the mathematics involved in calculating apparent diffusion coefficient maps. AJR Am J Roentgenol. 2012;199:W784. doi: 10.2214/AJR.12.9231. [DOI] [PubMed] [Google Scholar]
- 6.Taouli B, Thakur RK, Mannelli L, Babb JS, Kim S, Hecht EM, et al. Renal lesions: Characterization with diffusion-weighted imaging versus contrast-enhanced MR imaging. Radiology. 2009;251:398–407. doi: 10.1148/radiol.2512080880. [DOI] [PubMed] [Google Scholar]
- 7.Wenkel E, Geppert C, Schulz-Wendtland R, Uder M, Kiefer B, Bautz W, et al. Diffusion weighted imaging in breast MRI: Comparison of two different pulse sequences. Acad Radiol. 2007;14:1077–83. doi: 10.1016/j.acra.2007.06.006. [DOI] [PubMed] [Google Scholar]
- 8.Le Bihan D, Breton E, Lallemand D, Aubin ML, Vignaud J, Laval-Jeantet M. Separation of diffusion and perfusion in intravoxel incoherent motion MR imaging. Radiology. 1988;168:497–505. doi: 10.1148/radiology.168.2.3393671. [DOI] [PubMed] [Google Scholar]
- 9.Peters NH, Vincken KL, van den Bosch MA, Luijten PR, Mali WP, Bartels LW. Quantitative diffusion weighted imaging for differentiation of benign and malignant breast lesions: The influence of the choice of b-values. J Magn Reson Imaging. 2010;31:1100–5. doi: 10.1002/jmri.22152. [DOI] [PubMed] [Google Scholar]
- 10.Pereira FP1, Martins G, Figueiredo E, Domingues MN, Domingues RC, da Fonseca LM, et al. Assessment of breast lesions with diffusion-weighted MRI: Comparing the use of different b values. AJR Am J Roentgenol. 2009;193:1030–5. doi: 10.2214/AJR.09.2522. [DOI] [PubMed] [Google Scholar]
- 11.Marini C, Iacconi C, Giannelli M, Cilotti A, Moretti M, Bartolozzi C. Quantitative diffusion-weighted MR imaging in the differential diagnosis of breast lesion. Eur Radiol. 2007;17:2646–55. doi: 10.1007/s00330-007-0621-2. [DOI] [PubMed] [Google Scholar]
- 12.Provenzale JM, Engelter ST, Petrella JR, Smith JS, MacFall JR. Use of MR exponential diffusion-weighted images to eradicate T2 “shine-through” effect. AJR Am J Roentgenol. 1999;172:537–9. doi: 10.2214/ajr.172.2.9930819. [DOI] [PubMed] [Google Scholar]
- 13.Paran Y, Bendel P, Margalit R, Degani H. Water diffusion in the different microenvironments of breast cancer. NMR Biomed. 2004;17:170–80. doi: 10.1002/nbm.882. [DOI] [PubMed] [Google Scholar]
- 14.Zhang YL, Yu BL, Ren J, Qu K, Wang K, Qiang YQ, et al. EADC Values in Diagnosis of Renal Lesions by 3.0 T Diffusion-Weighted Magnetic Resonance Imaging: Compared with the ADC Values. Appl Magn Reson. 2013:44349–63. doi: 10.1007/s00723-012-0376-z. [DOI] [PMC free article] [PubMed] [Google Scholar]
- 15.Park SY, Kim CK, Park JJ, Park BK. Exponential apparent diffusion coefficient in evaluating prostate cancer at 3 T: Preliminary experience. Br J Radiol. 2016;89:20150470. doi: 10.1259/bjr.20150470. [DOI] [PMC free article] [PubMed] [Google Scholar]
- 16.Woodhams R, Matsunaga K, Kan S, Hata H, Ozaki M, Iwabuchi K, et al. ADC mapping of benign and malignant breast tumors. Magn Reson Med Sci. 2005;4:35–42. doi: 10.2463/mrms.4.35. [DOI] [PubMed] [Google Scholar]
- 17.Abdulghaffar W, Tag-Aldeen MM. Role of diffusion-weighted imaging (DWI) and apparent diffusion coefficient (ADC) in differentiating between benign and malignant breast lesions. Egypt J Radiol Nucl Med. 2013;44:945–51. [Google Scholar]
- 18.Park MJ, Cha ES, Kang BJ, Ihn YK, Baik JH. The role of diffusion-weighted imaging and the apparent diffusion coefficient (ADC) values for breast tumors. Korean J Radiol. 2007;8:390–6. doi: 10.3348/kjr.2007.8.5.390. [DOI] [PMC free article] [PubMed] [Google Scholar]
- 19.Bansal R, Shah V, Aggarwal B. Qualitative and quantitative diffusion-weighted imaging of the breast at 3T-A useful adjunct to contrast-enhanced MRI in characterization of breast lesions. Indian J Radiol Imaging. 2015;25:397–403. doi: 10.4103/0971-3026.169455. [DOI] [PMC free article] [PubMed] [Google Scholar]
- 20.Palle L, Reddy B. Role of diffusion MRI in characterizing benign and malignant breast lesions. Indian J Radiol Imaging. 2009;19:287–90. doi: 10.4103/0971-3026.57209. [DOI] [PMC free article] [PubMed] [Google Scholar]
- 21.Jin G, An N, Jacobs MA, Li K. The role of parallel diffusion-weighted imaging and apparent diffusion coefficient (ADC) maP values for evaluating breast lesions: Preliminary results. Acad Radiol. 2010;17:456–63. doi: 10.1016/j.acra.2009.12.004. [DOI] [PMC free article] [PubMed] [Google Scholar]
- 22.Woodhams R1, Kakita S, Hata H, Iwabuchi K, Umeoka S, Mountford CE, et al. Diffusion-weighted imaging of mucinous carcinoma of the breast: Evaluation of apparent diffusion coefficient and signal intensity in correlation with histologic findings. AJR Am J Roentgenol. 2009;193:260–6. doi: 10.2214/AJR.08.1670. [DOI] [PubMed] [Google Scholar]


