

Abstract
The objective of this study was to develop a reliable method for the shape analysis of the amygdala, a structure that is important in gaining a better understanding of the limbic system in the human brain. The goal of this study was threefold; to develop (1) a robust method for aligning the contour of the amygdala; (2) a reproducible method for extracting surface parameters of the amygdala using a spherical mapping technique; and (3) a standardized approach for statistical assessment and visualization of shape alterations by applying the probabilistic maps of amygdalar subregions. This technique was validated by conducting an artificial phantom study and by assessing sex-related amygdalar shape differences using T1-weighted images from healthy volunteers. In the phantom study, the region with atrophy was detected successfully through the shape analysis process. In the human study, the average radii of the centromedial (CM) subregion in the left amygdala and laterobasal (LB), superficial (SF) and CM subregions in the right amygdala were different between sexes (t-tests, p = 0.02,0.04,0.04, and 0.002, respectively). In addition, focal regions with larger radii in amygdalae of men than those of women were found predominantly on the surfaces of bilateral SF and bilateral CM subregions, after the volumes of the amygdala had been scaled to the unit volume (1000mm3) (Mann-Whitney U-test, false discovery rate corrected p<0.05, clustered vertex points > 25). Regions with smaller radii in amygdalae of men were found predominantly on the anterior surfaces of the right LB and SF subregions (Mann-Whitney U-test, false discovery rate corrected p < 0.05, clustered vertex points > 25). This is generally in agreement with previous findings from animal studies. The current method may be used for measuring subtle local shape changes of the amygdala in various psychiatric or neurologic disorders.
Keywords: Amygdala, Probabilistic map, Shape analysis, Subregional analysis, Phantom study, Sex difference
Since the amygdala constitutes an important part of the emotional system in the brain [1], studies that investigated the structural abnormalities in the amygdala have been conducted in patients with psychiatric disorders which are associated with emotional disturbances [8,16,22–24,31]. These amygdalar morphometric studies have primarily used region-of-interest (ROI) based volumetric methods [16,22–24]. Structural focal differences, which may represent subregional changes of the amygdala, may have not sufficiently been reflected in general ROI-based volume measurement methods used in these studies. With this regard, the amygdalar shape analysis method would provide valuable information regarding subtle structural changes in the amygdala. Considering the differential arrays of connections of each amygdalar subregion to other cortical and subcortical structures [1,7,38], subregions of the amygdala have been reported to subserve different functions of the amygdala [1,38]. In this context, detection of local specificity of structural changes in subregions of the amygdala would also provide functional implications of the structural changes [34].
Multiple nuclei comprising the amygdala can be divided into three subregions including the laterobasal (LB), centromedial (CM), and superficial (SF) subregions, which have been known to have different functional roles and connectivity with other brain regions [2,3,7]. The LB subregion which includes the lateral, basolateral, basomedial and paralaminar nuclei [1,7,21], mediates motor response to fearful stimuli and processes emotional memory [1]. The CM subregion which includes the central and medial nuclei [1,7,21], mediates the autonomic and endocrine response to fearful stimuli and is involved in reproductive behavior via connections with the hypothalamus [1]. The SF subregion, which includes the anterior amygdaloid nucleus, the amygdalopyriform transition area, the amygdaloid-hippocampal area and the ventral and posterior cortical nuclei [1,7,21], is involved in the olfactory system and affective processing [3,11,18,33]. Human amygdalar subregions were named after those of the rat considering similar functions and comparable cytoarchitectonic characteristics [1,34]. Although 90° rotations occurred around the anterior-posterior axis in the amygdala of the humans compared to that of the rat, relative positions of the subregions between species are known to be generally preserved [3]. However, proportions of each subregion can be different across species. For example, the LB subregion is particularly larger in humans than other mammals [1,38]. This may be related to the larger portion of the prefrontal cortex in humans, since LB subregion has particularly strong connections with the prefrontal cortex [1].
Although there have been postmortem studies that investigated the abnormalities in the amygdala at a subregional level using a histological method, results may not be readily applicable to in vivo human studies [3,6,30]. Therefore, a method for characterizing the shape variability in subregions of the amygdala of the live human brain would be useful in understanding the roles of the amygdalar subregions in the emotional system in healthy subjects and patients with psychiatric disorders.
Shape analysis techniques have been used to assess local deformations in several subcortical structures of patients with psychiatric or neurologic disorders [8,11,15,26,30]. Amygdalar shape analysis techniques have also been developed and used in previous studies [10,24,26,36]. However, there have not been, to our best knowledge, any amygdalar shape analysis methods that applied the probabilistic maps for the subregioning of the amygdala that may provide important information for locating and interpreting the results of local shape differences [3,40].
Probabilistic maps for amygdalar subregioning have been developed by Amunts et al. [3]. In recent functional neuroimaging studies, activations in the amygdala were examined at a subregional level using these probabilistic maps as reference [5,27]. By applying these probabilistic maps to our template amygdala [3] with the steps of amygdalar alignment, spherical mapping, parameter extraction and parametric visualization with high accuracyand reliability, we aimed to develop a shape analysis method for the amygdala that contains the information for the amygdalar subregions.
Forty healthy volunteers (20 men and 20 women) were recruited through advertisements in local newspapers. All of them were without any axis I psychiatric disorders, any personality disorders, or family history of psychiatric disorders in first-degree relatives. Written informed consent was obtained from each participant. Participants were matched in terms of age, handedness and educational level between 20 male and 20 female subjects.
Brain magnetic resonance imaging (MRI) scans were obtained on a 3.0 T whole body imaging system (Signa Excite, General Electric Medical Systems, Milwaukee, WI, USA). T1-weighted sagittal volume images were acquired using the inversion recovery-prepared three-dimensional (3D) spoiled gradient echo (IR-SPGR) pulse sequence with the following parameters: 1.4 ms echo time (TE), 5.7 ms repetition time (TR), 400 ms inversion time (TI), 256 × 256 matrix, 22 cm field of view (FOV), 20° flip angle (FA), 1 number of excitation (NEX), and 248 contiguous sections with 0.7 mm thick slices. In- and through-plane spatial resolution matrix, zero-fill interpolation processing (ZIP) was used to reconstruct images ina512 × 512 matrix with half thickness.
All T1-weighted images were realigned so that the anterior-posterior axis of the brain was parallel to the intercommissural line and the other two axes along the interhemispheric fissure. Manual segmentation of the amygdala was then performed by an experienced rater (H.J.K.), who was blind to the subjects’ age and sex.
The inferior and posterior border was delineated in the sagittal plane, where the hippocampal head was separated from the amygdala [39]. The anterior border was drawn in the sagittal plane, where the gyrus ambiens was separated from the anterior amygdala [34]. In coronal view, the superior part of the medial border was delimited by ambient cistern and the inferior part of the medial border by entorhinal cortex. The lateral border was delimited by the inferior horn of the lateral ventricle. The superior border was delimited by the entorhinal sulcus and white matter and the inferior border by the lateral ventricle and the white matter tract [7,17]. The intraclass correlation coefficient for intra- and inter-rater reliabilities was 0.88 and 0.85 for amygdalar segmentation, respectively. Brain parenchymal volumes were calculated by summing gray and white matter volumes segmented using a modified mixture model cluster analysis technique implemented in Statistical Parametric Mapping 2 (SPM2) [4].
The binary-segmented images of the amygdala were processed into the 3D surface models by the marching cubes algorithm [19]. For the smoothness of reconstructed amygdalar surfaces, a 3D Laplacian smoothing algorithm was employed. Then, 40 amygdalae were aligned using axes calculated from the principal component analysis (PCA), and one thousand points were distributed evenly on reconstructed spherical amygdalar surface. The radius between each surface point and the center of inertia (COI) was extracted from the amygdalar surface. Then, averaged radii of each point from 40 subjects were calculated and amygdalar template could be produced based on the averaged radii from the COI.
To determine corresponding points on the amygdalar surfaces with more enhanced accuracy, two steps of registration were applied. Rotation using the PCA and translation using the COI were employed for global alignment and an iterative closest point (ICP) registration was applied for a finer alignment. Volumes of all amygdalae were normalized to a unit volume (1000 mm3) to compensate for amygdalar volume differences among individuals. The amygdala before and after this PCA-ICP registration is shown in Supplementary Fig. 1. Validation of this method was performed in a phantom study.
The spatial distances from the COI to spherically evenly distributed surface points were measured. For each surface point pi in subject Sj, the distance vector from the COI of subject Sj (coij) to the subject surface point pij, was calculated in the following Eq. (1):
| (1) |
where L is the Euclidean length from pij to coij. These measurements were mapped on the amygdalar surface.
The probabilistic maps based on the cytoarchitectonic maps [3,13] were downloaded from the statistical parametric mapping (SPM) anatomy toolbox (http://www.fz-juelich.de/inm//spm_anatomy_toolbox). 50% probabilistic masks of each subregion were reconstructed from the probabilistic maps and then 50% amygdalar mask for the whole amygdala was generated [5,27]. This amygdalar mask was then aligned to the template amygdala. Using the same matrix as was used in the alignment of the whole amygdalar mask, its subregional masks were translated and rotated. Three subregional probabilistic maps were realigned to the template with the 2-step PCA-ICP registration. Hence, any specific point on the template corresponded with the points of the registered probabilistic maps, and had the probabilities belonging to the LB, SF or CM subregions. These probabilities were color-coded on every point in the combination of red, green and blue (RGB) colors (Supplementary Fig. 2). The mixture of these colors would be painted on the average amygdala, visualizing subregional probabilities.
For calculating measures that represent subregional volumes of the amygdala, the mean radius of each subregion can be calculated from radii of each surface point and probabilities of this surface point to belong to a certain subregion. For each surface point pi and a subject s, the mean radius of the LB subregion in a subject s (rLBmean) was calculated in the following Eq. (2):
| (2) |
where di is the Euclidean length from pi to the COI, and pLBi is the probability of belonging to the LB subregion of the point pi. The mean radii of the SF, and CM subregions in a subject s can also be calculated in the same way. The overall procedure of the shape analysis and subregional mapping is illustrated in Supplementary Fig. 3.
The artificial phantoms were generated using the amygdalar template generated from 40 healthy volunteers. The lengths of axes of the template amygdala were 15.68,12.46 and 7.20 mm for 3 axes, respectively. In an effort to validate this shape analysis method, two groups of artificial phantoms were generated. For the experimental group, 20 amygdalar phantoms with an atrophy lesion on the same location of their posterior part in the LB subregion were generated (Supplementary Fig. 4). The atrophy lesion was modeled by a half-ellipsoid (radius of ellipsoid: 1.5 mm × 1.5 mm × 2 mm). The region of the half-ellipsoidal solid was excluded out of the amygdala phantom for the atrophy lesion, and the center of the ellipsoid was located on the point of the surface of the template amygdala in the LB subregion. After this process, translation (X, Y, Z coordination; units: mm), and rotation (X-, Y-, Z-axes; units: degree) of each artificial phantom were randomly and independently performed based on the following Gaussian distributions (3) and (4):
| (3) |
| (4) |
where T means translation on each axis, R is rotation on each axis and N(μ, δ) represents a normalized Gaussian distribution with mean μ and standard deviation δ. In addition, the random surface noise was added.
Finally, 20 artificial phantoms with atrophy lesions as the experimental group and 20 artificial phantoms without atrophy lesions as the control group were generated to simulate amygdalae of patients and healthy subjects, respectively.
Independent t-tests were used to assess amygdalar volume differences in the phantom study and in the in vivo study. When the normality of the data distribution cannot be assumed, Mann-Whitney U-tests were used instead of t-tests.
Linear regression analysis was used to adjust each amygdalar volume by brain parenchymal volume. The adjusted amygdalar volume was calculated using the following Eq. (5):
| (5) |
where V′i is the adjusted ith amygdala volume, Vori is the original volume of the amygdala, Vi is the individual ith brain parenchymal volume, Vavg is the mean brain parenchymal volume and Vbrain is the slope of the regression line between Vori and Vi.
An analysis of variance (ANOVA) and mean square expectations for two-way random effects were used to measure intra-class correlation coefficients. Statistical significance was defined at an alpha level less than 0.05, unless otherwise noted. All statistical analyses were performed using Stata SE version 5.0 (StataCorp, College Station, TX, USA).
The volumes of the control phantoms were larger than those of the experimental phantoms (1091 ± 1.7 mm3 vs. 1078 ± 1.1 mm3, independent t-test, p < 0.001), which was due to the half-ellipsoidal atrophy lesion of the experimental group. After the PCA-ICP registration, and the spherical mapping method, quantitative 3D shape parameters were generated. In Supplementary Fig. 4, the regions which had significant differences of radii (independent t-test, false discovery rate [FDR]-corrected, clustered vertex points >25) between the experimental group with atrophy (Supplementary Fig. 4A) and the control group without atrophy (Supplementary Fig. 4B) were depicted in the red circle. These regions were detected in the posterior part of the LB subregion, corresponding to the location of the artificial lesion, which shows that the current method was successful in finding the artificial atrophy lesion.
Supplementary Table 1 shows the demographic information of our study subjects. There were no differences in age, handedness or educational level between 20 male and 20 female volunteers.
Detailed values and statistics for the comparisons of the brain and amygdalar volumes are presented in Supplementary Table 2. The volume comparison revealed smaller amygdalar volumes of women bilaterally, relative to those of men (p = 0.02 and p = 0.007 for the left and right amygdalar volumes, respectively). In addition, women had smaller brain parenchymal volumes than men (p < 0.001). After adjustment for brain parenchymal volumes, there was no significant difference in amygdalar volumes between sexes (p = 0.94 and p = 0.92 for the left and right amygdalar adjusted volumes).
The average radii of subregions calculated from unadjusted amygdalae and their statistics are also presented in Supplementary Table 2. The average radius of the CM subregion of the left amygdala was significantly different between men and women, men having larger average CM radius than women (p = 0.02). For the right amygdala, there were differences between men and women in the average radii of all 3 subregions, men having larger radii than women (p = 0.04, p = 0.04 and p = 0.002 for the LB, SF, and the CM subregions, respectively).
Shape analysis, for finding local shape differences after scaling the amygdalae to a unit volume (1000 mm3), revealed that there were surface areas with significantly larger radii of the right and left amygdalae in men than women, within the SF and CM sub-regions (Mann-Whitney U-test, FDR-corrected p <0.05, clustered vertex points > 25) (Fig. 1). There was also a surface area with significantly smaller radii in men than women on the anterior surface of the right amygdala encompassing the border of the LB and SF subregions. This shape analysis procedure was repeated with radii from unscaled amygdalae (Supplementary Fig. 5).
Fig. 1.
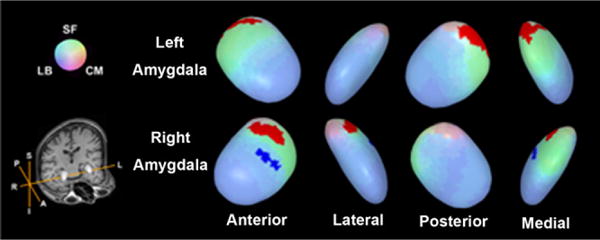
Surface regions of the amygdala with shape differences between sexes. Regions of shape differences are displayed on the template amygdala. Red color represents the regions of increased radii and blue color, region of decreased radii (Mann-Whitney U-test, FDR-corrected p < 0.05, clustered vertex points > 25). Radii were calculated after the volumes of the amygdala had been scaled to the unit volume (1000 mm3). Abbreviations: A, anterior; CM, centromedial subregion; I, inferior; L, left; LB, laterobasal subregion; P, posterior; R, right; S, superior; SF, superficial sub-region. (For interpretation of the references to color in this figure legend, the reader is referred to the web version of the article.)
The amygdala is composed of multiple subnuclei that have distinctive functions and different cytoarchitecture. Since manual segmentation of amygdalar subregions is not possible on MR images that are obtained for regular clinical and research purposes, there has been a need for the development of the method that can provide information at a subregional level. The current method, which adopted the probabilistic maps of the amygdala, for which information has been derived from the postmortem brains with combined histological and brain MRI data [3], has been validated using the phantom data and in vivo human MRI data sets. This method may make a potential contribution to a handful of previous amygdalar shape analysis methods [12,29,32], in that this method enhanced the average template with probabilistic subregion information [3].
In general, amygdalar volumes of men are larger than those of women [25]. Our results suggest that these differences may primarily have stemmed from difference in the CM subregion of the left amygdala and all 3 subregions of the right amygdala. On the other hand, shape analysis method applied after scaling amygdalae to the unit volume (1000 mm3), may provide information for the ‘shape’ differences of the amygdala. When focusing shape variations between groups, it might help to take the volume differences of amygdalae into consideration (Fig. 1 and Supplementary Fig. 5) [25].
In the current study, regions with larger radii in men were found mainly on the surfaces of the bilateral SF and the CM subregions (Fig. 1). Previous rodent studies reported that the volume of the posterodorsal medial nucleus in the amygdala of the male rodents was larger than that of the female [14], which may have been affected by androgen [11]. The posteromedial cortical nucleus was greater in the male rat [37] while there was no difference in basolateral nucleus [28]. Results of our shape analysis are generally in line with these prior animal studies on sex differences [14,28,37]. Men and women are different in cognition and emotional event processing and have a different neural basis for these processes [9,20,35]. These differences might be related to differences in amygdalar subregional morphology, though further studies may be needed to verify this.
There are limitations of this study. The small sample size of the in vivo study may have resulted in type II errors. The phantom study had simplified structures with little volume variations across individual amygdalae. More sophisticated and complicated phantom studies would be needed for more solid verification.
In conclusion, a 3D amygdalar shape analysis method based on subregional probabilistic segmentation was developed with systemic statistical assessment and visualization of parametric local shape alterations. Validation was done using a phantom study and an in vivo study.
Supplementary Material
Acknowledgments
This work was supported by the National Research Foundation Grants funded by the Korean Government (MOEHRD, KRF–2007–511-H00002; 2009-0074584; and 2009-0066915) and the grant from the Korea Research Foundation funded by the Korean Government (KRF–2008–220-E00021). The funding sources had no role in the study design; in the collection, analysis and interpretation of data; in the writing of the report; and in the decision to submit the paper for publication. We thank Sujin Bae, MS and Hyeonseok S Jeong, BS for technical assistance.
Abbreviations
- CM
centromedial
- COI
center of inertia
- LB
laterobasal
- SF
superficial
- ICA
iterative closest algorithm
- PCA
principal component analysis
- ROI
region of interest
Appendix A. Supplementary data
Supplementary data associated with this article can be found, in the online version, at doi:10.1016/j.neulet.2010.11.005.
References
- 1.Aggleton JP. The Amygdala: A Functional Analysis. Oxford University Press; Oxford: 2000. [Google Scholar]
- 2.Amorapanth P, LeDoux JE, Nader K. Different lateral amygdala outputs mediate reactions and actions elicited by a fear-arousing stimulus. Nat Neurosci. 2000;3:74–79. doi: 10.1038/71145. [DOI] [PubMed] [Google Scholar]
- 3.Amunts K, Kedo O, Kindler M, Pieperhoff P, Mohlberg H, Shah NJ, Habel U, Schneider F, Zilles K. Cytoarchitectonic mapping of the human amygdala, hippocampal region and entorhinal cortex: intersubject variability and probability maps. Anat Embryol. 2005;210:343–352. doi: 10.1007/s00429-005-0025-5. [DOI] [PubMed] [Google Scholar]
- 4.Ashburner J, Friston K. Multimodal image coregistration and partitioning — a unified framework. Neuroimage. 1997;6:209–217. doi: 10.1006/nimg.1997.0290. [DOI] [PubMed] [Google Scholar]
- 5.Ball T, Rahm B, Eickhoff SB, Schulze-Bonhage A, Speck O, Mutschler I. Response properties of human amygdala subregions: evidence based on functional MRI combined with probabilistic anatomical maps. PLoS One. 2007;2:e307. doi: 10.1371/journal.pone.0000307. [DOI] [PMC free article] [PubMed] [Google Scholar]
- 6.Berretta S, Pantazopoulos H, Lange N. Neuron numbers and volume of the amygdala in subjects diagnosed with bipolar disorder or schizophrenia. Biol Psychiatry. 2007;62:884–893. doi: 10.1016/j.biopsych.2007.04.023. [DOI] [PubMed] [Google Scholar]
- 7.Bloom FE, Bjorklund A, Hokfelt T. The Primate Nervous System, Part III. first. Elsevier Science B.V; Amsterdam: 1999. [Google Scholar]
- 8.Blumberg HP, Kaufman J, Martin A, Whiteman R, Zhang JH, Gore JC, Charney DS, Krystal JH, Peterson BS. Amygdala and hippocampal volumes in adolescents and adults with bipolar disorder. Arch Gen Psychiatry. 2003;60:1201–1208. doi: 10.1001/archpsyc.60.12.1201. [DOI] [PubMed] [Google Scholar]
- 9.Cahill L. Why sex matters for neuroscience. Nat Rev Neurosci. 2006;7:477–484. doi: 10.1038/nrn1909. [DOI] [PubMed] [Google Scholar]
- 10.Chung MK, Worsley KJ, Nacewicz BM, Dalton KM, Davidson RJ. General multivariate linear modeling of surface shapes using SurfStat. Neuroimage. 2010;53:491–505. doi: 10.1016/j.neuroimage.2010.06.032. [DOI] [PMC free article] [PubMed] [Google Scholar]
- 11.Cooke BM, Tabibnia G, Breedlove SM. A brain sexual dimorphism controlled by adult circulating androgens. Proc Natl Acad Sci USA. 1999;96:7538–7540. doi: 10.1073/pnas.96.13.7538. [DOI] [PMC free article] [PubMed] [Google Scholar]
- 12.Csernansky JG, Wang L, Swank J, Miller JP, Gado M, McKeel D, Miller MI, Morris JC. Preclinical detection of Alzheimer’s disease: hippocampal shape and volume predict dementia onset in the elderly. Neuroimage. 2005;25:783–792. doi: 10.1016/j.neuroimage.2004.12.036. [DOI] [PubMed] [Google Scholar]
- 13.Eickhoff SB, Stephan KE, Mohlberg H, Grefkes C, Fink GR, Amunts K, Zilles K. A new SPM toolbox for combining probabilistic cytoarchitectonic maps and functional imaging data. Neuroimage. 2005;25:1325–1335. doi: 10.1016/j.neuroimage.2004.12.034. [DOI] [PubMed] [Google Scholar]
- 14.Hines M, Allen LS, Gorski RA. Sex differences in subregions of the medial nucleus of the amygdala and the bed nucleus of the stria terminalis of the rat. Brain Res. 1992;579:321–326. doi: 10.1016/0006-8993(92)90068-k. [DOI] [PubMed] [Google Scholar]
- 15.Hwang J, Lyoo IK, Dager SR, Friedman SD, Oh JS, Lee JY, Kim SJ, Dunner DL, Renshaw PF. Basal ganglia shape alterations in bipolar disorder. Am J Psychiatry. 2006;163:276–285. doi: 10.1176/appi.ajp.163.2.276. [DOI] [PubMed] [Google Scholar]
- 16.Joyal CC, Laakso MP, Tiihonen J, Syvalahti E, Vilkman H, Laakso A, Alakare B, Rakkolainen V, Salokangas RK, Hietala J. The amygdala and schizophrenia: a volumetric magnetic resonance imaging study in first-episode, neuroleptic-naive patients. Biol Psychiatry. 2003;54:1302–1304. doi: 10.1016/s0006-3223(03)00597-3. [DOI] [PubMed] [Google Scholar]
- 17.Kates WR, Abrams MT, Kaufmann WE, Breiter SN, Reiss AL. Reliability and validity of MRI measurement of the amygdala and hippocampus in children with fragile X syndrome. Psychiatry Res. 1997;75:31–48. doi: 10.1016/s0925-4927(97)00019-x. [DOI] [PubMed] [Google Scholar]
- 18.LeDoux JE, Gorman JM. A call to action: overcoming anxiety through active coping. Am J Psychiatry. 2001;158:1953–1955. doi: 10.1176/appi.ajp.158.12.1953. [DOI] [PubMed] [Google Scholar]
- 19.Lorensen WE, Cline HE. Marching cubes: a high resolution 3D surface construction algorithm. Comput Graphics. 1987;21:163–169. [Google Scholar]
- 20.Mackiewicz KL, Sarinopoulos I, Cleven KL, Nitschke JB. The effect of anticipation and the specificity of sex differences for amygdala and hippocampus function in emotional memory. Proc Natl Acad Sci USA. 2006;103:14200–14205. doi: 10.1073/pnas.0601648103. [DOI] [PMC free article] [PubMed] [Google Scholar]
- 21.Mai JK, Paxinos G, Voss T. Atlas of the Human Brain. third. Academic Press; San Diego: 2008. [Google Scholar]
- 22.Makris N, Gasic GP, Seidman LJ, Goldstein JM, Gastfriend DR, Elman I, Albaugh MD, Hodge SM, Ziegler DA, Sheahan FS, Caviness VS, Jr, Tsuang MT, Kennedy DN, Hyman SE, Rosen BR, Breiter HC. Decreased absolute amygdala volume in cocaine addicts. Neuron. 2004;44:729–740. doi: 10.1016/j.neuron.2004.10.027. [DOI] [PubMed] [Google Scholar]
- 23.Munson J, Dawson G, Abbott R, Faja S, Webb SJ, Friedman SD, Shaw D, Artru A, Dager SR. Amygdalar volume and behavioral development in autism. Arch Gen Psychiatry. 2006;63:686–693. doi: 10.1001/archpsyc.63.6.686. [DOI] [PubMed] [Google Scholar]
- 24.Phillips RG, LeDoux JE. Differential contribution of amygdala and hippocampus to cued and contextual fear conditioning. Behav Neurosci. 1992;106:274–285. doi: 10.1037//0735-7044.106.2.274. [DOI] [PubMed] [Google Scholar]
- 25.Plessen KJ, Bansal R, Zhu H, Whiteman R, Amat J, Quackenbush GA, Martin L, Durkin K, Blair C, Royal J, Hugdahl K, Peterson BS. Hippocampus and amygdala morphology in attention-deficit/hyperactivity disorder. Arch Gen Psychiatry. 2006;63:795–807. doi: 10.1001/archpsyc.63.7.795. [DOI] [PMC free article] [PubMed] [Google Scholar]
- 26.Pruessner JC, Li LM, Serles W, Pruessner M, Collins DL, Kabani N, Lupien S, Evans AC. Volumetry of hippocampus and amygdala with high-resolution MRI and three-dimensional analysis software: minimizing the discrepancies between laboratories. Cereb Cortex. 2000;10:433–442. doi: 10.1093/cercor/10.4.433. [DOI] [PubMed] [Google Scholar]
- 27.Qiu A, Miller MI. Multi-structure network shape analysis via normal surface momentum maps. Neuroimage. 2008;42:1430–1438. doi: 10.1016/j.neuroimage.2008.04.257. [DOI] [PubMed] [Google Scholar]
- 28.Roy AK, Shehzad Z, Margulies DS, Kelly AM, Uddin LQ, Gotimer K, Biswal BB, Castellanos FX, Milham MP. Functional connectivity of the human amygdala using resting state fMRI. Neuroimage. 2009;45:614–626. doi: 10.1016/j.neuroimage.2008.11.030. [DOI] [PMC free article] [PubMed] [Google Scholar]
- 29.Rubinow MJ, Juraska JM. Neuron andglia numbers in the basolateral nucleus of the amygdala from preweaning through old age in male and female rats: a stereological study. J Comp Neurol. 2009;512:717–725. doi: 10.1002/cne.21924. [DOI] [PMC free article] [PubMed] [Google Scholar]
- 30.Schiltz K, Witzel J, Northoff G, Zierhut K, Gubka U, Fellmann H, Kaufmann J, Tempelmann C, Wiebking C, Bogerts B. Brain pathology in pedophilic offenders: evidence of volume reduction in the right amygdala and related diencephalic structures. Arch Gen Psychiatry. 2007;64:737–746. doi: 10.1001/archpsyc.64.6.737. [DOI] [PubMed] [Google Scholar]
- 31.Schumann CM, Amaral DG. Stereological estimation of the numberof neurons in the human amygdaloid complex. J Comp Neurol. 2005;491:320–329. doi: 10.1002/cne.20704. [DOI] [PMC free article] [PubMed] [Google Scholar]
- 32.Shrout PE, Fleiss JL. Interclass correlations: uses in assessing rater reliability. Psychol Bull. 1979;7:420–428. doi: 10.1037//0033-2909.86.2.420. [DOI] [PubMed] [Google Scholar]
- 33.Styner M, Lieberman JA, McClure RK, Weinberger DR, Jones DW, Gerig G. Morphometric analysis of lateral ventricles in schizophrenia and healthy controls regarding genetic and disease-specific factors. Proc Natl Acad Sci USA. 2005;102:4872–4877. doi: 10.1073/pnas.0501117102. [DOI] [PMC free article] [PubMed] [Google Scholar]
- 34.Swanson LW, Petrovich GD. What is the amygdala? Trends Neurosci. 1998;21:323–331. doi: 10.1016/s0166-2236(98)01265-x. [DOI] [PubMed] [Google Scholar]
- 35.Szabo CA, Xiong J, Lancaster JL, Rainey L, Fox P. Amygdalar and hippocampal volumetry in control participants: differences regarding handedness, AINRAm. J Neuroradiol. 2001;22:1342–1345. [PMC free article] [PubMed] [Google Scholar]
- 36.Takahashi H, Matsuura M, Yahata N, Koeda M, Suhara T, Okubo Y. Men and women show distinct brain activations during imagery of sexual and emotional infidelity. Neuroimage. 2006;32:1299–1307. doi: 10.1016/j.neuroimage.2006.05.049. [DOI] [PubMed] [Google Scholar]
- 37.Tamburo RJ, Siegle GJ, Stetten GD, Cois CA, Butters MA, Reynolds CF, III, Aizenstein HI. Amygdalae morphometry in late-life depression. Int J Geriatr Psychiatry. 2009;24:837–846. doi: 10.1002/gps.2167. [DOI] [PMC free article] [PubMed] [Google Scholar]
- 38.Whalen PJ, Phelps EA. The Human Amygdala. The Guilford Press; New York: 2009. [Google Scholar]
- 39.Wood ZJ, Schröder P, Breen D, Desbrun M. Semi-regular mesh extraction from volumes. IEEE Visual. 2000:275–282. [Google Scholar]
- 40.Zilles K, Amunts K. Centenary of Brodmann’s map — conception and fate. Nat Rev Neurosci. 2010;11:139–145. doi: 10.1038/nrn2776. [DOI] [PubMed] [Google Scholar]
Associated Data
This section collects any data citations, data availability statements, or supplementary materials included in this article.