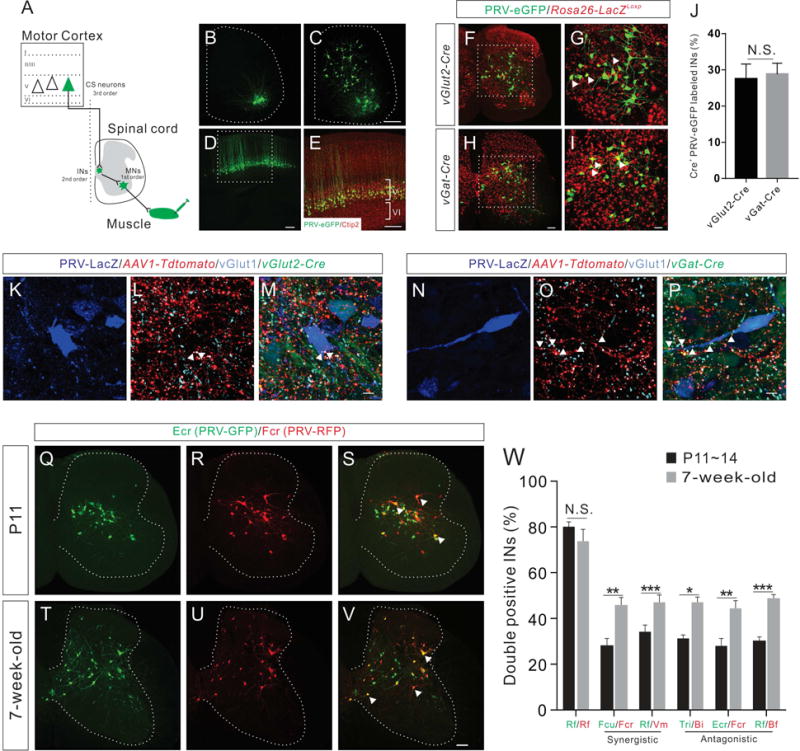
Figure 1. Anatomical reorganization of IN-MN connectivity controlling functionally related muscle pairs during development.

(A) Schematic diagram showing the PRV tracing strategy to label CS circuit pathways. Intramuscular injection of retrograde PRV labels muscles, then first order MNs, second order INs, and finally third order CS neurons.
(B–E) Representative images showing PRV-labeled first order MNs (B, 1 day post injection, dpi, n=6), second order INs (C, 2 dpi, n=5), and third order CS neurons (D, 3.5 dpi, n=8) following PRV-eGFP injection into the Rf muscle at P14. (E) Higher magnification view of the boxed area in (D) showing that PRV-labeled cortical neurons are positive for the layer V marker Ctip2 (red).
(F–I) Representative images showing PRV-labeled INs following PRV-eGFP injection into the Rf muscle of vGlut2-Cre-Rosa26-LacZLoxp (F) and vGat-Cre-Rosa26-LacZLoxp (H) mice at P14. (G and I) Higher magnification views of the boxed area in (F and H) showing that a subset of PRV-labeled INs is also LacZ+ (red, representative INs are indicated by white arrowheads).
(J) The percentage of PRV-eGFP+/LacZ+ INs in vGlut2-Cre-Rosa26-LacZLoxp mice (n=9) is similar (P=0.7952) to that of vGat-Cre-Rosa26-LacZLoxp mice (n=9).
(K–P) Representative cervical spinal cord images showing that vGlut2-Cre-expressing excitatory (K–M) and vGat-Cre-expressing inhibitory (N–P) PRV-LacZ+ INs receiving putative CS inputs (tdTomato+/vGlut1+, indicated by white arrowheads) from 5-week-old mice.
(Q–V) Representative images of cervical spinal cord showing INs labeled by dual-color PRV tracing from Ecr/Fcr antagonistic muscle pair at P11 and 7-week-old stages (representative double-labeled INs are indicated by white arrowheads).
(W) Percentage of double-labeled INs in P11~14 (black bar) and 7-week-old adult mice (grey bar) by dual-color PRV tracing for different synergistic and antagonistic muscle pairs showing the significant increase of double positive INs in adult animals for all muscle pairs except Rf/Rf control: Rf/Rf, P14 (n=6), adult (n=6), P=0.3312; Fcu/Fcr, P11 (n=8), adult (n=8), P=0.0061; Rf/Vm, P14 (n=8), adult (n=8), P=0.0004; Tri/Bi, P11 (n=8), adult (n=4), P=0.0434; Ecr/Fcr, P11 (n=8), adult (n=8), P=0.0085; and Rf/Bf, P14 (n=8), adult (n=8), P<0.0001. Where “n” represents the number of mice used in each experiment. Scale bars, 10 μm (M and P), 50 μm (I), 100 μm (H and V), 200 μm (C–E). See also Figures S1–S3.
