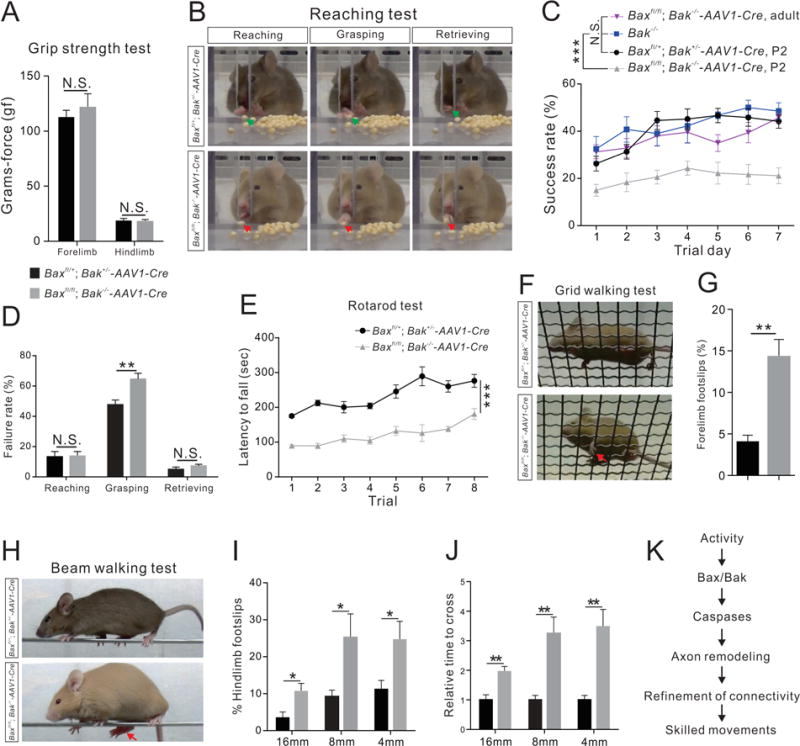
Figure 8. Adult Bax/Bak double mutant mice exhibit skilled behavioral deficits.

(A–J) Performance on behavior tests by adult Bax/Bak double-mutant (n=8) and control (Baxfl/+; Bak+/−-AAV1-Cre) mice (n=8).
(A) Grip strength test showing the strength of forelimbs (P=0.1634) and hindlimbs (P=0.6901) were similar between Bax/Bak double-mutant and control mice.
(B) Video snapshots depicting the reaching, grasping and retrieving phases of the reaching test. A firm grip of the seed involving the thumb and middle finger by a control mouse during the grasping phase leads to a successful retrieval, while a Bax/Bak double-mutant mouse uses a combination of index, middle, and ring fingers and do not exhibit a proper grip.
(C) Success rates of the reaching test from Baxfl/+; Bak+/−-AAV1-Cre, P2 (n=8), Bak−/− (n=6), Baxfl/fl; Bak−/−-AAV1-Cre, P2 (AAV1-Cre injections at P2, n=8), and Baxfl/fl; Bak−/−-AAV1-Cre, adult (AAV1-Cre injections at P42, n=8) mice showing that the success rates of Baxfl/fl; Bak−/−-AAV1-Cre, P2 mice were significantly (P<0.0001) lower than those of other groups.
(D) Failure percentages for different phases of the reaching behavior on experimental day 7 showing selective impairment of Bax/Bak double-mutant mice during the grasping phase (reaching, P=0.9136; grasping, P=0.0057; and retrieving, P=0.2287).
(E) Bax/Bak double-mutant mice fell off the rotarod sooner (P<0.0001) than control mice in the rotarod test.
(F) Video snapshots of the grid walking test. A forelimb footslip is indicated by the red arrow.
(G) Bax/Bak double-mutant mice exhibited more forelimb footslips during the grid walking test than control mice (P=0.0005).
(H–J) Performance of control and Bax/Bak double-mutant mice on the beam walking test.
(H) Video snapshots of control and Bax/Bak double-mutant mice crossing an 8 mm beam.
(I) Quantification of hindlimb footslips during the beam walking test showing that Bax/Bak double-mutant mice had significantly more footslips than control mice at every beam width tested (16 mm, P=0.0230, 8 mm, P=0.0340, 4 mm, P=0.0327).
(J) Bax/Bak double-mutant mice required greater time to cross the beams than control mice (16 mm, P=0.0021, 8 mm, P=0.0023, 4 mm, P=0.0014).
(K) Proposed mechanism of CS circuit remodeling during development. Where “n” represents the number of mice used in each experiment.
