Abstract
Purpose
The growing use of magnetic resonance imaging (MRI) as a substitute for computed tomography‐based treatment planning requires the development of effective algorithms to generate electron density maps for treatment planning and patient setup verification. The purpose of this work was to develop a method to synthesize computerized tomography (CT) for MR‐only radiotherapy of head and neck cancer patients.
Methods
The algorithm is based on registration of multiple patient datasets containing both MRI and CT images (a “multiatlas” algorithm). Twelve matched pairs of good quality CT and MRI scans (those without apparent motion and blurring artifacts) were selected from a pool of head and neck cancer patients to form the atlas. All atlas MRI scans were preprocessed to reduce scanner‐ and patient‐induced intensity inhomogeneities and to standardize their intensity histograms. Atlas CT and MRIs were coregistered using a novel bone‐to‐air replacement technique applied to the CT scans that improves the similarity between CTs and MRIs and facilitates the registration process. For each new patient, all atlas MRIs are deformed initially onto the new patients’ MRI. We introduce a generalized registration error (GRE) metric that automatically measures the goodness of local registration between MRI pairs. The final synthetic CT value at each point is a nonlinear GRE‐weighted average of the atlas CTs. For evaluation, the leave‐one‐out technique was used for synthetic CT generation and the mean absolute error (MAE) between the original and synthetic CT was computed over the entire CT image. The impact of our proposed CT‐MR registration scheme on the accuracy of the final synthetic CT was also studied. The original treatment plans were also recomputed on the new synthetic CTs and dose‐volume histogram metrics were compared. In addition, the two‐dimensional (2D) gamma analysis at 1%/1 mm and 2%/2 mm dose difference/distance to agreement was also performed to study the dose distribution at the isocenter.
Results
MAE error (± standard deviation) between the original and the synthetic CTs was 64 ± 10, 113 ± 12, and 130 ± 28 Hounsfield Unit (HU) for the entire image, air, and bone regions respectively. Our results showed that our proposed bone‐suppression based CT‐MR fusion and GRE‐weighted strategy could lower the overall MAE error between the original and synthetic CTs by ~69% and ~34% respectively. Dose recalculation comparison showed highly consistent results between plans based on the synthetic vs. the original CTs. The 2D gamma analysis revealed the pass rate of 95.44 ± 2.5 and 99.36 ± 0.71 for 1%/1 mm and 2%/2 mm criteria respectively. Due to local registration weighting, the method is robust with respect to MRI imaging artifacts.
Conclusion
We developed a novel image analysis technique to synthesize CT for head and neck anatomy. Novel methods were introduced to accurately register atlas CTs and MRIs as well as to weight the final electron density maps using local registration goodness estimates. The resulting accuracy is clinically acceptable, at least for these atlas patients.
Keywords: bone suppression CT , generalized registration error, synthetic CT
1. Introduction
Due to superior soft tissue contrast and because it relies on nonionizing radiation, MRI has become a valuable imaging tool for target delineation and response assessment in human oncology.1, 2, 3, 4 However, a lack of tissue electron density information prevents it from acting as the sole imaging modality in radiation oncology. Hence, computerized tomography (CT) scans are still required for treatment planning in radiation therapy. To use both MRI and CT scans for target delineation and treatment planning requires co‐registration of these two image sets thereby imposing a systematic error.5 Acquiring two scans also increases the time, cost, and complexity of the simulation procedure. The ability to derive electron density information directly from MRI could resolve the above issues and has become an area of great research interest in radiation oncology and medical physics.
So far, a variety of approaches have been proposed in the literature to estimate the electron density map for MR‐only radiotherapy.6, 7, 8, 9, 10, 11, 12, 13, 14, 15, 16, 17, 18, 19, 20 Atlas‐based techniques,6, 7, 8, 9, 10, 11, 12 tissue classification with bulk density assignment18, 19, 20 and voxel‐based approaches13, 14, 15, 16, 17 are the three main strategies. Mis‐classification of air and bone along with loss of within‐cluster details, due to bulk density assignment, are the primary limitations of clustering techniques. Also, acquiring ultra short echo time MRI sequence for bone visualization is usually needed for voxel‐based approaches. On the other hand, atlas‐based approaches rely on the accuracy of the deformable image registration to a sample patient or atlas with a known tissue label or electron density. Therefore, they suffer from insufficient precision due to inherent registration errors caused by both intermodality discrepancies and interpatient anatomical variations. A lack of a robust local metric for appropriately combining the deformed atlas is another limitation of atlas‐based techniques.
In this article, we present a new multiatlas‐based approach to synthesize CT for head and neck anatomy that addresses some of the above limitations. The novel aspects of the method include an image processing technique that improves the similarity between CT and MRI scans prior to intermodality (CT‐MR) image registration, standardization of the MR intensity histograms21, 22 prior to MR‐MR registration, and a new generalized registration error (GRE) metric that determines the goodness of local registration between MRI pairs. Here with, we present the details of each of these algorithm elements and their impact on the generation of the synthetic CT.
2. Materials and methods
2.A. A overview
Figure 1 summarizes the primary steps in our approach to synthetic CT generation. All MRI scans were preprocessed to reduce intensity inhomogeneity due to field nonuniformity, tissue susceptibility effects and scanner‐dependent variabilities. A set of CT‐MR atlases was then created by co‐registering CT and MR scans for a set of typical head and neck patients. For new patients, the MR images were also preprocessed and then the CT‐MR atlas was deformed onto them. Next, the generalized registration error (GRE) metric was computed as a measure of local similarity between the new patient's MR and that of each MR in the atlas. Finally, the value of the synthetic CT for each voxel was calculated as 1/GRE‐weighted average of the CT numbers from all CT‐MR atlases. The following subsections describe these steps in detail.
Figure 1.
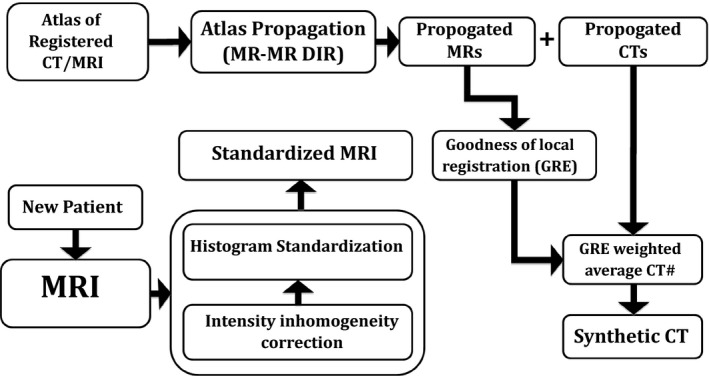
Schematic outline of synthetic‐CT generation. DIR: Deformable image registration, GRE: Generalized registration error.
2.B. Image acquisition
Twelve sets of good‐quality CT and MR images (those without apparent motion and blurring artifacts) were retrospectively selected for this IRB‐approved study from a pool of head and neck (H&N) cancer patients (10 males and 2 females, Table 1) who received radiotherapy at our institution. Some of the patients had dental filling or metal artifacts in their images. All CT and MRI scans were acquired in the radiotherapy treatment position. CT scans (GE Medical System, Milwaukie, WI, USA) were acquired in the helical mode with a tube voltage of 140 Kv, pitch factor of 1.675, slice thickness of 2.5 (n = 11) and 3 (n = 1) mm, matrix size of 512 × 512 and in‐plane pixel size of 0.98 × 0.98 (n = 11) and 1.27 × 1.27 (n = 1) mm2. MR scans were acquired on a Philips 3T (Philips Healthcare, Cleveland, OH, USA) Ingenia system with vender‐provided phased‐arrayed dStream Head‐Neck‐Spine coil, and included the following sequences: mDixon (in‐phase, out‐phase, fat and water), pre‐contrast T1‐weighted dual fast field echo (FFE) with TE1/TE2/TR = 3.3/4.6/6.07 ms, flip angle = 10°, slice thickness of 2.4 mm and in‐plane pixel size of ~1 mm2. The vendor‐provided uniformity correction technique (CLEAR) was also performed for field inhomogeneity correction. The mDixon in‐phase images were chosen as the primary MR image set for this study because the tissue contrast and relative intensity of various tissue types in the in‐phase image was more similar to that of CT scan in compared to fat, water and out‐phase images. As our intermodality registration scheme (see Section 2.C) is based on making relative intensity of the CT and MR more similar to each other, this helps us reach out our goal more easily.
Table 1.
Patients and image acquisition parameters: TC: tube current, PS: pixel size, ST: slice thickness, MS: matrix size, * represents dental filling, † denotes metal artifact
| Pt # | Gender | Age | Dose (Gy) | CT scan | MRI scan | |||
|---|---|---|---|---|---|---|---|---|
| TC (mA) | PS | ST (mm) | MS | PS (mm2) | ||||
| 1* | M | 26 | 54.12 | 250 | 0.98 × 0.98 | 2.50 | 400 × 400 | 1.09 × 1.09 |
| 2* | M | 53 | 50.1 | N/A | 0.98 × 0.98 | 2.50 | 448 × 448 | 1.13 × 1.13 |
| 3* | M | 64 | 50.1 | N/A | 0.98 × 0.98 | 2.50 | 432 × 432 | 1.13 × 1.13 |
| 4* | M | 50 | 50.1 | 345 | 0.98 × 0.98 | 2.50 | 432 × 432 | 1.13 × 1.13 |
| 5*† | M | 59 | 60.0 | 250 | 0.98 × 0.98 | 2.50 | 432 × 432 | 1.06 × 1.06 |
| 6* | M | 54 | 50.1 | 380 | 0.98 × 0.98 | 2.50 | 432 × 432 | 1.13 × 1.13 |
| 7* | M | 60 | 54.12 | 135 | 0.98 × 0.98 | 2.50 | 432 × 432 | 1.13 × 1.13 |
| 8 | M | 69 | 50.1 | 345 | 0.98 × 0.98 | 2.50 | 512 × 512 | 1.01 × 1.01 |
| 9* | F | 41 | 59.4 | 250 | 0.98 × 0.98 | 2.50 | 704 × 704 | 0.58 × 0.58 |
| 10 | F | 39 | 13.2 | 284 | 1.27 × 1.27 | 3.00 | 448 × 448 | 0.93 × 0.93 |
| 11* | M | 55 | 50.1 | 345 | 0.98 × 0.98 | 2.50 | 432 × 432 | 1.13 × 1.13 |
| 12* | M | 42 | 54.12 | 250 | 0.98 × 0.98 | 2.50 | 432 × 432 | 1.13 × 1.13 |
2.C. MRI standardization
Magnetic resonance images, although useful in diagnosis and soft tissue contrast, suffer from intensity inhomogeneity due to B 0 and B 1 field nonuniformity and tissue susceptibility effects.21, 22 The MR intensities of similar tissue types may also vary between scans, mainly due to scanner‐dependent variabilities. These issues may introduce systematic errors in image processing applications, including image registration and segmentation, if not properly handled. To address these concerns, we applied an intensity inhomogeneity correction along with MR intensity standardization.
2.C.1. Intensity inhomogeneity correction
Inhomogeneity of the B 0 and B 1 magnetic fields may lead to geometrical distortion and signal loss depending on the amount of field inhomogeneity and pulse sequence characteristics.23, 24, 25, 26 While geometrical distortion is often handled by measuring and correcting the local field inhomogeneity,24, 26 image analysis techniques27 may be used to address signal loss. In this work, local clustering properties of the image intensities were extracted using a model of intensity inhomogeneity in the neighborhood of each pixel28 to estimate the regional signal loss due to bias fields inhomogeneity. The original image was then corrected accordingly. We applied this procedure along the sagittal plane (superior‐inferior direction) to all MR images since field inhomogeneity is more pronounced in the longitudinal than transverse direction.
2.C.2. Histogram standardization
One of the major limitations of magnetic resonance imaging is the lack of precise, meaningful image intensity for similar tissue types. Although this has little impact for diagnostic applications, it can produce systematic errors during image registration and automatic segmentation. Histogram standardization is one method to remove the scanner‐dependent variabilities in MR image intensities. The standardization process usually involves transformation of a set of specific landmarks in the image intensity histogram to a set of fixed points in a standard space.21, 22 It has been shown22 that using landmarks with tissue‐specific information could have better standardization results than percentile‐based21 standardization. Our investigation revealed four distinct extrema in the intensity histogram of the in‐phase MRI of typical head and neck anatomy. We used these points as tissue‐specific landmarks to standardize the in‐phase MRI intensity histograms (Fig. 2).
Figure 2.
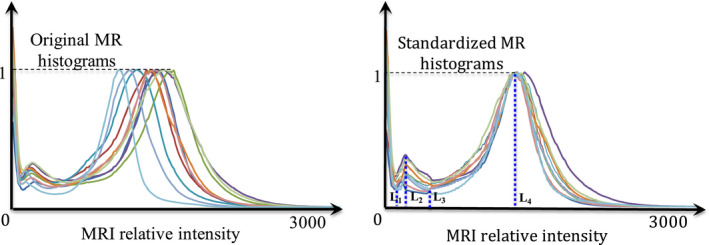
Results of the histogram standardization approach including the four intensity extrema (L1–L4) identified in all images and used for the standardization process. (Left) Original image, (Right) Standardized image. [Color figure can be viewed at wileyonlinelibrary.com]
2.D. CT‐MR atlas
Accurate CT‐MR registration is a highly crucial step in any atlas‐based electron density mapping approach. We found that registration between the atlas MRI and CT images was greatly enhanced by first preprocessing the CT images to suppress/replace the bone CT number with that of air. This resulted in CT images that appeared more similar to MR, with bone and air both contributing low signal strength (Fig. 3).
Figure 3.
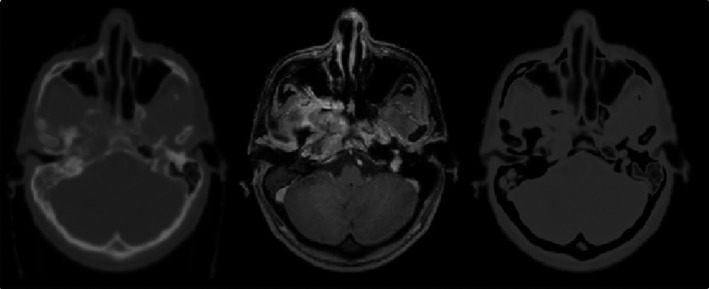
Example of bone suppression/replacement technique to improve the similarity between CT and MRI: (left) original CT image, (middle), in‐phase MR image and (right), bone‐suppressed CT. All images are co‐registered and from patient #1.
2.D.1. Bone suppression/replacement technique
Fuzzy‐c‐means (FCM) clustering29 was used to initially cluster air, bone and soft tissue components in the head and neck CT images. The fuzzy clustering was accomplished through an iterative optimization of the objective function (F obj) shown below, with the update of membership m ij and the cluster centers c j :
| (1) |
where x i is the ith data point, m ij is the degree of membership of x i to the j th cluster, c j is the j th cluster center, C is the number of clusters (3 in our case) and ||*|| represents the norm expressing the similarity between the measured data point and the corresponding cluster center. The iteration stops when , wherein t denotes the number of iteration steps. In this work, we set ɛ = 0.001. Also, u in Eq. (1) is a real number (≥ 1) representing the extent of fuzziness of the clustering process. Using large u increases the fuzziness of the clustering while setting u = 1 produces 0 and 1 as membership values. In the absence of experiment or domain knowledge, u is usually set to 2. Hence, we also set u = 2 in our work. After the CT scan is partitioned, the intensity of the bone voxels is replaced with that of air voxels resulting in the bone‐suppressed CT, CT BS:
| (2) |
where ρ bone denotes the probability of voxel v belonging to the bone class and C air is the air cluster center. Note that since the air signal intensity in the MR images is zero or negligible, the CT BS is further normalized to have an air cluster center of zero intensity. Lastly, the intensity histograms of both the CT BS and MRI scans are further normalized to have the same peak intensity. As can be seen in Fig. 3, the bone suppression technique results in CT and MR images with similar air and bone intensities.
To register CT to MRI, we utilized Plastimatch30 to rigidly align CT BS to MRI using mutual information as the cost function. The subsampling rate of 1 × 1 × 1 was used in this step to avoid smoothing/blurring effect. Using the same subsampling rate and grid size of 30 × 30 × 30 (default value in www.Plastimatch.org website), we subsequently applied B‐spline deformable image registration with mean square error (MSE) as the cost function to fine‐tune the rigidly aligned images. Although mutual information is a useful metric for rigid alignment, it may not be optimal for local adjustment as the number of voxels in a local patch could be insufficient to estimate the local histogram. Hence, we used MSE as the cost function to fine‐tune the rigidly aligned images. Using the resultant displacement field, we finally deformed the planning CT to the MRI to create a deformed CT, CTreg. As the intensity of various tissue types in CT BS and MRI are similar, this leads to a very accurately co‐registered set of CTreg‐MR atlases.
2.E. Synthetic CT generation for a new patient
2.E.1. Multiatlas propagation
For an incoming patient, the new MRI scan is first standardized using the method described in Section 2.B. Next, all CT‐MR pairs in the atlas are deformed onto the new patient's in‐phase MRI using a rigid (mutual information) followed by a B‐spline deformable registration. In the deformation step, mean square error was used as a cost function to fine‐tune the rigidly aligned images. We used the same parameter setting used for CT‐MR fusion for MR‐MR registration as well. Using the resultant displacement field, the corresponding CTreg from each CTreg‐MR pair is also deformed onto the new patient's MRI. This procedure continues until all CTreg‐MR pairs are propagated onto the new patient's MRI.
2.E.2. Generalized Registration Error: GRE
Our approach to assign the CT intensities for a new patient leverages the local similarity of the new patient anatomy to one or more of the existing atlas CTreg‐MR image pairs. Furthermore, we assume that the regional error in the deformable registration between the new patient's MRI and each atlas CTreg‐MR pair is a good metric of local similarity. Since all MRIs are standardized before registration, a perfect match would result in a difference map of zero intensity. As registration becomes less accurate in a local area, the mean, variance and entropy of the corresponding area in the difference map increase. Hence, we compute the generalized registration error (GRE) metric, as a measure of local similarity, from the difference map between a co‐registered MRI pair as follows:
| (3) |
where in the above, Diff k denotes the difference map between the MRI of the new patient, MR fixed , and the kth deformed MR scan in the atlas, MR deformed,k , r indicates a small patch around a voxel, v, and has a size of 5 × 5 × 5 voxels and N is the number of CTreg‐MR pairs in the atlas. nMean, nVariance, and nEntropy denote the mean‐normalized mean, variance and entropy of the small patch respectively. As shown in Eq. (3), the difference maps resulting from registering all CTreg‐MR atlases to the new patient are initially generated. The mean, variance and entropy of each difference map are then calculated. Averaging the resultant means, variances, and entropies gives a global mean for each variable. We use these three quantities as a means of capturing different aspects of local similarity. Figure 4 shows an example of the GRE map computed for a pair of co‐registered MRIs. As can be seen, most of the registration errors arise near the air‐tissue interfaces.
Figure 4.
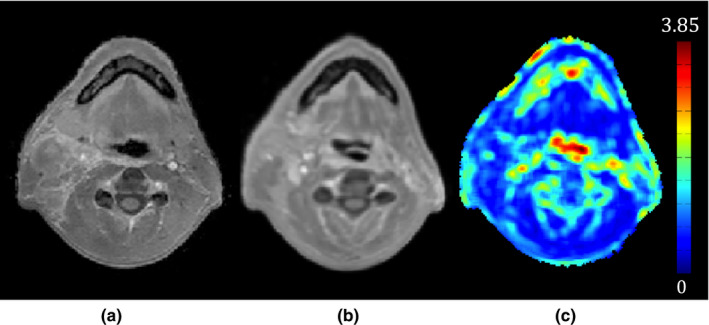
Example of a generalized registration error (GRE) map that is used as a measure of local similarity between the two registered MRIs. (a) A new patient's MRI, (b) an MRI in the atlas co‐registered with (a), and (c) the GRE map between (a) and (b). As seen in (c), most of the registration errors arise near the air‐tissue interfaces.
2.E.3. CT number assignment
Deforming the CTreg‐MR atlas onto a new patient provides a one‐to‐one correspondence between voxels of the new scan and those of each atlas CTreg‐MR pair. Using the GRE metric, we find the atlas pairs that yield the best correspondence(s) for each voxel in the new scan and use this information to assign a CT number. When the number of CTreg‐MR pairs in the atlas is large, the uncertainty of the CT number estimation will be reasonably low. However, when there are only a few atlas samples, the accuracy of the CT number estimation may be compromised due to anatomical variation among patients and interpatient registration errors. To address this, we extend the search for the best GRE correspondence, for a given voxel, to the corresponding voxel in each atlas plus its surrounding neighborhood (up to 2 mm away from the voxel of interest). Since the pixel size and slice thickness in our MR scans are ~1 mm2 and 2.4 mm, respectively, this extended neighborhood search is performed in‐plane only (2‐D search) and includes the neighborhood within 2 voxels of the point of interest. Therefore, instead of having only one correspondence for each voxel in an atlas, 25 candidates for a given voxel were generated in each CTreg‐MR pair. Hence, assuming MR new, MR def,k and CT reg , def,k represent the new MR scan and k th deformed MR and CTreg in the atlas, 2‐D searching provides a GRE set for each voxel in the k th CTreg,def‐MRdef pair as follows:
| (4) |
where x, y, and z are the coordinates of the voxel of interest, v, in the new scan and i and j represent the translation in x and y direction respectively. Taking i min , and j min as the Argmin{GRE(x, y, z, r, k, i, j)} new,def , GRE(v, k, i min , j min ) and the corresponding CT number, CT reg,def (v, k, i min , j min ) represent the best GRE and CT number for voxel v in the k th CTreg,def‐MRdef pair. Similarly, using all of the deformed CTreg‐MR atlas pairs, the synthetic CT number (sCT) corresponding to each voxel, v, is then calculated as:
| (5) |
where u is the unit step function, thr is a threshold below which the registration error is not accepted and γ is a factor enhancing the contribution from highly similar atlas pairs. In this paper, we set thr as the mean of across the entire atlas and γ is empirically set to 5.
Figure 5 shows the effect of using GRE, γ and 2‐D searching in our synthetic CT approach for a typical H&N cancer patient (Patient #5, see Table 1). The mean absolute error (MAE) between the synthetic and original CT was 55, 103, and 108 Hounsfield Unit (HU) for the entire image, air, and bone regions respectively. Without GRE, MAE increased to 75, 173, and 159 HU for the corresponding regions respectively. Using GRE alone (γ = 1), without 2‐D searching, MAE improved to 62, 146, and 137 HU respectively. Setting γ to 5 further improved the MAE to 58, 108, and 123 HU respectively. This example shows that GRE is highly effective in choosing appropriate candidates in the atlas. Furthermore, the power transform and 2‐D searching play complementary roles to optimize the GRE performance.
Figure 5.
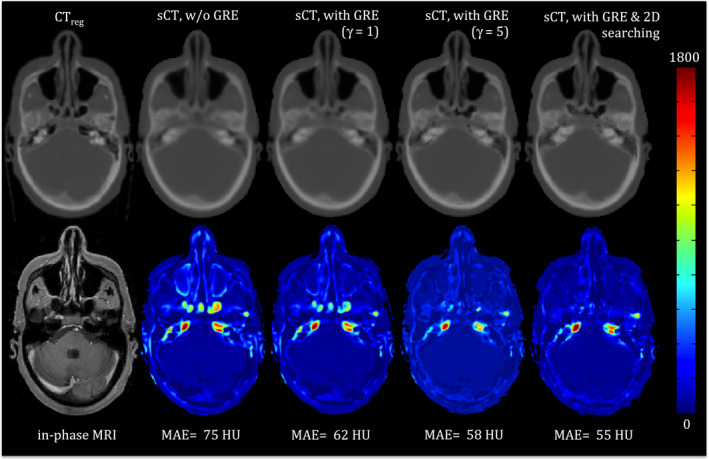
An example showing the impact of GRE, the power transform (γ) and 2‐D neighborhood searching on the synthetic CT generation. The left panel shows the original CT and corresponding co‐registered in‐phase MRI. The second through fifth panels (left to right) are synthetic CTs (top) and color coded absolute difference maps (bottom) between the synthetic CT and the original CT without GRE, with GRE but without 2‐D searching and γ = 1 and γ = 5, respectively, and with GRE (γ = 5) and 2‐D searching. The mean absolute error of each difference map is also noted. [Color figure can be viewed at wileyonlinelibrary.com]
2.F. Evaluation
To quantify the impact of our proposed bone‐suppression based CT‐MR fusion, generalized registration error (GRE) metric and 2‐D searching on the accuracy of the final synthetic CT, we generated synthetic CTs for all patients in our atlas in a leave‐one‐out scheme. That is, each patient was sequentially considered as a “new” patient without a CT and a CTreg‐MR atlas was formed from the remaining patients. The synthetic CT was generated for the new patient and compared to the patient's deformed CT (CTreg). To quantify the impact of generalized registration error and 2‐D searching on our approach, two other forms of synthetic CTs were also generated for each patient: one without using GRE and the other with GRE (γ = 5), but without 2‐D searching.
To measure the accuracy of the synthetic CTs, the mean absolute error (MAE) between each patient's synthetic and deformed planning CTs, CTreg, was computed over the entire CT, air, and bone regions respectively. The entire volume was initially masked out to exclude the background from analysis. Next, air and bone were segmented using CT thresholding with Hounsfield Unit (HU) < −250 for air and HU > 150 for bone. The segmented regions were further refined manually by one of the authors (R. Farjam.).
To investigate the effect of our proposed bone‐suppression‐based CT‐MR registration in the accuracy of the final synthetic CT, we evaluated and analyzed synthetic CT images for all patients created using two DIR methods for CT‐MR atlas creation; one with and the other without bone‐suppression based image fusion. As the intensity of various tissue types in the original CT is different with that of MRI, we used mutual information as a cost function to do the deformation between the original CT and MRI. The other parameters were set as explained in Section 2.C.1.
To compare the impact of our synthetic CTs on radiotherapy dose, we transferred each patient's original treatment plan, generated on the original CT, to both the deformed CT and the synthetic CT and did a forward dose calculation in our Eclipse (Varian Medical Systems, Palo Alto, CA, USA) treatment planning system. All patients’ original plans were either 6X multifield intensity‐modulated radiotherapy (IMRT) or volume‐modulated arc therapy (VMAT) and included several Planning Target Volumes (PTVs) being treated simultaneously to doses ranging from 50 to 70 Gy. The dose‐volume histograms (DVH) and dose statistics, e.g., mean, maximum of the various PTVs (e.g., PTV50, PTV54, and PTV60) and selected organs at risks (OARs), including the parotid glands, submandibular glands, brain stem, and spinal cord were compared between plans. In addition, the two‐dimensional (2D) gamma analysis31 at 1%/1 mm and 2%/2 mm dose difference/distance to agreement was also performed to study the dose distribution at the isocenter. We also visually examined the quality of the digitally reconstructed radiographs (DRR) generated from the synthetic CTs in comparison to those generated from the original planning CT.
3. Results
Figure 6 shows an axial, coronal, and sagittal snapshots of the In‐phase MRI, deformed planning CT (CTreg) and synthetic CT generated using our proposed approach for patient #10 (a female subject without dental filling and metal artifact) along with absolute difference map between the synthetic and deformed planning CT. The MAE between the synthetic and deformed planning CT was 81, 121, and 130 HU for the entire CT, air and bone regions, respectively. The biggest error between the synthetic and deformed CT is seen in the vicinity of the air‐bone and air‐soft tissue interfaces. Figure 7 also shows that although our atlas contains patients with dental filling and metal artifacts, the GRE metric is capable of discarding inappropriate samples during the creation of the synthetic CT.
Figure 6.
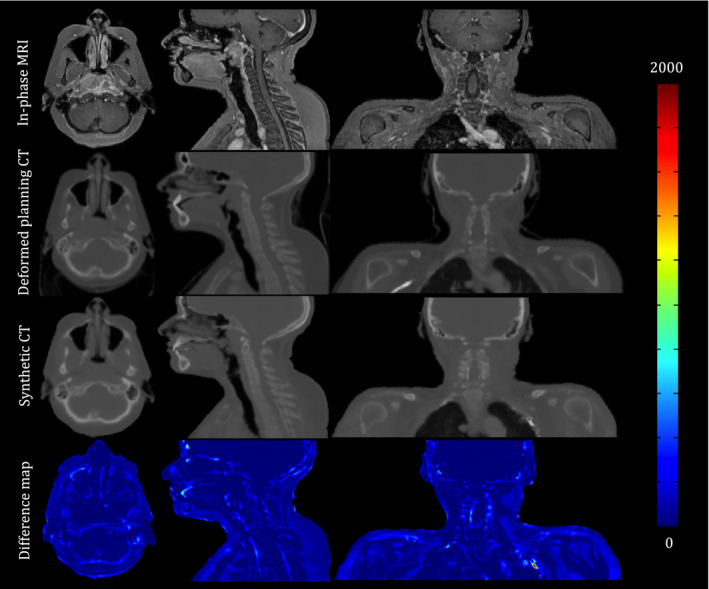
An axial, coronal, and sagittal snapshot of the In‐phase MRI, deformed planning CT and synthetic CT generated using our proposed approach for patient #10. The color‐coded images are the absolute difference maps between the synthetic CT and deformed planning CT. Most differences are seen in the vicinity of the air‐bone and air‐soft tissue interfaces. [Color figure can be viewed at wileyonlinelibrary.com]
Figure 7.
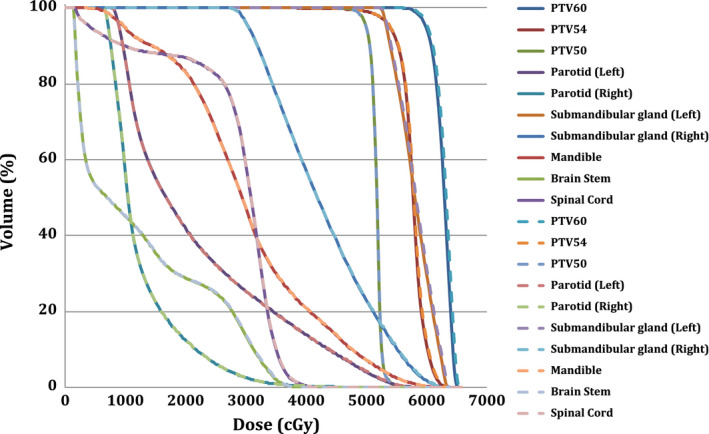
Dose‐volume histograms (DVHs) for the planning target volumes (PTV) and selected organs at risk for the synthetic CT and deformed planning CT of patient #5. Dashed lines correspond to synthetic CT. [Color figure can be viewed at wileyonlinelibrary.com]
Table 2 shows the impact of the bone‐suppression‐based CT‐MR fusion, GRE and 2‐D searching on the accuracy of the final synthetic CTs generated by our proposed algorithm, quantitatively. The mean and standard deviation of the mean absolute error (MAE) between the corresponding synthetic CTs and deformed planning CTs over the entire CT, air, and bone regions are presented. As seen, the largest MAE errors are seen in air and bone regions.
Table 2.
The impact of the bone‐suppression‐based CT‐MR fusion, GRE and 2‐D searching on the accuracy of the final synthetic CTs generated by our proposed algorithm. Numbers show the mean and standard deviation of the mean absolute error (MAE) between the synthetic CTs (generated using different methods of averaging (Equally weighted (without 2D searching) vs. GRE (γ = 5)‐weighted) and with/without 2D searching) and deformed planning CTs
| Registration scheme | W/O bone suppression | W/Bone suppression | |||
|---|---|---|---|---|---|
| Equally weighted | Equally weighted | GRE‐weighted W/O 2‐D searching | GRE‐weighted W/2‐D searching | ||
| Entire CT | Mean | 145 | 86 | 68 | 64 |
| STD | 18 | 10 | 10 | 10 | |
| Air | Mean | 235 | 159 | 121 | 113 |
| STD | 18 | 24 | 13 | 12 | |
| Bone | Mean | 262 | 183 | 145 | 130 |
| STD | 14 | 38 | 30 | 28 | |
Figure 7 presents the dose‐volume histograms (DVH) for the planning target volumes (PTVs) and selected organs at risk (OAR) for the synthetic and deformed planning CTs for Patient #5. As seen, a highly consistent dose distribution between the synthetic CT and deformed planning CT was observed for this patient. Figure 8 also shows the digitally reconstructed radiograph (DRR) for both synthetic and deformed planning CTs.
Figure 8.
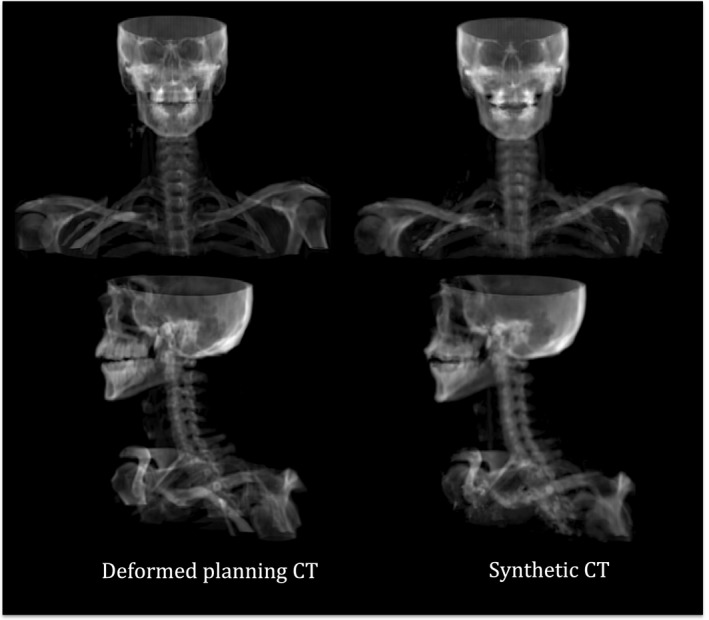
DRR images for both synthetic and deformed planning CTs of Patient #5 in our atlas.
The mean and standard deviation of the percentage differences between various dose statistics for the PTVs and selected OARS for all patients are presented in Table 3. The largest differences observed were less than 2% and were seen for left parotid gland. All other differences were approximately 1% or less. Finally, our 2D gamma analysis of the isocenter dose distribution revealed the pass rate of 99.36 ± 0.7 for 2%/2 mm dose difference/distance to agreement criterion. The pass rate decreased to 95.44 ± 2.5 for 1%/1 mm dose difference/distance to agreement criterion.
Table 3.
Mean and standard deviation of the dose difference between CTreg and CTsyn for all patients in the atlas: PTV50, 54, and 60: planning target volume receiving 50, 54, or 60 Gy. R: right, L: left, SMG: submandibular gland, BS: brainstem. numbers denote the percentage (%) dose difference between the corresponding PTV/OAR in CTreg and CTsys (± standard deviation)
| PTV60 | PTV54 | PTV50 | Parotid | SMG | ||||||
|---|---|---|---|---|---|---|---|---|---|---|
| L | R | L | R | Mandible | BS | Cord | ||||
| Max | 0.34 ± 0.38 | 0.14 ± 0.51 | 0.11 ± 0.63 | 0.54 ± 0.33 | 0.27 ± 0.48 | 0.29 ± 0.22 | 0.22 ± 0.19 | 0.10 ± 0.30 | 0.02 ± 0.72 | 0.06 ± 1.01 |
| Mean | 0.11 ± 0.16 | 0.33 ± 0.14 | 0.38 ± 0.4 | 1.58 ± 2.09 | 0.42 ± 0.90 | 0.21 ± 0.13 | 0.15 ± 0.38 | 0.48 ± 0.44 | 0.03 ± 0.74 | 0.17 ± 0.41 |
| D95 | 0.02 ± 0.27 | 0.11 ± 0.60 | 1.12 ± 2.1 | |||||||
4. Discussion
We have developed an atlas‐based algorithm with registration goodness weighting for MRI‐driven electron density mapping of head and neck anatomy. After identifying a set of twelve patients with CT and MR scans, we pre‐processed all MRI series to reduce the patient‐ and scanner‐induced intensity inhomogeneity. Then, we deformably registered CT to MRI for each patient to construct a set of co‐registered CT‐MR atlases. For a new patient, we deformed all CT‐MR atlases onto the new MRI and then measured the local registration error between the new patient and each sample in the atlas through which the deformed atlas CTs are weighted to create the synthetic CT. We measured the mean absolute error (MAE) between the original CT and synthetic CT to evaluate the performance of our proposed algorithm. We found that our newly proposed strategies are very effective to reduce MAE compared to other available methodologies. For example, Uh et al.8 reported a root mean square error of 208–539 HU (ours is: 124 ± 21 HU) in their approach where they used rigid registration and simple averaging. Sjölund et al.9 reported a MAE of 113 ± 18 HU by iteratively refining the deformable registration of an atlas onto the new patient. In another work, Gudur et al.10 reported a MAE of 126 ± 25 HU using a unifying probabilistic Bayesian approach.
In our method, we introduced a new image processing method called bone suppression that facilitates intermodality (CT‐MR) deformable image registration. This technique identifies the bone voxels in CT scans and then replaces their intensity with that of air. Since both air and bone have negligible signal intensity in MRI, this makes the relative intensity of air and bone regions in the CT similar to that of MRI, thereby facilitating the registration process. We found that using bone‐suppression technique in CT‐MR fusion may lower the mean absolute error (MAE) between the synthetic CT and deformed planning CT by ~69%.
We also developed a new metric called generalized registration error (GRE) to evaluate the local failure in deformable MR‐MR registration. The basis of the GRE is the measurement of the intensity mismatch between the two standardized MRIs. GRE calculates mean, variance, and entropy of the difference map between the two registered MRIs over a local patch surrounding the voxel of interest. The intensity/tissue mismatch increases as the local registration around a voxel becomes less accurate. In other words, having a small mean over the local patch in the difference map indicates that the corresponding tissues in the two registered MRIs are similar to each other. Likewise, having a small variance and entropy indicates that the intratissue variation is also minimal. It is worthwhile to note that variance and entropy are two different indicators of uncertainties. While variance captures the spread of variation over the entire patch, entropy measures the multimodal distribution where the variation clusters around two or more peaks. Our finding (Table 2) showed that GRE combined with a 2‐D voxel searching was highly effective in selecting the most appropriate corresponding voxel from each CT‐MR pair in the atlas and then guiding the assignment of the CT number for synthetic CT generation. We selected a 2 mm search area for the 2‐D searching in this study. We investigated other sizes for the search area and found that increasing the boundary of the search region did not substantially improve the accuracy of the synthetic CT substantially but did add noticeable computation time. For example, we used MATLAB 8.3.0.532 (R2014a) with MEX function programming to implement our algorithm. Running the 2‐D search 2 mm (a patch of 5 × 5) away from each voxel (voxel size of ~1 mm2) for a patient with matrix size of 400 × 400 × 250 took about 20 min. However, increasing the 2‐D search boundary by one voxel (i.e., to a patch of 7 × 7) approximately doubled the computation time for each patient. We also compared the performance of the GRE with that of local mutual information (LMI) and local normalized cross‐correlation (LNCC) for similarity measurement. Our preliminary results (not shown in this paper) revealed the superiority of GRE compared to the other metrics. The major issue of the local mutual information as a similarity measurement index is the lack of information in a local patch to accurately estimate the individual and joint histograms. On the other hands, LNCC showed little effect over air and soft‐tissue region and showed to be more useful over tissue boundaries and bony structures while GRE had better performance in all areas. For example, replacing GRE with LNCC to synthesize CT in Table 2, resulted in an average MAE of 74 ± 11, 143 ± 23, and 149 ± 38 HU for the entire image, air and bone regions respectively. The results included the use of 2D searchig as well. However, we believe that we need a more comprehensive study using a larger dataset to evaluate the performance of GRE compared with other similarity measurement indices. This will be studied in our future works.
It is also worthwhile to note that we used a patch size of 5 × 5 × 5 to include sufficiently large symmetrical neighborhood around a voxel for our calculation. However, the optimal patch size, gamma constant in GRE calculation and extent by which we perform 2D searching could be optimized depending on the application and will be carried out in the last step of preparing this work for clinical usage.
One of the key steps in our algorithm is the standardization of the MR intensity histograms prior to atlas formation and propagation. Robitaille et al.22 showed that using landmarks with tissue‐specific information have better standardization results than using percentile‐based21 landmarks. They identified background (BKG), gray matter (GM) and white matter (WM) as tissue‐specific points in their method. However, using GM and WM as landmarks may not be optimal for synthetic CT generation since there is negligible difference between the CT number of the gray matter and white matter tissues. In other words, it is desirable to have more landmarks in the regions of low signal intensity as this enables us to differentiate between air and bony tissues more efficiently. As shown in this article, we used four distinct extrema, three of which are in low‐signal‐intensity regions, in the in‐phase MR intensity histogram of head and neck cancer patients as landmarks for the standardization process. It is also worthwhile to note that we assumed that these points correspond to similar tissue types in the in‐phase head and neck MRI. In addition, although, this set of points provided satisfactory results for our purpose, we may incorporate other MRI image series, e.g., fat‐only, water‐only images, etc. to add more landmarks corresponding to fat and muscle tissues thereby enhancing the efficiency of the standardization process. In general, the more tissue‐specific landmarks utilized in the standardization process, the more accurate the intensity match for various tissue types in the MRI series. We initially planned to employ water and fat images as well; however, we found that good results were obtained using the in‐phase images. We have continued to use the mDixon in‐phase to maintain continuity for the atlas.
Including patients with dental fillings or other metal implants can result in systematic errors in synthetic CT generation. It is therefore common to remove such patients during the creation of an atlas;8 however, this would have noticeably restricted the number of patients available to our atlas. Therefore, we did not make any attempt to remove such patients and only excluded patients with imaging artifacts such as motion artifact or blurring issues from our analysis. Figure 7 shows slices from the synthetic CT generated for a female patient without dental and metal artifacts. It is clear in this figure that our GRE similarity metric is capable of discarding inappropriate atlas voxels in the process of synthetic CT generation. In other words, GRE appropriately removes distorted regions in each patient, which allowed us to use a wide range of patients with dental filling and metal artifact in the atlas formation. Nonetheless, it should be noted that the presence of dental filling or metal artifact in new patients imposes a major source of error in our algorithm (Fig. 9). Therefore, using metal artifact reduction pulse sequences32, 33, 34, 35, 36 may be helpful to reduce the effect of metal‐induced susceptibility in the case of MRI‐driven electron density mapping. Another approach to this problem might be the creation of an atlas that includes patients with dental fillings spanning all possible locations. Such approaches will be evaluated in our future work. Also, it is nontrivial to mention that one of most important challenges in using atlas‐based synthetic CT generation approaches is to deform the atlas to patients with large anatomical abnormalities such as surgical resection and large tumors. Hence, it will be our next step to evaluate the performance of our proposed approach using a large dataset including patients with various image quality and anatomical abnormalities.
Figure 9.
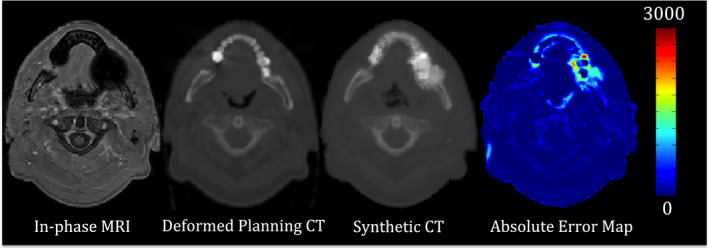
Synthetic CT generation for patient #2 with dental filling and susceptibility artifact. The in‐phase MRI, deformed planning CT, synthetic CT, and absolute difference map between the synthetic and deformed planning CT are shown. The presence of dental filling and susceptibility artifact imposed a substantial error in the resultant synthetic CT. [Color figure can be viewed at wileyonlinelibrary.com]
Conclusions
We have developed and evaluated a multiatlas‐based approach for MR‐driven electron density mapping of head and neck anatomy. We demonstrated that our proposed image registration strategy and GRE metric is capable of creating accurate synthetic CTs. Novel elements of the algorithm include CT‐MRI registration using bone‐suppression, the use of a generalized registration error metric to weight local CT contributions, and fine‐tuning of local registrations independent of global registrations. As noted, dental fillings and metal artifacts in new patients represent a major source of error in our proposed approach. The resulting dosimetric accuracy using the pseudo‐CT scan is excellent. A more comprehensive clinical evaluation is ongoing including more patients as well as other anatomical sites.
Conflicts of interest
This work was partially supported through a Research Agreement from Philips Healthcare, Cleveland, OH.
Acknowledgments
This research was funded in part through NIH/NCI Cancer Center Support Grant/Core Grant P30 CA008748.
This work is in part presented in the 58th annual meeting and exhibition of American association of physicists in medicine (AAPM 2016).
References
- 1. Westbrook C, Roth CK, Talbot J. MRI in Practice. 4 edn. Chichester, West Sussex; Malden, MA: Wiley‐Blackwell; 2011. [Google Scholar]
- 2. Lee NY, Riaz N, Lu JJ(eds.). Target Volume Delineation for Conformal and Intensity‐Modulated Radiation Therapy. 2015 edn. New York, NY: Springer; 2015. [Google Scholar]
- 3. Luna A, Vilanova JC, Hygino Da Cruz LC Jr, Rossi SE (eds.). Functional Imaging in Oncology: biophysical Basis and Technical Approaches. Vol. 1, 2014th edn. Berlin: Springer; 2014. [Google Scholar]
- 4. Jackson A, Buckley DL, Parker GJM, Baert AL. Dynamic Contrast‐Enhanced Magnetic Resonance Imaging in Oncology, 1st edn. Berlin, Heidelberg: Springer; 2006. [Google Scholar]
- 5. Devic S. MRI simulation for radiotherapy treatment planning. Med Phys. 2012;39:6701–6711. [DOI] [PubMed] [Google Scholar]
- 6. Dowling JA, Lambert J, Parker J, et al. An atlas‐based electron density mapping method for magnetic resonance imaging (MRI)‐alone treatment planning and adaptive MRI‐based prostate radiation therapy. Int J Radiat Oncol Biol Phys. 2012;83:e5–11. [DOI] [PubMed] [Google Scholar]
- 7. Stanescu T, Jans H‐S, Pervez N, Stavrev P, Fallone BG. A study on the magnetic resonance imaging (MRI)‐based radiation treatment planning of intracranial lesions. Phys Med Biol. 2008;53:3579–3593. [DOI] [PubMed] [Google Scholar]
- 8. Uh J, Merchant TE, Li Y, Li X, Hua C. MRI‐based treatment planning with pseudo CT generated through atlas registration. Med Phys. 2014;41:051711. [DOI] [PMC free article] [PubMed] [Google Scholar]
- 9. Sjölund J, Forsberg D, Andersson M, Knutsson H. Generating patient specific pseudo‐CT of the head from MR using atlas‐based regression. Phys Med Biol. 2015;60:825. [DOI] [PubMed] [Google Scholar]
- 10. Gudur MSR, Hara W, Le Q‐T, Wang L, Xing L, Li R. A unifying probabilistic Bayesian approach to derive electron density from MRI for radiation therapy treatment planning. Phys Med Biol. 2014;59:6595–6606. [DOI] [PMC free article] [PubMed] [Google Scholar]
- 11. Dowling JA, Sun J, Pichler P, et al. Automatic substitute computed tomography generation and contouring for magnetic resonance imaging (MRI)‐alone external beam radiation therapy from standard MRI sequences. Int J Radiat Oncol Biol Phys. 2015;93:1144–1153. [DOI] [PubMed] [Google Scholar]
- 12. Burgos N, Cardoso MJ, Thielemans K, et al. Attenuation correction synthesis for hybrid PET‐MR scanners: application to brain studies. IEEE Trans Med Imaging. 2014;33:2332–2341. [DOI] [PubMed] [Google Scholar]
- 13. Lambert J, Greer PB, Menk F, et al. MRI‐guided prostate radiation therapy planning: investigation of dosimetric accuracy of MRI‐based dose planning. Radiother Oncol J Eur Soc Ther Radiol Oncol. 2011;98:330–334. [DOI] [PubMed] [Google Scholar]
- 14. Kim JH, Lee JS, Song I‐C, Lee DS. Comparison of segmentation‐based attenuation correction methods for PET/MRI: evaluation of bone and liver standardized uptake value with oncologic PET/CT data. J Nucl Med Off Publ Soc Nucl Med. 2012;53:1878–1882. [DOI] [PubMed] [Google Scholar]
- 15. Hsu S‐H, Cao Y, Huang K, Feng M, Balter JM. Investigation of a method for generating synthetic CT models from MRI scans of the head and neck for radiation therapy. Phys Med Biol. 2013;58:8419–8435. [DOI] [PMC free article] [PubMed] [Google Scholar]
- 16. Su K‐H, Hu L, Stehning C, et al. Generation of brain pseudo‐CTs using an undersampled, single‐acquisition UTE‐mDixon pulse sequence and unsupervised clustering. Med Phys. 2015;42:4974–4986. [DOI] [PMC free article] [PubMed] [Google Scholar]
- 17. Zheng W, Kim JP, Kadbi M, Movsas B, Chetty IJ, Glide‐Hurst CK. Magnetic resonance–based automatic air segmentation for generation of synthetic computed tomography scans in the head region. Int J Radiat Oncol Biol Phys. 2015;93:497–506. [DOI] [PubMed] [Google Scholar]
- 18. Andreasen D, Van Leemput K, Hansen RH, Andersen JAL, Edmund JM. Patch‐based generation of a pseudo CT from conventional MRI sequences for MRI‐only radiotherapy of the brain. Med Phys. 2015;42:1596–1605. [DOI] [PubMed] [Google Scholar]
- 19. Johansson A, Karlsson M, Yu J, Asklund T, Nyholm T. Voxel‐wise uncertainty in CT substitute derived from MRI. Med Phys. 2012;39:3283–3290. [DOI] [PubMed] [Google Scholar]
- 20. Edmund JM, Kjer HM, Van Leemput K, Hansen RH, Andersen JAL, Andreasen D. A voxel‐based investigation for MRI‐only radiotherapy of the brain using ultra short echo times. Phys Med Biol. 2014;59:7501–7519. [DOI] [PubMed] [Google Scholar]
- 21. Nyúl LG, Udupa JK, Zhang X. New variants of a method of MRI scale standardization. IEEE Trans Med Imaging. 2000;19:143–150. [DOI] [PubMed] [Google Scholar]
- 22. Robitaille N, Mouiha A, Crépeault B, Valdivia F, Duchesne S. Tissue‐based MRI intensity standardization: application to multicentric datasets. Int J Biomed 2012;2012:e347120. [DOI] [PMC free article] [PubMed] [Google Scholar]
- 23. Petersch B, Bogner J, Fransson A, Lorang T, Pötter R. Effects of geometric distortion in 0.2T MRI on radiotherapy treatment planning of prostate cancer. Radiother Oncol J Eur Soc Ther Radiol Oncol. 2004;71:55–64. [DOI] [PubMed] [Google Scholar]
- 24. Wang H, Balter J, Cao Y. Patient‐induced susceptibility effect on geometric distortion of clinical brain MRI for radiation treatment planning on a 3T scanner. Phys Med Biol. 2013;58:465–477. [DOI] [PubMed] [Google Scholar]
- 25. Matakos A, Balter J, Cao Y. Estimation of geometrically undistorted B(0) inhomogeneity maps. Phys Med Biol. 2014;59:4945–4959. [DOI] [PMC free article] [PubMed] [Google Scholar]
- 26. Walker A, Liney G, Metcalfe P, Holloway L. MRI distortion: considerations for MRI based radiotherapy treatment planning. Australas Phys Eng Sci Med Support Australas Coll Phys Sci Med Australas Assoc Phys Sci Med. 2014;37:103–113. [DOI] [PubMed] [Google Scholar]
- 27. Vovk U, Pernus F, Likar B. A review of methods for correction of intensity inhomogeneity in MRI. IEEE Trans Med Imaging. 2007;26:405–421. [DOI] [PubMed] [Google Scholar]
- 28. Li C, Huang R, Ding Z, Gatenby JC, Metaxas DN, Gore JC. A level set method for image segmentation in the presence of intensity inhomogeneities with application to MRI. IEEE Trans Image Process. 2011;20:2007–2016. [DOI] [PMC free article] [PubMed] [Google Scholar]
- 29. Dunn JC. A fuzzy relative of the ISODATA process and its use in detecting compact well‐separated clusters. J Cybern. 1973;3:32–57. [Google Scholar]
- 30. Shackleford JA, Shusharina N, Verberg J, et al. Plastimatch 1.6 – current capabilities and future directions. In: ResearchGate 2012:108–119.
- 31. Low DA, Harms WB, Mutic S, Purdy JA. A technique for the quantitative evaluation of dose distributions. Med Phys. 1998;25:656–661. [DOI] [PubMed] [Google Scholar]
- 32. Cho ZH, Kim DJ, Kim YK. Total inhomogeneity correction including chemical shifts and susceptibility by view angle tilting. Med Phys. 1988;15:7–11. [DOI] [PubMed] [Google Scholar]
- 33. Hargreaves BA, Worters PW, Pauly KB, Pauly JM, Koch KM, Gold GE. Metal‐induced artifacts in MRI. Am J Roentgenol. 2011;197:547–555. [DOI] [PMC free article] [PubMed] [Google Scholar]
- 34. Koch KM, Lorbiecki JE, Hinks RS, King KF. A multispectral three‐dimensional acquisition technique for imaging near metal implants. Magn Reson Med. 2009;61:381–390. [DOI] [PubMed] [Google Scholar]
- 35. Lu W, Pauly KB, Gold GE, Pauly JM, Hargreaves BA. SEMAC: slice encoding for metal artifact correction in MRI. Magn Reson Med Off J Soc Magn Reson Med Soc Magn Reson Med. 2009;62:66–76. [DOI] [PMC free article] [PubMed] [Google Scholar]
- 36. Olsen RV, Munk PL, Lee MJ, et al. Metal artifact reduction sequence: early clinical applications. Radiogr Rev Publ Radiol Soc N Am Inc 2000;20:699–712. [DOI] [PubMed] [Google Scholar]


