

Abstract
In vivo muscle function testing has become of great interest as primary phenotypic analysis of muscle performance. This protocol provides detailed procedures to perform the treadmill exhaustion test and the whole-limb grip strength assay, two methods commonly used in the neuromuscular research field.
Keywords: Exhaustion test, Grip strength, Mice, Muscle, Treadmill
Background
Muscle diseases usually lead to alterations in skeletal muscle function. Non-invasive in vivo tests that can evaluate muscle performance are therefore of considerable value as primary phenotypic screening. Here, we describe how to perform the treadmill exhaustion test, which evaluates exercise capacity and endurance, and the limb grip strength assay, which measures muscular strength. In the treadmill exhaustion test, the mice are forced to run to exhaustion over a conveyor belt with gradually increasing speed. The limb grip strength assay uses a horizontal grip–that is grasped by the mouse–to measure the maximum force that is required to make the mouse release it. These tests can be easily customized to evaluate muscle performance under different situations, such as after therapeutic interventions or regeneration ( Benchaouir et al., 2007 ; Puzzo et al., 2016 ), or to study the potential roles of specific genes on muscle physiopathology ( Waning et al., 2015 ; Bi et al., 2016 ; Yue et al., 2016 ).
Materials and Reagents
Record sheet
Appropriate mouse strain and housing facility
Ethanol (70%), or disinfectant wipes, mild solution of detergent and water
Equipment
-
Treadmill exhaustion test
Timer
Plastic tray
Treadmill system: Exer 3/6 treadmill and treadmill controller (Columbus Instruments, model: Exer 3/6) (Figure 1)
Computer and software provided by the manufacturer
-
Whole-limb grip strength assay
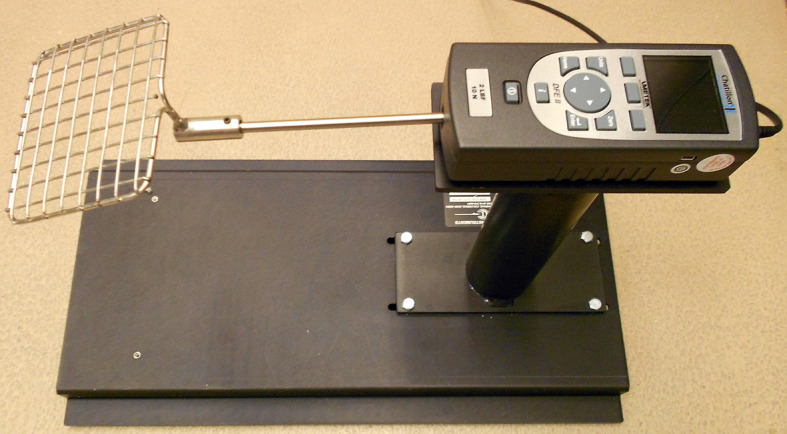
Grip strength meter (Columbus Instruments, model: 1027SM Grip Strength Meter with Single Sensor). The apparatus includes a grid that is connected to a force transducer, a digital display (AMETEK, Chatillon, model: DFE2-002), and a base that elevates it (Figure 2)
Scale
Figure 1. Treadmill system and components.

Figure 2. Grip strength meter.
Software
Treadmill software (Columbus Instruments, OH, USA)
Procedure
-
Treadmill exhaustion test
-
Training
Set the treadmill to desired angle of inclination or declination. In this instrument the angle of inclination is set by the location of the spring pin in holes of the inclination rod. Uphill inclinations (slopes of 10%) are commonly used for this test ( Bi et al., 2016 ; Nie et al., 2016 ; Yue et al., 2016 ). Uphill running involves concentric muscle contraction and increases the muscle work for the animals as compared with running on a flat surface, leading to faster exhaustion. Downhill running may also be used to examine eccentric muscle contraction.
Place a plastic tray underneath the instrument to collect feces and urine that could be produced during the test.
Insert the lane dividers into the slots of the treadmill.
Switch on the treadmill controller.
Adjust the electric shock frequency and intensity (Figure 3A). In this apparatus, the electric stimuli are pulses (200 msec/pulse) of electric current with adjustable pulse repetition rate (1, 2 or 3 times per second, Hz) and intensity (suggested: 3 Hz, 1.22 mA; respectively).
Place the mice on the treadmill belt and cover with the lid.
Turn the shock grids on for each line by setting each toggle switch toward the grids (the stimulus indicator will begin to flash).
Adjust the belt speed to 10 m/min using the ‘speed’ knob located in the treadmill controller. Set the ‘treadmill belt’ toggle switch to ‘run’ (Figure 3B).
Start a timer. Allow mice to run for 5 min.
After this time, set the ‘treadmill belt’ toggle back to ‘stop’.
Disable the shock stimulus for all lanes.
Remove animals and return each mouse to its cage.
Clean the treadmill belt and grid with 70% ethanol and repeat steps A1f to A1l if additional mice have to be trained.
Turn off the machine.
Wash the feces collecting tray and the lane dividers.
Repeat the training session during 3 consecutive days prior to the test.
-
Test
Perform the steps A1a through A1e of the previous section.
-
Turn on the computer and start the treadmill software. Setup a new experiment as follows:
Select ‘Experiment >> Run’ from the main menu.
Click the ‘Profile Mode’ tab at the top of the window.
Use the computer mouse to select the text boxes and enter the corresponding parameters (see Table 1, Figure 4A). In this test, the speed is initially set at 10 m/min for 5 min, and it is increased 2 m/min every 2 min up to a maximum speed of 46 m/min is reached ( Bi et al., 2016 ).
Set the ‘Treadmill belt’ toggle switch to ‘Run’ and enable the electric shock.
Click the ‘Start’ button. A ‘Save Experiment Data File’ window will open (save as a .csv file).
Load the mice into separate lanes on the treadmill belt and then click ‘OK’.
-
Run the experiment until the mice are exhausted or the maximal speed is achieved.
-
When a mouse becomes exhausted, write down the time, speed, and distance that are displayed at that moment on the screen (see Figure 4B) and turn off the shock grid for its lane. Remove the mouse from the treadmill.
There are different ways to define exhaustion and the same criteria must be used throughout the experiment. For example, the exhaustion may be defined as the inability of the animal to run on the treadmill for 10 sec despite mechanical prodding ( Bi et al., 2016 ; Yue et al., 2016 ).
When no mice remain on the treadmill or the maximal speed is reached, stop the experiment and turn off the shock grids.
-
To test additional mice clean the treadmill and grid with 70% alcohol and repeat the described procedure. (Click ‘Load’ in the profile mode screen and select the saved file generated previously in order not to have to enter again all the data manually, then click ‘Start’). Each mouse is tested one time the day after the last training session. We recommend to use at least five animals to ensure high statistical power. Due to potential variances in the sex, age, and genetic background of mice, calculation of the number of animals required for this test should be performed by a power analysis.
-
-
Whole-limb grip strength assay
Place the mice in the testing room for 10 min to acclimate (leave the room during this time).
Put the force meter on a firm, flat surface.
Connect the grid to the digital force gauge and clean it with 70% ethanol or disinfectant wipe.
-
Set up the grip strength meter (GSM):
Turn on the GSM.
Push the bottom under the ‘Mode’ option to select the Peak Tension (T-PK) mode (this displays the peak force applied to the GSM as a result of pulling away from the GSM). Press ‘Home’ to return to the main screen.
Press the ‘Units’ bottom to select the units of force (e.g., Newton, N)
Press ‘Zero’ to tare the GSM.
-
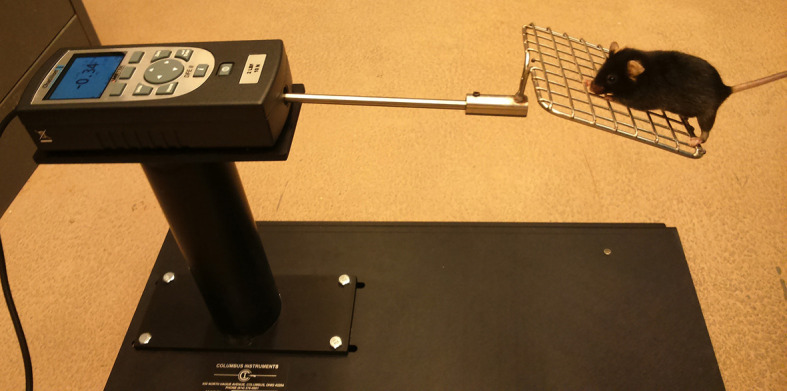
Testing animals (Figure 5):
-
Remove the mouse to be tested from the cage and place it over the top of the grid. Allow the mouse to grasp the grid with all four paws.
The mouse can be held by the base of the tail alone or together with the scruff of the neck when positioning on the grid, be aware of doing it smoothly without pressing down upon the grid.
Keeping the torso of the mouse parallel with the grid, pull gently the animal backwards away from the grid by the tail (pulling along the axis of the GSM). The speed has to be slow enough to let the mouse to develop a resistance against the pulling force.
Record the number (peak force) that is displayed on the screen of the GSM once the mouse releases the grid.
-
Weigh the mouse.
Return the mouse to its cage.
Clean the grid with 70% ethanol.
Tare (zero) the GSM and proceed with the next subject. Each mouse should be tested several times (3-5 times) with at least 1 min resting period between each test.
Figure 3. Electric shock stimulus (A) and speed (B) adjustment using the treadmill controller.

Table 1. Treadmill exhaustion test steps.
| Step | Start Speed m/min | End Speed m/min | Period sec | Shock |
|---|---|---|---|---|
| 1 | 0 | 10 | 120 | False |
| 2 | 10 | 10 | 300 | True |
| 3 | 10 | 12 | 120 | True |
| 4 | 12 | 12 | 120 | True |
| 5 | 12 | 14 | 120 | True |
| 6 | 14 | 14 | 120 | True |
| 7 | 14 | 16 | 120 | True |
| 8 | 16 | 16 | 120 | True |
| 9 | 16 | 18 | 120 | True |
| 10 | 18 | 18 | 120 | True |
| 11 | 18 | 20 | 120 | True |
| 12 | 20 | 20 | 120 | True |
| 13 | 20 | 22 | 120 | True |
| 14 | 22 | 22 | 120 | True |
| 15 | 22 | 24 | 120 | True |
| 16 | 24 | 24 | 120 | True |
| 17 | 24 | 26 | 120 | True |
| 18 | 26 | 26 | 120 | True |
| 19 | 26 | 28 | 120 | True |
| 20 | 28 | 28 | 120 | True |
| 21 | 28 | 30 | 120 | True |
| 22 | 30 | 30 | 120 | True |
| 23 | 30 | 32 | 120 | True |
| 24 | 32 | 32 | 120 | True |
| 25 | 32 | 34 | 120 | True |
| 26 | 34 | 34 | 120 | True |
| 27 | 34 | 36 | 120 | True |
| 28 | 36 | 36 | 120 | True |
| 29 | 36 | 38 | 120 | True |
| 30 | 38 | 38 | 120 | True |
| 31 | 38 | 40 | 120 | True |
| 32 | 40 | 40 | 120 | True |
| 33 | 40 | 42 | 120 | True |
| 34 | 42 | 42 | 120 | True |
| 35 | 42 | 44 | 120 | True |
| 36 | 44 | 44 | 120 | True |
| 37 | 44 | 46 | 120 | True |
Figure 4. Treadmill Software.
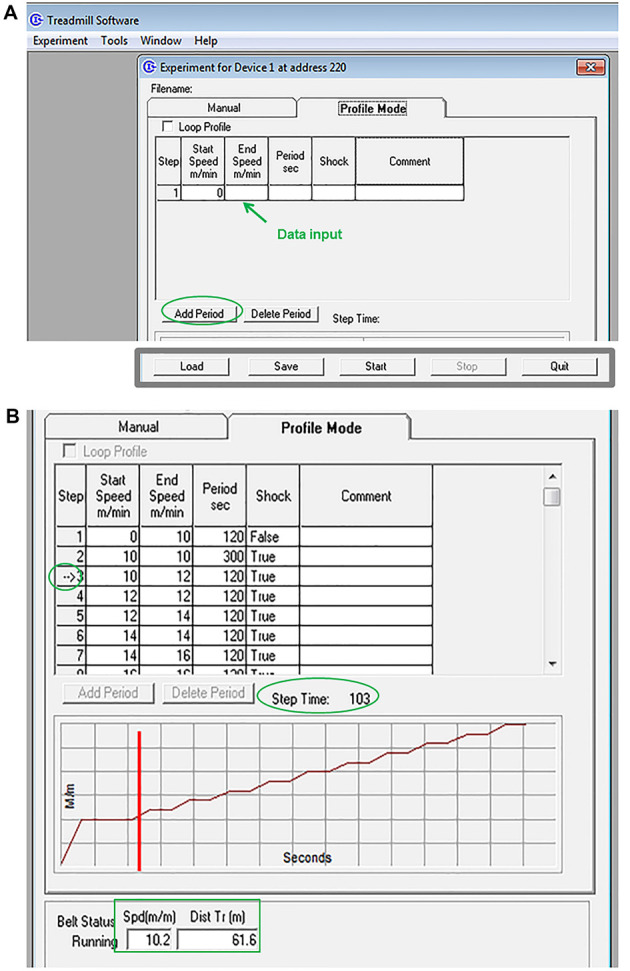
A. Creating a profile. A Treadmill exercise profile is created by selecting the text (white) boxes with the computer mouse and manually entering the corresponding parameters; more steps are added by clicking ‘add period’. This profile can be saved and used later to test other mice. To do this, click ‘Load’ in the profile mode screen and select the saved file. B. Running the experiment. A graphical representation is automatically generated to show the relative speed and time of the entire profile. The vertical red bar in the graph points out the current position, while an arrow within the step column of the profile table marks the step currently in use. Step time: informs about the time remaining within the current step; Spd (m/m): reports the current speed of the treadmill belt; Dist Tr (m): reports the total distance the treadmill belt has moved.
Figure 5. Whole-limbs grip strength measurement.
Data analysis
-
Treadmill exhaustion test
Exercise capacity is commonly evaluated by comparison of both speed and distance values between the animals of interest and their controls, and plotted on a bar graph ( Bi et al., 2016 ).
-
Other parameters such as work and power can additionally be used ( Nie et al., 2016 ). Work and power are calculated as follows:
Work (J) = body mass (kg) x gravity (9.81 m/sec2) x vertical speed (m/sec x angle) x time (sec)
Power (W) = work (J)/time (sec)
-
Whole-limb grip strength assay
The average force (gripping strength) is used for comparison between experimental groups. Sometimes force measurements are not accurate since the animals can release very quickly without exert any resistance or they can have grasp problems. Therefore, it is recommended to use the mean of the best recorded values for data analysis. The results are plotted on a bar graph (Figures 6 and 7A).
It is also common to use the ‘normalized grip force’ for data analysis. This value is obtained by dividing the grip strength mean value with the body weight of each mouse (Figure 7B).
Figure 6. Gripping strength measurement result of limbs from MLC-N1ICD mice and littermate controls.
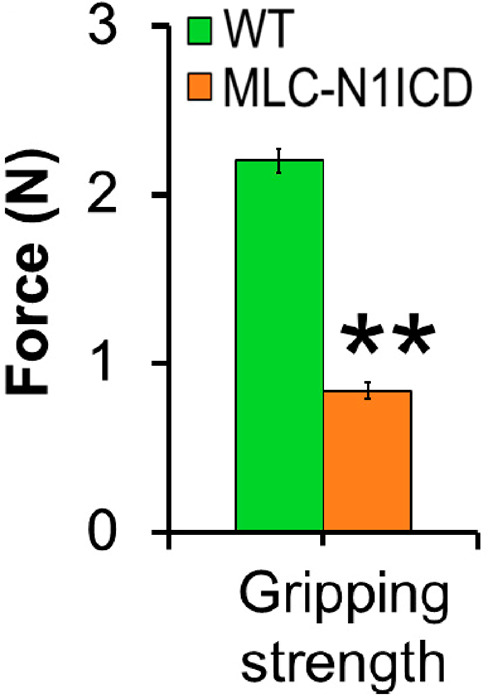
Each mouse was tested three times (n = 3). The average strength was defined as gripping strength. Statistical analysis was conducted with Student’s t-test with two-tail distribution. **P < 0.01. Bar graphs indicate mean SEM (Adapted from Bi et al., 2016 ).
Figure 7. Graphical representation of Force (A) and Normalized force (B) of 3-month old mutant mice versus littermate controls.

Each mouse was tested four times. Data are presented as means ± SE (n = 7).
Notes
-
General
Environmental variables such as light, noise, humidity or temperature, as well as testing time (morning/afternoon) should be kept constant and at appropriate levels for the animals.
-
Treadmill exhaustion test
Training sessions facilitate the animals to become familiar with the apparatus and the test conditions, minimizing the psychological stress and increasing their performance in the task. We recommend using an acclimatizing period of 3 to 10 days. Longer training periods could reduce the willingness of the mice to perform the task and blunt the physiological, molecular and biochemical responses to exercise.
Parameters such as the speed or the duration of the test can be manipulated, resulting in different protocols depending on the objectives to be reached. For example, the effects of aerobic exercise can be evaluated by exercising the animals for 60 min at 14 m/min on a 10% grade, 5 day/week, for 6 weeks ( Nie et al., 2016 ). The modification on the angle of the treadmill would enable the study of the outcomes of uphill (incline-slope, concentric) and downhill (decline-slope, eccentric) running.
Because this test is a form of forced exercise, it usually requires aversive stimuli to keep the animal running. Here, we used electric shock as a noxious stimuli, but different methods (e.g., air puffs or gently encouragement them by using a tongue depressor) can be used. Also, it is important to consider that genetic background, strains, clinical condition, and other intrinsic variables may influence the sensitivity and response of the animal to the stimulus, requiring and adjustment of the intensity of the stimulus.
Physical exercise can exacerbate the clinical condition of some animal models–like mdx mice–especially during the test, where the animals are exposed to high speeds for long periods of time. Animal models with a weak physical condition may require milder test conditions (using lower uphill slopes and reducing the rate of speed increments, for example).
-
Whole-limb grip strength assay
Besides environmental factors, it is also important to keep the same operator for all experimental groups under study in order to decrease inter-subject variability (preferably in a blinded fashion).
Check the toes of the mice to make sure there are no visible wounds on them before test.
This grip test is used to measure the muscle strength of combined forelimbs and hind limbs. The same procedure can be used to test the forelimbs strength alone, allowing the mouse to grasp the grid only with the forelimbs.
Acknowledgments
This protocol has been adapted from our previous work published in Elife ( Bi et al., 2016 ) and Cell Reports ( Yue et al., 2016 ) and partially supported by a grant from United States National Institutes of Health to SK (1R01AR071649). Beatriz Castro acknowledges support from the Alfonso Martin Escudero Foundation.
Citation
Readers should cite both the Bio-protocol article and the original research article where this protocol was used.
References
- 1.Benchaouir R., Meregalli M., Farini A., D'Antona G., Belicchi M., Goyenvalle A., Battistelli M., Bresolin N., Bottinelli R., Garcia L. and Torrente Y.(2007). Restoration of human dystrophin following transplantation of exon-skipping-engineered DMD patient stem cells into dystrophic mice. Cell Stem Cell 1(6): 646-657. [DOI] [PubMed] [Google Scholar]
- 2.Bi P., Yue F., Sato Y., Wirbisky S., Liu W., Shan T., Wen Y., Zhou D., Freeman J. and Kuang S.(2016). Stage-specific effects of Notch activation during skeletal myogenesis. Elife 5. [DOI] [PMC free article] [PubMed] [Google Scholar]
- 3.Nie Y., Sato Y., Wang C., Yue F., Kuang S. and Gavin T. P.(2016). Impaired exercise tolerance, mitochondrial biogenesis, and muscle fiber maintenance in miR-133a-deficient mice. FASEB J 30(11): 3745-3758. [DOI] [PMC free article] [PubMed] [Google Scholar]
- 4.Puzzo D., Raiteri R., Castaldo C., Capasso R., Pagano E., Tedesco M., Gulisano W., Drozd L., Lippiello P., Palmeri A., Scotto P. and Miniaci M. C.(2016). CL316,243, a β3-adrenergic receptor agonist, induces muscle hypertrophy and increased strength. Sci Rep 5: 37504. [DOI] [PMC free article] [PubMed] [Google Scholar]
- 5.Waning D. L., Mohammad K. S., Reiken S., Xie W., Andersson D. C., John S., Chiechi A., Wright L. E., Umanskaya A., Niewolna M., Trivedi T., Charkhzarrin S., Khatiwada P., Wronska A., Haynes A., Benassi M. S., Witzmann F. A., Zhen G., Wang X., Cao X., Roodman G. D., Marks A. R. and Guise T. A.(2015). Excess TGF-β mediates muscle weakness associated with bone metastases in mice. Nat Med 21(11): 1262-1271. [DOI] [PMC free article] [PubMed] [Google Scholar]
- 6.Yue F., Bi P., Wang C., Li J., Liu X. and Kuang S.(2016). Conditional loss of pten in myogenic progenitors leads to postnatal skeletal muscle hypertrophy but age-dependent exhaustion of satellite cells. Cell Rep 17(9): 2340-2353. [DOI] [PMC free article] [PubMed] [Google Scholar]