

Abstract
Overweight and obesity result from an imbalance between caloric intake and energy expenditure, including expenditure from spontaneous physical activity (SPA). Changes in SPA and resulting changes in non-exercise activity thermogenesis (NEAT) likely interact with diet to influence risk for obesity. However, previous research on the relationship between diet, physical activity, and energy expenditure has been mixed. The neuropeptide orexin is a driver of SPA, and orexin neuron activity can be manipulated using DREADDs (Designer Receptors Exclusively Activated by Designer Drugs). We hypothesized that HFD decreases SPA and NEAT, and that DREADD-mediated activation of orexin neuron signaling would abolish this decrease and produce an increase in NEAT instead. To test these ideas, we characterized behaviors to determine the extent to which access to a high-fat diet (HFD) influences the proportion and probability of engaging in food intake and activity. We then measured NEAT following access to HFD and following a DREADD intervention targeting orexin neurons. Two cohorts of orexin-cre male mice were injected with an excitatory DREADD virus into the caudal hypothalamus, where orexin neurons are concentrated. Mice were then housed in continuous metabolic phenotyping cages (Sable Promethion). Food intake, indirect calorimetry, and SPA were automatically measured every second. For cohort 1 (n=8), animals were given access to chow, then switched to HFD. For cohort 2 (n=4/group), half of the animals were given access to HFD, the other access to chow. Then, among animals on HFD, orexin neurons were activated following injections of clozapine n-oxide (CNO). Mice on HFD spent significantly less time eating (p<0.01) and more time inactive compared to mice on chow (p<0.01). Following a meal, mice on HFD were significantly more likely to engage in periods of inactivity compared to those on chow (p<0.05). NEAT was decreased in animals on HFD, and was increased to the NEAT level of control animals following activation of orexin neurons with DREADDs. Food intake (kilocalories) was not significantly different between mice on chow and HFD, yet mice on chow expended more energy per unit of SPA, relative to that in mice consuming HFD. These results suggest that HFD consumption reduces SPA and NEAT, and increases inactivity following a meal. Together, the data suggest a change in the efficiency of energy expenditure based upon diet, such that SPA during HFD burns fewer calories compared to SPA on a standard chow diet.
Keywords: spontaneous physical activity (SPA), non-exercise activity thermogenesis (NEAT), high-fat diet, orexin, designer receptors exclusively activated by designer drugs (DREADDs)
1. Introduction
Overweight and obesity result from imbalance between caloric intake and energy expenditure, including energy expended as part of basal metabolic rate (BMR), the thermic effect of food (TEF), and activity thermogenesis (AT; [1]). Inter-individual variability in total daily energy expenditure among people of similar body weights is primarily explained by variations in AT, which includes both exercise thermogenesis and non-exercise activity thermogenesis, or NEAT [1]. While human exercise is typically thought of as a chosen or purposeful physical activity, there is also non-exercise physical activity, known as spontaneous physical activity, or SPA, which includes all activity not specifically undertaken for chosen exercise [1]. In humans, SPA therefore includes unconscious, nonvolitional movements, such as increased drive to stand and walk, gesticulating, and fidgeting [2]. The NEAT that results from these activities represents EE produced by physical activity excluding exercise, and can vary up to 700 kCal per day [1, 3].
Underlying neural mechanisms for exercise and SPA likely differ, with exercise primarily mediated by higher-level cortical function and SPA by more primitive brain areas such as the hypothalamus. Several neuropeptides have been implicated in mediating changes in SPA, including orexin-A, agouti-gene-related protein (AgRP), ghrelin, and neuromedin U (NmU). For a review of their role in SPA and NEAT, see Kotz et al. 2007 [2]. Extensive research has been conducted to characterize the role of the neuropeptide orexin in facilitating SPA. Located within the lateral, dorsomedial, and perifornical hypothalamic regions, orexin neurons project widely throughout the brain and make synaptic contacts with other systems in brain regions implicated in motor activity, energy expenditure, and arousal [2]. Targeted experiments have demonstrated a specific role for lateral hypothalamic orexin neurons in SPA [4–6]. We have shown that direct infusions of orexin into the rostral lateral hypothalamus (rLH) produces robust increases in SPA [5], whereas infusions of GABA receptor agonists into this area inhibit the effects of orexin on SPA [7]. Orexin administration into several other orexin target sites also produces SPA [2], and can be blocked with the orexin 1 receptor antagonist, SB334867 [4, 5, 7].
Animal models of SPA typically include measurements of all activity within a dedicated space that allows for complete freedom of movement, such as those used to measure anxiety-like behaviors (i.e., open field testing apparatus), or within a home cage-like environment in which animals can interact with the environment (e.g., bedding, food and water hoppers etc.; [2]). Spontaneous physical activity can then be measured through video recording, telemetry, or infrared beams [2]. To measure changes in BMR and NEAT, simultaneous measurement of physical activity and calorimetry is needed, with BMR calculated at rest and NEAT calculated during activity.
Total physical activity throughout the day, and SPA in particular, may be affected by the type of diet available [8]; however, studies investigating the effects of diet type on changes in SPA have yielded contradictory results. For example, several studies have shown a decrease in physical activity during exposure to high-fat diet (HFD), with others showing the opposite effect, suggesting this relationship may be complex [9–14]. Similarly, total EE may also be affected by the type of diet available, with studies showing both increases and decreases in energy expenditure in animals with access to HFD compared to chow and low-fat diets [9, 14, 15]. In addition, there have been no studies to date which have assessed the effect of chow-feeding vs. HFD specifically on NEAT, which is important for understanding the diet-based relative contribution of SPA to energy expenditure.
In the present study, we sought to characterize changes in NEAT and SPA in animals with access to HFD, using highly sensitive indirect calorimeters, which simultaneously record energy expenditure, physical activity and interactions with food and water hoppers continuously. These variables were continuously recorded for 10 consecutive days, with breaks in measurement only occurring during body weight collection, manual food intake measurements, and injections (~30 min per day). This allowed for a very thorough and precise measurement of energy expenditure and the temporal relationship between changes in total EE and behaviors within the cages, without having to move the animals in and out of their home cages. The potential for orexin to therapeutically enhance NEAT was then investigated by activating orexin neurons using the DREADD approach. This particular technique was used for the precise targeting and activation of the orexin neuronal field [16]. Compared with previous work of targeted infusions of orexin and/or orexin agonists into the brain, the use of DREADDs allows for the sustained activation of these neurons on the order of hours without needing to inject directly into the brain [17, 18]. Instead, activation of orexin neurons occurs following peripheral administration of clozapine-N-oxide (CNO), the designer drug portion of the DREADD, which is otherwise biologically inert. In addition, the DREADD approach allows for a within subjects design, ideal for investigating SPA, which is inherently variable between individuals [19]. We hypothesized that HFD exposure would increase the probability of physical inactivity in a behavioral analysis, while orexin neuron activation would restore the inactivity probability to pre-diet levels.
2. Materials and methods
2.1. Animals
Male (n = 16) orexincre heterozygous mice with a C57/B6J background, aged 8 weeks, were used in these studies, as described previously [20]. Prior to their use in a different study, these animals were evaluated for baseline differences in SPA, NEAT, and food intake on HFD or chow and their results are presented herein. Also presented are the effects of chronic orexin neuron activation via DREADDs on NEAT in animals on HFD. Prior to their use in the present study, animals were group housed (4/cage) and maintained on a 12 h light/dark cycle in solid bottom cages with corn-cob bedding in a temperature controlled room (21–22 °C). Rodent chow (Harlan Teklad 8604) and water were allowed ad-libitum. The Institutional Animal Care and Use Committee at the Minneapolis VA Health Care System approved all studies.
2.2. Viral Injections and Drug Administration
Animals were anesthetized with Ketamine (70 mg/kg) and Xylazine (7 mg/kg) and placed in a stereotactic apparatus (Kopf Instruments). DREADD targeting was achieved by stereotaxic injection of a Cre-dependent AAV vector expressing double-floxed inverted open reading frame (DIO) around the DREADD transcript and fluorescent tag, all under control of Elongation Factor 1-alpha (EF1alpha) promoter (Figure 1A). Vectors (University of North Carolina Gene Therapy Core) were injected into the LH (AP-1.8/DV-5.0/ML+/−0.8 mm from bregma; 333 nl/5min) of orexin-cre mice (Figure 1B). Excitatory neuromodulation was achieved via the Gq-coupled AAV2-EF1a-DIO-hM3Dq-mCherry (1.4×10¹² v.u./ml). Animals recovered from the surgery for at least two weeks prior to testing, and received injections (2/day) of flunixin (25mg/ml) for 3 days post op. Clozapine-N-Oxide (CNO; diluted in saline; 5 mg/kg; 0.1ml/20g mouse; IP; Enzo Life Sciences, Farmington, New York), was injected via a small gauge 3/10CC insulin syringe once per day 5 h post-lights-ON (Light Cycle) for 10 consecutive days.
Figure 1.
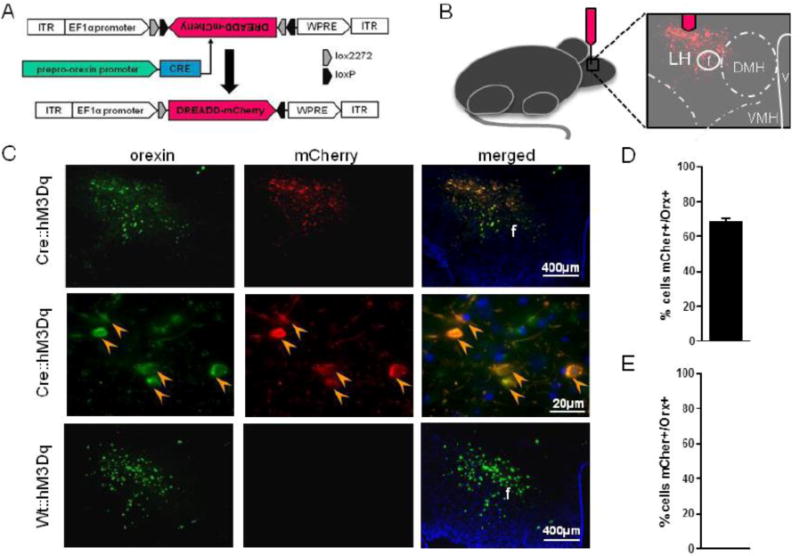
Cre-dependent genetic targeting of orexin neurons. (A) Schematic diagram of AAV vector encoding DREADD-mCherry driven by Elongation factor alpha (EFa1) promoter sequence and flanked by dual flox sites for recombination in the presence of Cre-recombinase. Cre is driven by the prepro-orexin-promoter of Orexin:Cre mice. (B) Schematic of anatomical targeting with stereotactic viral infusion. Photomicrographs of coronal sections containing immunofluorescent orexin neurons (green) and hM3Dq-mCherry (red; C). Percent of orexin neurons expressing mCherry (orange arrow head) in Cre::hM3Dq (D) and Wt::hM3Dq (E) mice.
2.3 Histology
DREADD expression in orexin neurons within the LH was verified in a separate cohort of adult male and female orexin-cre (Cre) or wildtype (Wt) mice that received bilateral injections of AAV2-EF1a-DIO-hM3Dq-mCherry (hM3Dq) aimed at the caudal lateral LH. Mice were perfused with ice-cold saline and 4% buffered formaldehyde. Brains were extracted, postfixed overnight and then cryoprotected with ~10% sucrose in 3% formaldehyde (replaced 1/3 of fix with 30% sucrose solution). Brain sections (40 um, sliced on vibratome) were incubated with blocking solution (0.01M PBS, 3% Normal Horse Serum; 0.05% Tween20) for 2 h at room temp. Slices were transferred to goat anti-orexin antibody (1:1000, SantaCruz) and rabbit anti-mCherry antibody (1:2000, Abcam) for 72h at 4°C. The slices were then washed six times (20min each, at RT) in wash buffer and next incubated with 488-conjugated donkey anti-goat IgG antibody and Cy3-conjugated donkey anti-rabbit IgG (1:1000, Jackson ImmunoResearch) overnight at 4°C. Slices were washed five times (20 min each at RT) in wash buffer and one time in 0.01M PBS before being mounted (GoldBio ProLong/Antifade with DAPI mounting media). Semiquantitative cell counts were collected using the classic visual enumeration technique aided by software algorithms for image processing and counting. Digital images were acquired with a Leica SPE3fluorescent microscope and the Leica Application Suite (LAS 3.3.1 build 8976). Bilateral images were collected from every sixth slice containing the lateral hypothalamus. Using Imaris 8.0 Spot Function software, fluorescent soma and/or nuclei were identified by size (12 um and 7 um, respectively) and intensity (difference from background). Colocalization was determined by an experimenter and was based on overlapping or adjacent spots. Spots were counted using the internal Spot Function algorithms of the Imaris 8.0.
Histological analysis of LH tissue confirmed selective expression of hM3Dq-mCherry in orexin neurons (Figure 1C). Low magnification images capture nearly the entire orexin neuron field and show clear colocalization between immunoreactive channels labeling orexin (green) and hM3Dq-mCherry (red; Figure 1C). High magnification images show expected cytoplasmic labeling of mCherry and orexin (orange arrowheads, middle row; Figure 1C). Our approach infected 69.9% ± 3.2 of orexin neurons in orexin-cre mice (Fig. 1D). mCherry staining was absent in Wt::hM3Dq controls (Figure 1E).
2.4. Apparatus
At the start of the experiment, animals were housed individually in metabolic phenotyping chambers (Mouse Promethion Continuous caging system; Sable Systems™, Las Vegas, NV) and maintained on a standard 12 h light/dark cycle. This system consisted of 8 metabolic cages, which were identical to home cages with bedding. Each cage was equipped with food and water hoppers connected to inverted laboratory balances for water and food intake monitoring; both food and water were available ad-libitum. SPA was quantified via infrared beam breaks in three axes: X+Y+Z, and included locomotion, rearing, and grooming behaviors, with beam breaks spaced 0.25cm apart (BXYZ-R, Sable Systems™, Las Vegas, NV). The sensor technology used to monitor food and water uptake, position within the cage, and activity, occurred at an extremely high frequency, such that each interaction of every animal with every sensor was paired precisely in time, with all raw data from all sensors and analyzers stored every second. Air within the cages was sampled through micro-perforated stainless steel sampling tubes located around the bottom of the cages, above the bedding. Ambient air was passed through the cages (2 L/min) and gases were sampled continuously for each cage, from multiple points within the cage (250 ml/min). Specifically, in contrast to other commonly used systems that require sealed cages, the Sable Promethion System uses continuous air-flow sampling, which allows for the acquisition of metabolic data every second, for all cages in the system simultaneously [21].
2.5. Food intake, SPA, and NEAT procedure
Two separate cohorts of mice were analyzed for changes in food intake, SPA and NEAT in response to a standard chow diet (3.0 kcal/g; 14% calories from fat, 32% calories from protein, 54% calories from carbohydrates; Harlan Teklad Rodent Diet) or high-fat diet (4.73 kcal/g; 45% calories from fat, 20% calories from protein, 35% calories from carbohydrates; Research Diets). In the first cohort of animals (n = 8), mice received chow for 10 days and were then switched to high-fat diet for another 10 days. In contrast, in the second cohort of animals, half of the mice were given access to high fat diet (n = 4), while the other half was given access to chow (n = 4) for 10 days. Cohort two was then further evaluated for changes in NEAT following orexin neuron activation for an additional 10 days, as described in section 2.2. Specifically, comparisons were made between animals on chow and those on HFD with or without CNO administration. The chow and HFD groups were evaluated simultaneously for the effects of diet on energy expenditure and other behaviors within the cage. Following this period (10 days), the HFD group was then injected with CNO for an additional 10 days to evaluate the effects of orexin neuron activation on energy expenditure. These two cohorts allowed for an in-depth examination of behavioral and metabolic changes in response to access to a high-fat diet. Specifically, cohort #1 was designed to evaluate within animal differences in how behaviors are allocated throughout the day when animals are switched from chow to HFD. In contrast, cohort #2 allowed us to examine the therapeutic potential of DREADDs to activate orexin neurons as a way to increase energy expenditure in the presence of HFD. Both cohorts received injections of the DREADD virus, prior to behavioral testing.
2.6. Data analysis
2.6.1. Probability Matrix
Raw data were collected by SableScreen v2.2 every sec and extracted using Expedata v1.8.2 (SableSystem™). Indirect calorimetry was calculated using the respiratory quotient, Vmax O2/Vmax CO2, and converted to kCal. Data were then analyzed within Expedata by applying an advanced transformation, known as EthoScan, to the data to create a probability matrix for behaviors. This probability matrix calculated the percentage of time spent engaged in one of these behaviors in a 24-hour period compared to total time in all possible behaviors, and calculating the percent time spent in each behavior of interest. Behaviors were organized into food intake, water intake, and the absence of behavior (e.g., long lounge and short lounge). This contrasts with measuring physical activity, which would by definition include interactions with food and water hoppers, and thus redundant measures of activity. The following behavioral categories were used for analyses within this study: short lounge (the absence of movement lasting from 1–60 sec), long lounge (the absence of movement for more than 60 sec), food intake (removal of food from the hopper as indicated by a standard deviation of 0.05), and water intake (removal of water from the bottle as indicated by a standard deviation of 0.02). Paired t-tests were used to compare the probability of engaging in food intake, long lounge, and short lounge, in animals that first had access to chow diet and then were switched over to high-fat diet (Cohort #1) across the 10 days of each phase. Ethoscan also divided behaviors that took place within the Sable Promethion caging system into several categories and calculated the probability these behaviors would occur prior to or immediately after one another, expressed as a percentage of total time in a 24 h period that the mouse would engage in a particular activity. These analyses were conducted for animals in Cohort #1. Paired t-tests were then used to analyze the percent time in 24 hours that mice spent inactive (long lounge + short lounge) following a bout of eating, during the 10 days with chow compared with high-fat diet for the subsequent 10 days.
For Cohort #2, the percent time spent inactive and engaging in food intake was compared between mice with access to chow and those with access to HFD. Short lounge and long lounge were combined as a measure of inactivity for Cohort #2 due to a lack of difference in short lounge in Cohort #1 and the relatively small contribution of short lounge to overall inactivity (<2%). Two-way repeated-measures ANOVAs were then used to analyze the percent time in 24 hours that mice spent inactive or eating, across 10 days in animals given access to chow or HFD. Figure 2 outlines the experimental timelines for both cohorts 1 and 2.
Figure 2.
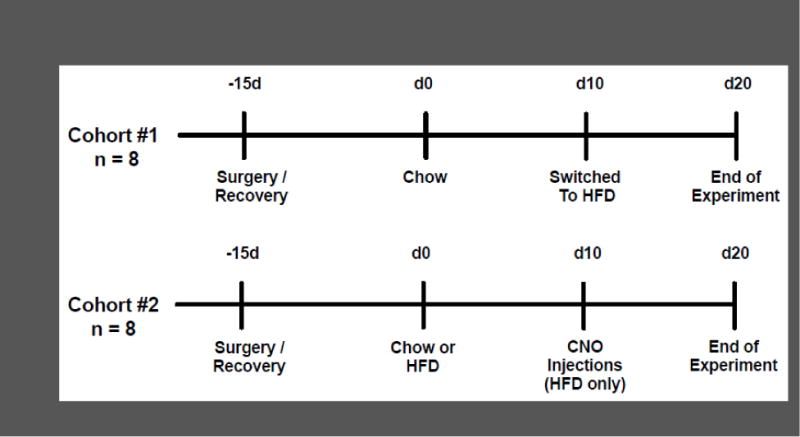
Experimental timeline. Cohort 1 was injected with the DREADD virus and then allowed 2 weeks to recover. All animals (n = 8) were then placed on chow for 10 days, and then switched to high-fat diet (HFD) for another 10 days. Cohort 2 was injected with the DREADD virus and then allowed 2 weeks to recover. Half of the animals (n = 4) were fed chow and the other half fed HFD (n = 8) within the Sable cages for 10 days. The animals on HFD (n = 4) were then injected with CNO daily, for 10 days.
2.6.2. NEAT and SPA
Total energy expenditure (TEE) was based on the Weir equation, and calculated hourly as kcal/hr = 60*(0.00394*Vo2 + 0.001106*VCo2) [22]. Hourly TEE was then divided by 2 to arrive at the TEE every 30 minutes (TEE-30). Basal metabolic rate (BMR) was calculated as the TEE during the 30 minutes of least activity for each day. From there, NEAT was calculated by subtracting BMR from each TEE-30, which resulted in calculations of NEAT every 30 minutes [1, 23]. This was repeated every day, so that the current day’s BMR was subtracted from TEE-30 (every 30 minutes). We then took the mean +/− SEM of NEAT, every 30 minutes, across all 10 days of treatment for Cohort #2. We then accounted for differences in body composition between mice on HFD and chow by dividing the NEAT score for each animal by the lean mass (LM) of that animal (NEAT = NEAT/LM). Direct measurements of total body fat, lean mass, free water, and total body water were collected from live animals via ultrasound-based NMR (EchoMRI™, Houston, TX).
These data were analyzed using two-way repeated-measures ANOVAs, comparing the mean change in NEAT between animals with access to chow or high-fat diet, every 30 minutes, averaged over 10 days. Data were then also analyzed as cumulative changes in NEAT every 30 minutes. Two-way ANOVAs were similarly used for these analyses. Holm-Sidak’s test for multiple comparisons was applied post-hoc to determine differences between chow and high-fat diet groups for changes in NEAT over ~23 hours. Then, following daily CNO administration, cumulative and daily changes in NEAT in animals on HFD were similarly compared against the 10 days with no injections in the HFD group. We then determined the ratio between NEAT and SPA for the animals by calculating the mean total NEAT for each animal over the testing period and dividing it by the mean total SPA for each animal over this period to assess the efficiency of calorie burning. Unpaired t-tests were then used to compare the mean NEAT/SPA ratio between chow and HFD, with paired t-tests used to compare the ratio of NEAT to SPA in animals during HFD and HFD+CNO. Total food intake was recorded each day and was compared between the animals on chow and HFD, expressed as a 23 h mean (kCals) of all 10 days. These data were analyzed using unpaired t-tests. Paired t-tests then compared total food intake in animals during HFD and HFD+CNO. Lastly, the mean speed of SPA, defined as meters/second, across the entire baseline and treatment phases, was compared between the chow and HFD groups using unpaired t-tests and within the HFD during and prior to CNO injections. For clarity and easy interpretation of effects, Figures 5–7 depict changes in NEAT, the ratio of NEAT to SPA, and SPA Speed for all three groups in the same graph, despite the use of between subjects comparisons for the chow and HFD groups and separate within subjects comparisons for analyses of HFD and HFD+CNO.
Figure 5.
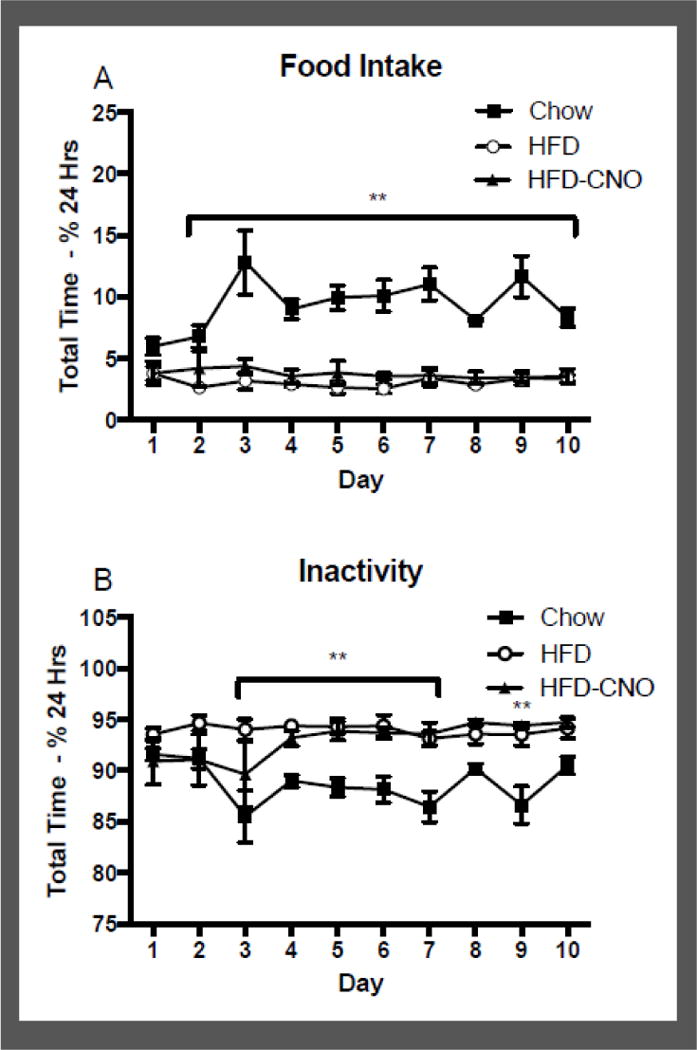
Mean +/− SEM time spent engaging in food intake (panel A) or inactivity (panel B) in animals with access to high-fat diet (HFD; n=4) or chow (n=4),, expressed as a percentage of total time in a 24 h period, for 10 total days. Also shown is the time spent engaging in food intake or inactivity for animals on high-fat diet (n=4) during the subsequent 10 days of CNO injections. **p<0.01 difference between HFD and chow for the indicated days.
Figure 7.
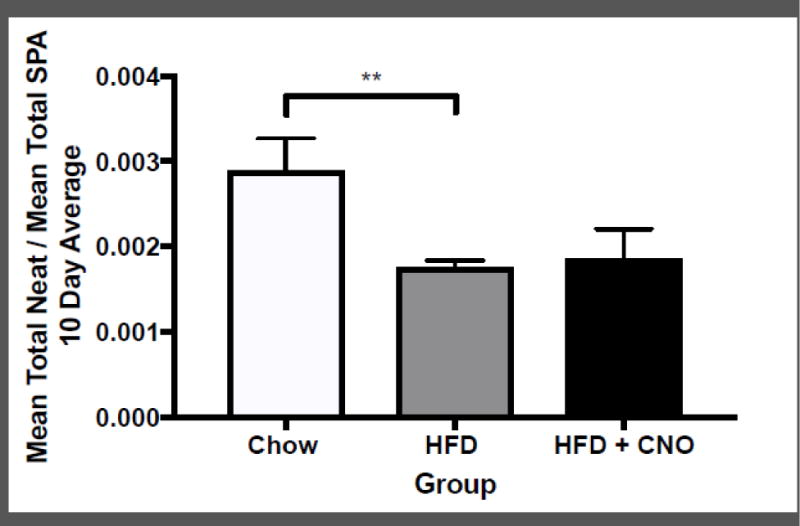
Mean +/− SEM ratio of NEAT to SPA, presented as the mean across all 10 days of testing, for animals on high-fat diet (HFD; n = 4), chow (n = 4), and HFD+CNO (n = 4). The ratio was calculated as the mean total NEAT (total energy expenditure of SPA / lean mass) divided by the mean total SPA (meters traveled) for each animal across 10 days of testing. ##p < 0.05 difference between chow and HFD.
3. Results
3.1. Probability Matrix
Figure 3 shows the changes in the time spent eating and time inactive among mice consuming chow that were switched to HFD. Inactivity was separated into short (<60 sec) and long (>60 sec) bouts. Figure 3 shows the mean percent time: 1). spent eating (panel A); 2) being inactive for a short bout (panel B); and 3) being inactive for a long bout (panel C) within a 24 h period and presented as a mean for all 10 days of testing for animals on a HFD or chow. There was a significant difference between percent time spent eating when animals were exposed to chow compared to HFD when data were pooled across all 10 days, with chow animals spending more time eating compared to HFD (t(7) = 10.2; p < 0.01). While there was no difference in percent time spent in short bouts of inactivity between the chow and HFD (t(7) = 0.3; ns), there was a significant increase in long bouts of inactivity in animals on HFD, compared to chow (t(7) = 6.3; p < 0.01).
Figure 3.
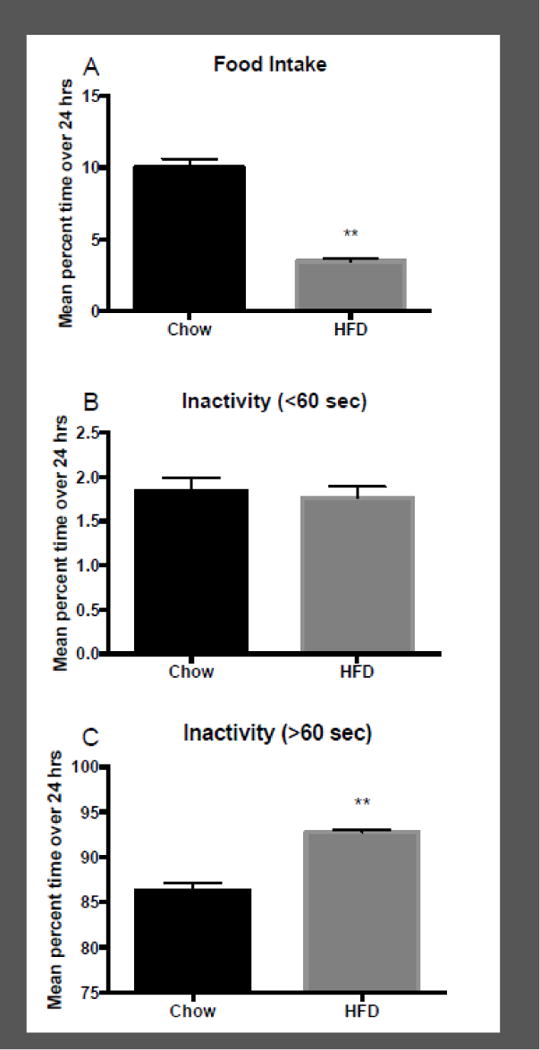
Mean +/− time spent engaging in food intake (panel A), short bouts of inactivity (panel B), and long bouts of inactivity (panel C) expressed as a percentage of total time in a 24 h period, averaged across all 10 days of access to chow and all 10 days of access to high-fat diet (HFD; n = 8). **p < 0.01 difference between chow and HFD.
This shift toward time spent inactive when animals were given HFD was further explored by analyzing the probability that they would remain inactive for short and long periods of time following a bout of food intake. Mean food intake during chow (M = 10.74 kCal +/− SEM = 0.27) was compared with subsequent food intake with HFD (M = 10.34 kCal +/− SEM = 0.66), and no differences were found between the groups for total intake (data not shown). There was however, an increase in food intake on day 1 of access to HFD (M = 13.98 kCal +/− SEM = 2.14) compared to the final day with access to chow (M = 11.47 kCal +/− SEM = 0.66), indicating an initial escalation of food intake upon immediate access to HFD. Figure 4 depicts the mean probability that an animal would engage in inactivity (>/< 60 sec) following food intake, expressed as the percentage of total time in a 24 h period. There was significantly greater probability of short bouts of inactivity following food intake on chow compared to HFD (t(7) = 4.2; p < 0.01). In contrast, there was a significantly greater probability that animals on HFD would engage in a long bout of inactivity after eating, compared with chow (t(7) = 4.2; p < 0.01). These results indicate that there is a shift in the likelihood of being physically active following a meal that is dependent on type of diet available.
Figure 4.
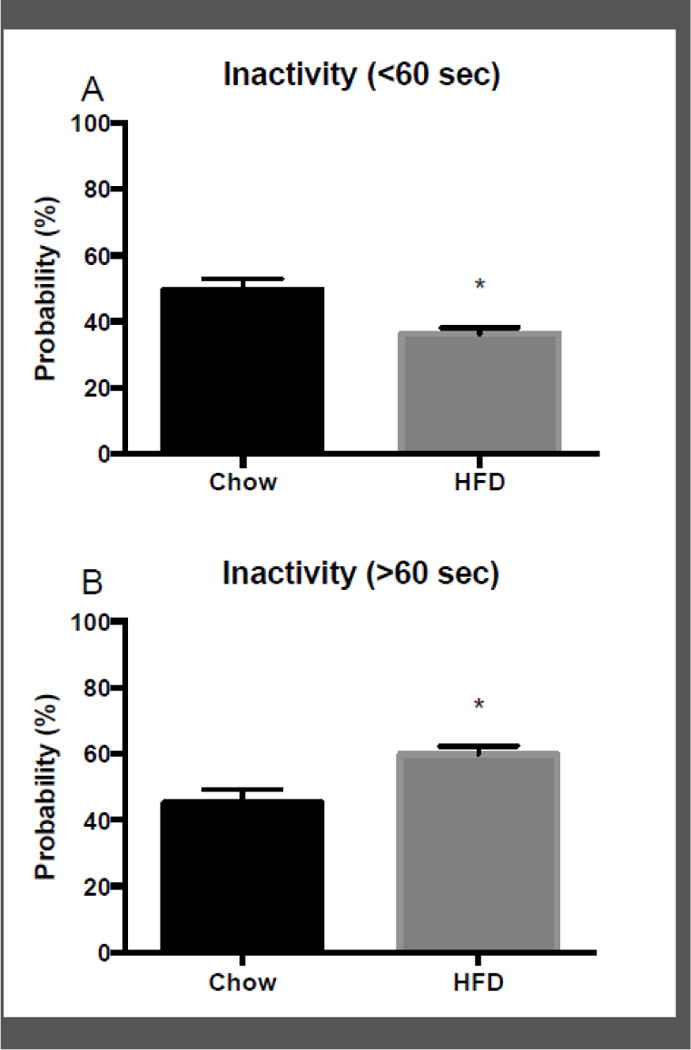
Mean +/− SEM probability, expressed as a percentage of total time in a 24 h period, that a mouse would engage in long (panel A) and short (panel B) bouts of inactivity following a bout of food intake, averaged across all 10 days of access to chow and all 10 days of access to high=fat diet (HFD). **p < 0.01 difference between chow and HFD. *p < 0.05 difference between chow and HFD.
Figure 5 shows the mean percent time in a 24 h period across 10 days spent eating food (panel A) or remaining inactive (panel B), in animals on HFD or chow (Cohort #2). There was a significant effect of diet type on percent time spent eating (F(1,6) = 83.44; p < 0.001), with a significant decrease in percent time eating in animals on HFD for days 2–10, compared to chow. Within subjects comparisons revealed no difference in the HFD group following injections of CNO (F (1,6) = 1.35; ns), indicating that injections of CNO did not facilitate a redistribution of percent time spent engaged in food intake. Animals on chow spent between 6.0 and 12.8% (min – max) of their time eating, compared to time spent eating for animals on HFD (2.5 and 3.8%; min – max) and HFD+CNO (3.40 and 4.34%; min – max). The lesser time eating on HFD is likely due to the increased caloric intake per bout of food intake in HFD animals. There was a significant effect of diet type on percent time spent inactive (F(1,6) = 31.91; p < 0.01), with significant increases in percent inactive time in HFD animals compared to chow for days 3–7, and day 9. Specifically, animals on chow spent between 85.5 and 91.6% (min – max) of their time inactive, compared to animals on HFD that were inactive for between 93.1 and 94.6% (min – max) of the time. There was no significant change in time spent inactive in HFD mice, following injections of CNO (F (1,6) = 2.91; ns), with the HFD+CNO mice spending between 89.65 and 94.46% (min – max) of their time inactive. Combined, these results indicate the activation of orexin neurons via CNO administration did not alter the percent time the animals spent eating or inactive.
Mean food intake (kCal) for the HFD (M = 8.85 kCal +/− SEM = 1.05) and chow (M = 10.21 kCal +/− SEM = 0.47) groups across all 10 days was also compared during this time. There was no significant difference in mean food intake between the two groups during this period (data not shown), suggesting that diet-induced thermogenesis did not contribute to the differences in NEAT between groups. While there was a significant increase (p < 0.01) in food intake on the first day of access to HFD (M = 13.83 kCal +/− SEM = 0.98) compared to chow (M = 5.23 kCal +/− SEM = 0.36), indicating initial hyperphagia in the HFD group, this was compensated for later on through a reduction in total caloric intake (day 10 mean: 6.37 kCal +/− 1.32). Intake for the HFD group was not significantly greater than chow on any other day. Similarly, there was no difference in mean food intake in animals on HFD when they received CNO (M = 9.83 kCal +/− SEM = 0.49), indicating that orexin activation with CNO did not affect food intake.
3.2. NEAT and SPA
Figure 6 shows the mean 10-day total NEAT/lean mass every 30 minutes for animals during chow, HFD, and HFD with CNO injections (panel A), as well as the cumulative NEAT/lean mass every 30 minutes during chow, HFD, and HFD with CNO injections (panel B). There was a significant effect of diet (i.e., chow, HFD) on NEAT (F(1,62) = 14.8; p < 0.01), and a significant effect of time on NEAT (F(43,2666) = 43.1; p < 0.001), with a significant diet by time interaction (F(43,2666) = 2.75; p <0.001). Post hoc tests revealed a significant decrease in NEAT in HFD animals during periods of the dark cycle compared to chow. To further explore this difference, cumulative changes in NEAT were analyzed. There was also a significant effect of time on NEAT (F(43,2666) = 885.0; p < 0.001), and diet (F(1,62) = 4.15; p<0.05), and a significant treatment by time interaction (F(43,2666) = 11.49; p < 0.001). Post hoc tests revealed a significant decrease in NEAT on HFD in the final 5 hrs of the day compared to chow, indicating that daily NEAT was decreased in animals consuming HFD. Important to note is that part of this reduced NEAT on HFD is related to less time spent engaging with the food hopper, which would contribute to SPA and NEAT.
Figure 6.
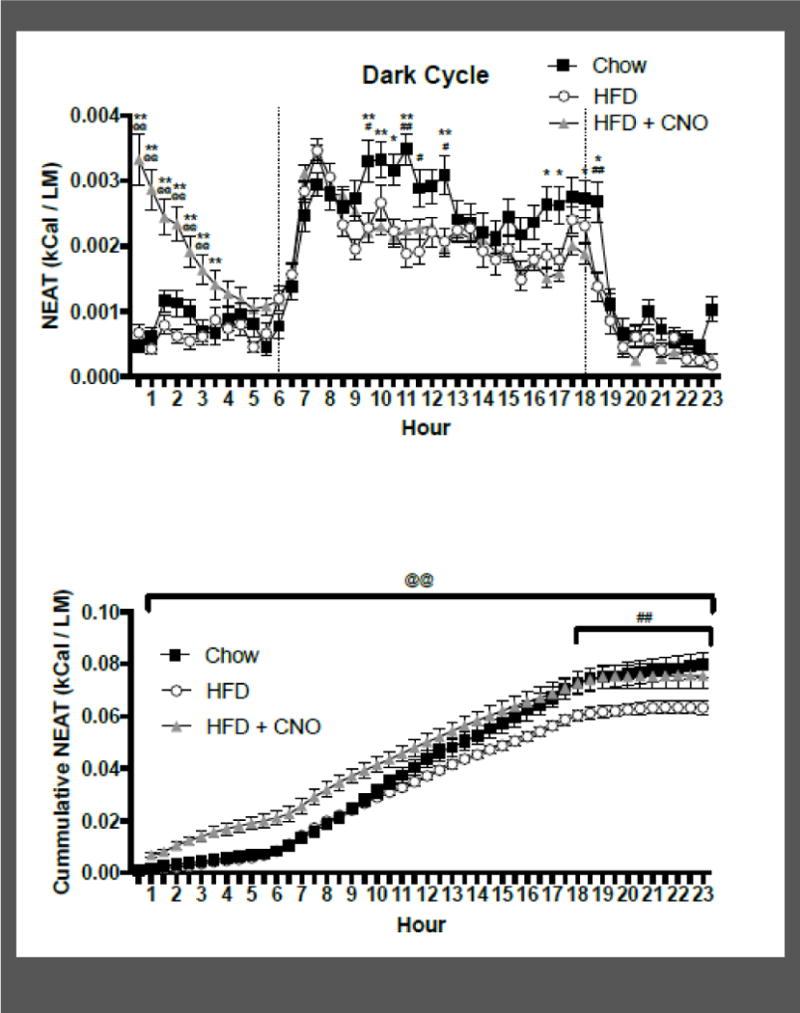
Mean +/− SEM energy expenditure of SPA every 30 minutes averaged across 10 days (panel A) and the total cumulative energy expenditure of SPA over 23 hours following injections of CNO (injections took place at time ‘0’) averaged across 10 days (panel B). Energy expenditure of SPA was defined as total energy expenditure every 30 minutes minus the energy expenditure during the 30 minutes of least activity for each animal, divided by that animal’s lean mass, for animals (n =8) on chow, high-fat diet (HFD), and HFD plus CNO. @@p<0.01 difference between HFD and HFD+CNO at the indicated time points; ##p<0.01, #p<0.05 difference between chow and HFD at the indicated time points; **p<0.01, *p<0.05 difference between chow and HFD+CNO at the indicated time points
The effect of CNO treatment on NEAT was then compared within the HFD group. There was a significant effect of time on NEAT (F(43,1333) = 48.23; p < 0.001), no significant effect of treatment (i.e., CNO; F(1,31) = 3.86; p = 0.059), but a significant treatment by time interaction (F(43,1333) = 5.31; p < 0.001). Post-hoc tests revealed that CNO treatment in animals on HFD increased NEAT within the first three hours following injection, relative to HFD alone. To further explore this difference, cumulative changes in NEAT were analyzed in animals on HFD that received CNO injections. There was a significant effect of time (F(43,1333) = 888.7; p < 0.001) and a significant effect of drug treatment (F(1,31) = 12.08; p < 0.01), but no interaction (F(42,1302) = 0.75; ns), on cumulative NEAT. Post-hoc tests revealed a significant increase in NEAT throughout the entire day following injections of CNO, suggesting that the increase in NEAT in the first three hours following injections of CNO results in greater NEAT across the entire day. Combined, these results indicate that animals on HFD have reduced NEAT relative to animals with access to chow, and that activation of orexin neurons with CNO increases NEAT up to that of control levels.
We calculated the ratio between NEAT/lean mass and SPA for animals on HFD compared to those on chow. Figure 7 shows the mean daily NEAT / mean daily SPA for all animals over the 10-day period. Mice on HFD had a lower NEAT/SPA ratio compared with animals on chow (t(14) = 2.64; p < 0.05). Food intake was not significantly different between groups, suggesting that HFD animals burned fewer calories during SPA compared to chow, indicating greater caloric efficiency. The ratio of NEAT to SPA was then compared within animals fed HFD only, with and without CNO administration. There was no significant difference in efficiency for mice on HFD with and without CNO.
Lastly, to determine the extent to which orexin neuron activation increases locomotor speed, we compared the speed of SPA (meters/second) between the groups. Figure 8 shows a significant decrease in movement speed in animals on HFD compared to those on chow (t(18) = 4.71; p < 0.01), indicating that animals on HFD move slower than those on chow. During the 10 days of CNO injections, movement speed was increased in the HFD group, compared to the prior phase when there were no injections (t(9) = 4.87; p < 0.01).
Figure 8.
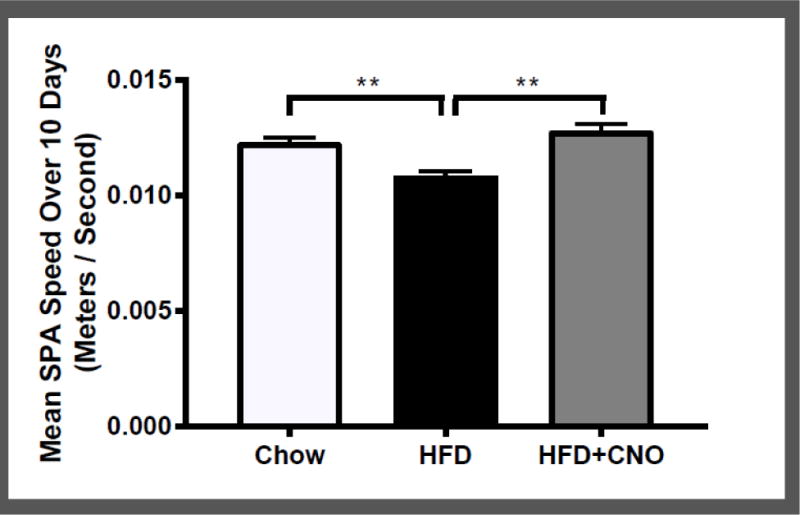
Mean +/− SEM meters traveled per second for each animal, averaged across all 10 days of access to chow or HFD, and across all 10 days of CNO injections. **p < 0.01 difference from HFD.
4. Discussion
Using continuous metabolic and behavioral phenotyping, the current study demonstrated that the behavioral patterning of food intake, inactivity, and NEAT is dependent on diet (chow vs. HFD). Animals were more likely to be inactive within their home cage and spent less time eating when they were switched from a chow diet to a HFD. In a separate cohort of animals, access to HFD resulted in a decrease in energy expenditure from physical activity, such that the efficiency of energy expenditure during movement was reduced in animals on HFD. When CNO was administered to animals on HFD, NEAT was increased in the hours following injection, suggesting that activation of orexin neurons in the lateral hypothalamus increases energy expenditure from physical activity.
The effects of HFD on total time spent engaged in food intake were likely due in part to the decreased total effort required by the animals on HFD to consume the same number of calories as those on chow, an idea supported by the similarity in total food intake, expressed as mean kCal/day, between the chow-fed and HFD groups. Furthermore, increased inactivity in animals on HFD may be explained by reduction in anticipatory food intake responses. As fewer trips to the food hopper were required to obtain an equivalent number of calories relative to the chow fed group, less anticipatory food intake behavior would be expected.
Additional characterizations of diet-induced changes in behavioral allocation examined the probability of remaining inactive following a bout of food intake. Animals on HFD were more likely to remain inactive for longer periods of time (>60 sec) compared with animals on chow. The mice on chow, in contrast, were inactive following bouts of food intake for shorter periods of time (<60 sec). These results suggest that following HFD intake, SPA is decreased for prolonged periods of time, which likely contributes to increased weight gain. These results coincide with what is known about sedentary behaviors in obese humans. Individuals who engage in obesity-related eating behaviors tend to engage in less physical activity and more sedentary behaviors [24, 25]. This is found particularly in children, who have decreased their physical activity over the last ~50 years [26]. In addition, chronic consumption of a high-fat diet has been shown to decrease the number of orexin-positive neurons in the LH [27]. Furthermore, research in our lab has shown that rats bred for lower activity levels have reduced pre-pro orexin mRNA in the LH, show reduced responsiveness to orexin-mediate increases in SPA following injections of orexin directly into the LH, and more readily develop diet-induced obesity in response to HFD compared to rats bred for high activity levels [19].
To determine the energetic consequences of the diet-induced change in activity and eating behavior, NEAT was measured during the two diets. HFD decreased NEAT during the dark cycle, which resulted in decreased total NEAT over 24 hours. This effect was abolished within the first several hours following orexin neuron activation. Orexin neuron activation increased 24 h cumulative NEAT in the HFD group, restoring NEAT to that of the chow-fed control animals. Changes in behaviors were then examined within animals given HFD with and without injections of CNO, to determine the cause of the observed increased NEAT in this group. The HFD+CNO group spent a similar percent time inactive, compared to that of animals in the HFD group, indicating that the amount of daily time spent inactive was not due to orexin neuron activation. In contrast, when the probability matrix was used to analyze the probability of remaining inactive following food intake, the activity profile of mice given HFD and CNO no longer differed from those on chow for time spent engaged in a long lounge (data not shown), indicating that orexin neuron activation increases the probability of becoming active following a meal. We then examined changes in the ratio of NEAT to SPA, and failed to find any difference between animals on HFD with and without CNO injections. This suggests that the changes in NEAT following injections of CNO were not caused by an increase in efficiency of movement per se, but rather by an increase in SPA. This change in SPA could not be due to changes in amount of time being active since there were no observed differences in the percent time inactive. We next determined if there were changes in movement speed between animal on a chow diet vs. animals on HFD, and within the animals on a HFD group prior to and during CNO injections. This analysis revealed that orexin neuron activation increased movement speed in animals on the HFD to that level observed in animals eating chow diet (control levels). So, while the total percentage of time spent inactive throughout each day was unchanged, movement speed was increased, resulting in greater SPA without a change in total time spent inactive, which then resulted in increased NEAT. In this study, we were specifically interested in the therapeutic potential of orexin neuron activation and focused on animals given an obesogenic HFD. We did not explicitly study the effects of orexin activation on NEAT in animals maintained on chow, but based on previous work [2, 19] we think orexin would have similar effects on NEAT in chow-fed animals, which would imply that orexin’s effects on NEAT are not diet specific.
It is important to consider that the measures of NEAT within this investigation also include the thermic effect of food (TEF). Typically, NEAT is calculated as total daily energy expenditure – (basal metabolic rate + thermic effect of food) [1, 23]. Although the TEF represents only a small percentage (6–12%) of variability in total energy expenditure throughout the day [2], the nature of our calculations to determine NEAT (BMR - total energy expenditure throughout the day), automatically included the TEF. Based on this calculation, it is possible that our NEAT could be underestimated because the TEF for HFD is less than that of a chow diet [28]. Importantly, kilocalorie intake within each group was not different, and therefore overall TEF would not be different. It is also possible that differences in macronutrient composition between the HFD and chow diet would result in variations in the TEF [29, 30], and this possibility could not be accounted for in the present model. Still, the small percentage of daily energy expenditure from the TEF renders this less of a concern. After calculating NEAT, we then calculated the ratio of NEAT to SPA in animals on chow and HFD to determine the extent to which diet influences the efficiency of NEAT (thermogenesis during physical activity). We found that animals on HFD were more efficient at expending energy (i.e. conserved energy) during physical activity, as compared to animals on chow. These data suggest that exposure to HFD reduces SPA and increases caloric efficiency of movement, such that less energy is expended for every bout of SPA. This dual effect on SPA, and the NEAT produced by SPA, underscores the obesity-promoting effect of HFD. While the energetic demand would be greater for larger animals, we accounted for this by dividing NEAT by total lean mass for each animal, and still found differences between the HFD and chow groups.
Previous research investigating the effects of HFD on SPA and EE has yielded conflicting results [9–15, 31]. Like our current study, a set of experiments by Mifune et al. (2015) investigating the effects of chow and HFD on SPA and running wheel activity found a decrease in SPA during the dark cycle in animals on HFD. Although this study also found an increase in SPA during the light cycle, the data appear to support our overall conclusion that total 24 h activity is reduced during access to HFD [12]. Mifune et al. (2015) also found an overall decrease in total energy expenditure in animals on HFD, which is in agreement with the results from our study. Similarly, in an investigation by Choi et al. (2015), HFD depressed EE for 14 weeks with lack of difference in overall caloric intake between mice on HFD and chow [15]. A recent investigation by Pereira de Carvalho (2016) also demonstrated that access to HFD reduces global physical activity levels and decreases energy expenditure, supporting our overall conclusion that HFD reduces overall physical activity and EE [9].
In contrast to the current findings, other studies have demonstrated that SPA is increased in animals on a HFD; however, these differences may be due to difference in mouse strains, dietary fat content, and SPA measurements. For example, Tung et al. 2007 compared POMC −/− mice with wildtype mice of a 129/SvEv background provided HFD and observed increases in both SPA and EE [14]. The difference in SPA results between that investigation and the present study may be due to strain differences. Another study reported increases in SPA and EE during HFD exposure also used mice from the obesity resistant 129/SvEv strain [11]. Another difference between studies is percent of dietary fat. The studies by Tung et al. used a HFD with 60% fat, whereas the diet used in our study was 45% fat. Other investigations did not show any HFD-induced differences in SPA when a 40% fat diet was used. [10, 13]. In these studies, the methods for quantifying SPA were different from ours and the assessments of SPA occurred only once or twice per week. These methods may not have captured total SPA and likely confounded measurements of SPA due to the stress of switching environments to obtain the SPA measures. Previous research has shown that access to a HFD increases anxiety-like behaviors in mice [32], including when tested in open field. These increases in SPA as they are related to anxiety-like behaviors may be responsible for the elevated/similar levels of SPA seen in these tests relative to chow fed controls. Despite attempts to alleviate this increased stress by allowing for an acclimation period, it is possible that the increases in SPA in these studies relative to ours may be indirectly precipitated by novel housing situations.
The major strength of the current study includes the continuous, simultaneous recording of SPA, food intake, and energy expenditure and the daily measurement of these behaviors over time, which allowed us to estimate changes in NEAT. These methods are a departure from previous investigations, which have employed indirect calorimetry to calculate EE in discrete testing sessions, typically lasting for 3 days or fewer and often involve measuring these behaviors in environments that differ considerably from that used in other phases of the study. In the current study we could measure behaviors immediately upon providing access to HFD, and thereby capture changes in how mice allocate their time between movement, food intake, and rest dependent on diet availability. Previous data suggest that NEAT is predictive of fat gain [23], and the techniques employed within the present study allowed for a detailed characterization of the pre-escalation phases for food intake. In addition, we measured metabolic and behavioral changes in the same environment during HFD, which very closely resembled the home cage environment. This lends a great deal of ecological validity to the present investigation and greatly diminishes the contribution of stress to the observed changes in SPA. Daily SPA measurements in both HFD-fed and chow-fed animals showed no novelty-induced increases in SPA within the first several days of housing, which would have indicated a housing acclimation effect on SPA. As there were no differences in SPA between days 1 and 10 for each group, we can conclude that the animals acclimated to these cages immediately, and any difference between groups was due to the diets given. We saw changes in overall SPA and EE that occurred prior to long-term differences in food intake, which has been shown following long term exposure to HFD [33]. This suggests that consumption of a HFD may produce observable, behavioral disruptions prior to the onset of obesity. This is particularly important to consider when thinking about childhood obesity, which has been linked to both increased dietary fat intake and decreased physical activity [26, 27].
The use of DREADDs within the present study allowed for an investigation into the therapeutic potential for orexin stimulation of NEAT. These data support the hypothesis that orexin is a mediator of NEAT and build upon our work and others’ demonstrating that orexin produces increased thermogenesis alongside increases in SPA [35]. We chose to produce a SPA increase at a time of day when normally there would be very little SPA. In this way, we could ensure that our treatments were increasing total SPA, as it is possible that stimulating orexin during a period of high SPA (when orexin neuron activity is already elevated) might not be sufficient to further increase SPA. It is unlikely that the observed effects of orexin on NEAT were simply mediated by increased arousal, as we have previously shown that orexin mediates increases in SPA in awake animals, without circadian entrainment [4, 36].
5. Conclusions
The present study found that animals fed HFD spent less time engaging in feeding behavior and more time in periods of inactivity relative to animals fed chow. In addition, HFD-fed animals had a greater probability of inactivity following a meal compared to animals eating chow. Finally, NEAT was decreased in animals eating a HFD, and was increased to match the levels of that in control (chow fed) animals following CNO activation of orexin neurons. Together these results suggest that consumption of high fat diet not only reduces overall physical activity and increases the chance of being inactive following a meal, but also reduces NEAT, such that SPA during HFD feeding burns fewer calories compared to SPA during chow feeding. These results have significant implications for understanding how changes in physical activity contribute to obesity.
Highlights.
A high fat diet decreases spontaneous physical activity and time spent eating
A high fat diet encourages longer bouts of inactivity, particularly after a meal
Energy expenditure from SPA (NEAT) is decreased in animals on a high fat diet
Orexin activation increases previously low levels of NEAT induced by high fat diet
A high fat diet increases energy efficiency during physical activity
Acknowledgments
This work was supported by the Department of Veterans Affairs (5I01RX000441-04 to CMK and CJB), the National Institute of Health (5R01DK100281-03 to CMK and CJB and the Minnesota Obesity Center, 5R01DK100281-03), and by Award Number T32DK083250 from the National Institute of Diabetes and Digestive and Kidney Diseases (NIDDK; to PEB). We are grateful to all the members of the Obesity Neuroscience group at the Minneapolis VA, especially Martha M. Grace and Morgan Little, for their support in establishing the working protocols used within these experiments and productive discussions and constructive comments they provided on the project and manuscript.
Footnotes
Publisher's Disclaimer: This is a PDF file of an unedited manuscript that has been accepted for publication. As a service to our customers we are providing this early version of the manuscript. The manuscript will undergo copyediting, typesetting, and review of the resulting proof before it is published in its final citable form. Please note that during the production process errors may be discovered which could affect the content, and all legal disclaimers that apply to the journal pertain.
References
- 1.Levine JA, Kotz CM. NEAT – non- exercise activity thermogenesis – egocentric & geocentric environmental factors vs. biological regulation. Acta Physiologica. 2005;184:309–318. doi: 10.1111/j.1365-201X.2005.01467.x. [DOI] [PubMed] [Google Scholar]
- 2.Kotz CM, Teske JA, Billington CJ. Neuroregulation of nonexercise activity thermogenesis and obesity resistance. American Journal of Physiology - Regulatory, Integrative and Comparative Physiology. 2008;294:R699–710. doi: 10.1152/ajpregu.00095.2007. [DOI] [PubMed] [Google Scholar]
- 3.Ravussin E, Lillioja S, Anderson TE, et al. Determinants of 24-hour energy expenditure in man. Methods and results using a respiratory chamber. Journal of Clinical Investigation. 1986;78:1568–1578. doi: 10.1172/JCI112749. [DOI] [PMC free article] [PubMed] [Google Scholar]
- 4.Kiwaki K. Orexin A (hypocretin 1) injected into hypothalamic paraventricular nucleus and spontaneous physical activity in rats. AJP: Endocrinology and Metabolism. 2004;286:E551–E559. doi: 10.1152/ajpendo.00126.2003. [DOI] [PubMed] [Google Scholar]
- 5.Kotz CM, Teske JA, Levine JA, Wang CF. Feeding and activity induced by orexin A in the lateral hypothalamus in rats. Regulatory Peptides. 2002;104:27–32. doi: 10.1016/S0167-0115(01)00346-9. [DOI] [PubMed] [Google Scholar]
- 6.Thorpe AJ, Teske JA, Kotz CM. Orexin A-induced feeding is augmented by caloric challenge. American Journal of Physiology - Regulatory, Integrative and Comparative Physiology. 2005;289:R367–R372. doi: 10.1152/ajpregu.00737.2004. [DOI] [PubMed] [Google Scholar]
- 7.Kotz CM, Wang C, Teske JA, et al. Orexin A mediation of time spent moving in rats: neural mechanisms. Neuroscience. 2006;142:29–36. doi: 10.1016/j.neuroscience.2006.05.028. [DOI] [PubMed] [Google Scholar]
- 8.Chiel HJ, Wurtman RJ. Short-term variations in diet composition change the pattern of spontaneous motor activity in rats. Science. 1981;213:676–678. doi: 10.1126/science.7256271. [DOI] [PubMed] [Google Scholar]
- 9.de Carvalho FP, Benfato ID, Moretto TL, et al. Voluntary running decreases nonexercise activity in lean and diet-induced obese mice. Physiol Behav. 2016;165:249–256. doi: 10.1016/j.physbeh.2016.08.003. [DOI] [PubMed] [Google Scholar]
- 10.Kim JH, Park Y, Kim D, Park Y. Dietary Influences on Nonexercise Physical Activity and Energy Expenditure in C57BL/6J Mice. Journal of Food Science. 2012;77:H63–H68. doi: 10.1111/j.1750-3841.2011.02522.x. [DOI] [PubMed] [Google Scholar]
- 11.Kokkotou E, Jeon JY, Wang X, et al. Mice with MCH ablation resist diet-induced obesity through strain-specific mechanisms. American Journal of Physiology - Regulatory, Integrative and Comparative Physiology. 2005;289:R117–24. doi: 10.1152/ajpregu.00861.2004. [DOI] [PubMed] [Google Scholar]
- 12.Mifune H, Tajiri Y, Nishi Y, et al. Voluntary exercise contributed to an amelioration of abnormal feeding behavior, locomotor activity and ghrelin production concomitantly with a weight reduction in high fat diet-induced obese rats. Peptides. 2015;71:49–55. doi: 10.1016/j.peptides.2015.06.007. [DOI] [PubMed] [Google Scholar]
- 13.Ramadan W, Dewasmes G, Petitjean M, et al. Spontaneous motor activity in fat-fed, streptozotocin-treated rats: A nonobese model of type 2 diabetes. Physiol Behav. 2006;87:765–772. doi: 10.1016/j.physbeh.2006.01.012. [DOI] [PubMed] [Google Scholar]
- 14.Tung Y, Rimmington D, O’Rahilly S, Coll AP. Pro-opiomelanocortin modulates the thermogenic and physical activity responses to high-fat feeding and markedly influences dietary fat preference. Endocrinology. 2007;148:5331–5338. doi: 10.1210/en.2007-0797. [DOI] [PMC free article] [PubMed] [Google Scholar]
- 15.Choi M-S, Kim Y-J, Kwon E-Y, et al. High-fat diet decreases energy expenditure and expression of genes controlling lipid metabolism, mitochondrial function and skeletal system development in the adipose tissue, along with increased expression of extracellular matrix remodelling- and inflammation-related genes. Br J Nutr. 2015;113:867–877. doi: 10.1017/S0007114515000100. [DOI] [PubMed] [Google Scholar]
- 16.de Lecea L, Kilduff TS, Peyron C, et al. The hypocretins: hypothalamus-specific peptides with neuroexcitatory activity. Proc Natl Acad Sci USA. 1998;95:322–327. doi: 10.1073/pnas.95.1.322. [DOI] [PMC free article] [PubMed] [Google Scholar]
- 17.Khan AM. Controlling feeding behavior by chemical or gene-directed targeting in the brain: what’s so spatial about our methods? 2013:1–49. doi: 10.3389/fnins.2013.00182/abstract. [DOI] [PMC free article] [PubMed] [Google Scholar]
- 18.Krashes MJ, Koda S, Ye C, et al. Rapid, reversible activation of AgRP neurons drives feeding behavior in mice. Journal of Clinical Investigation. 2011;121:1424–1428. doi: 10.1172/JCI46229. [DOI] [PMC free article] [PubMed] [Google Scholar]
- 19.Perez-Leighton CE, Boland K, Billington CJ, Kotz CM. High and low activity rats: Elevated intrinsic physical activity drives resistance to diet-induced obesity in non-bred rats. Obesity. 2013;21:353–360. doi: 10.1002/oby.20045. [DOI] [PMC free article] [PubMed] [Google Scholar]
- 20.Matsuki T, Nomiyama M, Takahira H, et al. Selective Loss of GABA_B Receptors in Orexin-Producing Neurons Results in Disrupted Sleep/Wakefulness Architecture. Proc Natl Acad Sci USA. 2009;106:4459–4464. doi: 10.2307/40441831?ref=search-gateway:dabbfeac725cd6beca0d5bea07bc5ae8. [DOI] [PMC free article] [PubMed] [Google Scholar]
- 21.Lighton LR, Halsey JG. Flow-through respirometry applied to chamber systems: pros and cons, hints and tips. Comp Biochem Physiol A Mol Integr Physiol. 2011;158(3):265–75. doi: 10.1016/j.cbpa.2010.11.026. [DOI] [PubMed] [Google Scholar]
- 22.Kaiyala KJ, Morton GJ, Thaler JP, et al. Acutely Decreased Thermoregulatory Energy Expenditure or Decreased Activity Energy Expenditure Both Acutely Reduce Food Intake in Mice. PLoS ONE. 2012;7:e41473–13. doi: 10.1371/journal.pone.0041473. [DOI] [PMC free article] [PubMed] [Google Scholar]
- 23.Levine JA, Eberhardt NL, Jensen MD. Role of nonexercise activity thermogenesis in resistance to fat gain in humans. Science. 1999;283:212–214. doi: 10.2307/3055458?ref=search-gateway:869ad0fe7ea1c67a276ee4ad97efd16d. [DOI] [PubMed] [Google Scholar]
- 24.McMurray RG, Berry DC, Schwartz TA, et al. Relationships of physical activity and sedentary time in obese parent-child dyads: a cross-sectional study. BMC Public Health. 2016:1–8. doi: 10.1186/s12889-016-2795-5. [DOI] [PMC free article] [PubMed] [Google Scholar]
- 25.Mesas AE, Guallar-Castillon P, Leon-Munoz LM, et al. Obesity-Related Eating Behaviors Are Associated with Low Physical Activity and Poor Diet Quality in Spain. Journal of Nutrition. 2012;142:1321–1328. doi: 10.3945/jn.112.158154. [DOI] [PubMed] [Google Scholar]
- 26.Bassett DR, John D, Conger SA, et al. Trends in Physical Activity and Sedentary Behaviors of United States Youth. J Phys Act Health. 2015;12:1102–1111. doi: 10.1123/jpah.2014-0050. [DOI] [PubMed] [Google Scholar]
- 27.Nobunaga M, Obukuro K, Kurauchi Y, Hisatsune A, Seki T, Tsutsui M, Katsuki H. High fat diet induces specific pathological hanges in hypothalamic orexin neurons in mice. Neurochem Int. 2014;78:61–66. doi: 10.1016/j.neuint.2014.09.002. [DOI] [PubMed] [Google Scholar]
- 28.Liverini G, Iossa S, Lionetti L, et al. Sympathetically-mediated thermogenic response to food in rats. Int J Obes Relat Metab Disord. 1995;19:87–91. doi: 10.2307/3578790?ref=search-gateway:463c1a6e9a80ed1bdd4dfcd6ba052fce. [DOI] [PubMed] [Google Scholar]
- 29.Jones PJH, Jew S, AbuMweis S. The effect of dietary oleic, linoleic, and linolenic acids on fat oxidation and energy expenditure in healthy men. Metabolism. 2008;57:1198–1203. doi: 10.1016/j.metabol.2008.04.012. [DOI] [PubMed] [Google Scholar]
- 30.Thearle MS, Pannacciulli N, Bonfiglio S, et al. Extent and Determinants of Thermogenic Responses to 24 Hours of Fasting, Energy Balance, and Five Different Overfeeding Diets in Humans. J Clin Endocrinol Metab. 2013;98:2791–2799. doi: 10.1210/jc.2013-1289. [DOI] [PMC free article] [PubMed] [Google Scholar]
- 31.Brownlow BS, Petro A, Feinglos MN, Surwit RS. The role of motor activity in diet-induced obesity in C57BL/6J mice. Physiol Behav. 1996;60:37–41. doi: 10.1016/0031-9384(95)02210-4. [DOI] [PubMed] [Google Scholar]
- 32.Del Rosario A, McDermott MM, Panee J. Effects of a high-fat diet and bamboo extract supplement on anxiety- and depression-like neurobehaviours in mice. Br J Nutr. 2012;108:1143–1149. doi: 10.1017/S0007114511006738. [DOI] [PMC free article] [PubMed] [Google Scholar]
- 33.Lin S, Thomas TC, Storlien LH. Development of high fat diet-induced obesity and leptin resistance in C 57 Bl/6 J mice. International journal of …. 2000 doi: 10.1038/sj.ijo.0801209. [DOI] [PubMed] [Google Scholar]
- 34.Wong CK, Botta A, Pither J, et al. A high-fat diet rich in corn oil reduces spontaneous locomotor activity and induces insulin resistance in mice. The Journal of Nutritional Biochemistry. 2015;26:319–326. doi: 10.1016/j.jnutbio.2014.11.004. [DOI] [PubMed] [Google Scholar]
- 35.Teske JA, Billington CJ, Kotz CM. Hypocretin/orexin and energy expenditure. Acta Physiologica. 2010;198:303–312. doi: 10.1111/j.1748-1716.2010.02075.x. [DOI] [PubMed] [Google Scholar]
- 36.Nixon JP, Mavanji V, Butterick TA, et al. Sleep disorders, obesity, and aging: The role of orexin. Ageing Research Reviews. 2015;20:63–73. doi: 10.1016/j.arr.2014.11.001. [DOI] [PMC free article] [PubMed] [Google Scholar]