

Summary
Tissue stem cells contribute to tissue regeneration and wound repair through cellular programs that can be hijacked by cancer cells. Here, we investigate such a phenomenon in skin, where during homeostasis, stem cells of epidermis and hair follicle fuel their respective tissues. We find that breakdown of stem cell lineage confinement - granting privileges associated with both fates - is not only hallmark, but also functional in cancer development. We show that lineage plasticity is critical in wound repair, where it operates transiently to redirect fates. Probing mechanism, we discover that irrespective of cellular origin, lineage infidelity occurs in wounding when stress-responsive enhancers become activated and override homeostatic enhancers that govern lineage specificity. In cancer, stress responsive transcription factor levels rise, causing lineage commanders to reach excess. When lineage and stress factors collaborate, they activate oncogenic enhancers that distinguish cancers from wounds.
Keywords: stem cells, lineage infidelity, plasticity, fate, wound repair, regeneration, cancer, stress response, epigenetics, super-enhancers, skin, transcriptional regulation
INTRODUCTION
Human adult tissues harbor resident stem cells (SCs) responsible for homeostasis and wound-repair. Tumorigenesis arises when normal SCs accumulate mutations that cause them to derail, shifting their homeostatic balance to favor tissue growth at the expense of differentiation. In contrast to wound repair, where the growth:differentiation imbalance is transient, cancers are refractory to tissue restoration cues, seemingly hijacking these normal cellular programs to fuel their molecular thirst for uncontrolled growth.
The notion that a “cancer is a wound that never heals” has origins dating back to Rudolf Virchow in the 1800’s. Since then, tantalizing parallels between cancer and wounds have emerged in many contexts (Antsiferova and Werner, 2012; Arwert et al., 2012; Dvorak, 1986). For instance, it has long been recognized that human patients suffering from chronic wounds have increased susceptibility to cancers (Dunham, 1972; Haddow, 1972). Additionally, mice with gene mutations that enhance skin SC activity heal wounds faster but also become more susceptible to squamous cell carcinomas (SCCs) (Guasch et al., 2007; Hance et al., 2014). By contrast, mice whose skin possesses mutations that impede SC activation display reduced efficiency in wound closure, but increased resistance to cancers (Schober and Fuchs, 2011).
Intimate connections between wounds and tumors have also been drawn at the molecular level. Following serum stimulation, cultured fibroblasts elicit a robust wound repair signature resembling that of certain human carcinomas and predictive of poor patient prognosis (Chang et al., 2004; Iyer et al., 1999). Gene profiling studies in various wounded and tumorigenic epithelial tissues have further highlighted a concordant gene signature (Pedersen et al., 2003; Riss et al., 2006). Although intriguing, it remains unclear which of the normal SC remodeling pathways are exploited by tumor SCs and how cancers rewire pre-installed regulatory networks to support malignancy. The answers could be important in devising new and improved therapeutics for treatments of chronic wounds as well as cancers.
Mouse skin offers an excellent genetically tractable model system to tackle these issues. Its epithelium has two distinct lineages, hair follicle (HF) and epidermis (Epd), each harboring their own resident SCs (Fuchs, 2016). HFSCs reside in a region of the follicle known as the bulge, and during normal homeostasis, their role is to fuel the cyclical bouts of HF regeneration and hair growth. By contrast, EpdSCs reside in the innermost (basal) layer of epidermis, where they generate an upward flux of differentiating cells that produces the skin’s barrier.
Upon injury, both Epd- and HF-SCs near the wound site mobilize toward it, re-epithelializing the wound bed and restoring the barrier (Ito et al., 2005; Jensen et al., 2009; Levy et al., 2007; Tumbar et al., 2004). Each lineage can also participate in cancer progression when its SCs acquire oncogenic HRAS mutations (Lapouge et al., 2011; White et al., 2011). At low levels, oncogenic HRAS drives the SCs to hyper-proliferative and benign tumorigenic states; as RAS/MAPK levels rise, malignant, invasive SCCs develop (Latil et al., 2016; Quintanilla et al., 1986; Rodriguez-Puebla et al., 1999) How SCs acquire the plasticity that allows them to exit homeostasis and participate in wound-repair and malignant progression remains unknown.
Recent transcriptional and epigenetic chromatin landscaping of HF- and Epd-SCs suggest that chromatin dynamics and lineage commitment are governed by signals emanating from the SC niche (Adam et al., 2015; Latil et al., 2016). Notably, HFSCs in the bulge niche are distinguished from EpdSCs by their expression of a cohort of transcription factors (TFs) (Blanpain et al., 2004; Morris et al., 2004; Tumbar et al., 2004). SOX9 appears to be particularly important in governing the fate of skin SCs. Its null mutations in mice compromise HFSC function and result in the conversion of the SC niche into an epidermal cyst (Kadaja et al., 2014). Conversely, ectopic SOX9 expression in the epidermis initiates the activation of other HFSC TFs (Adam et al., 2015).
During wound-repair, as HFSCs mobilize and re-epithelialize the injured skin, they quickly silence most HFSC TFs. By contrast, SOX9 remains active until HFSC progenies reach the epidermis and the wound heals (Adam et al., 2015). Interestingly, SOX9 is also one of the few HFSC TFs that remains expressed in the tumor-initiating (stem) cells of SCCs (Lapouge et al., 2011; Schober and Fuchs, 2011). Despite shared expression of SOX9 in these states, the global gene expression patterns of HF-, Epd-and SCC-SCs remain strikingly different (Lapouge et al., 2011; Schober and Fuchs, 2011; Yang et al., 2015).
A major hurdle in digging deeper into stem cell plasticity in either wound-repair or cancer progression is obtaining sufficient numbers of pure wound-induced or tumor-initiating stem cells for transcriptome and chromatin landscape analyses. This is particularly the case for the wounded state, leaving us with a significant knowledge gap as to the relation between wound-repair and cancer and to whether stem cell plasticity plays a role therein.
To tackle this problem, we exploit a sensitive method, “assay for transposase-accessible chromatin with high throughput sequencing” (ATACseq) (Buenrostro et al., 2013), to define the open chromatin landscape of purified tumorigenic stem cells and then interrogate it against the chromatin profiles of Epd- and HF-SCs under both homeostatic and wound-induced conditions. These comparative analyses lead us to a surprising phenotype where two otherwise confined skin lineages – Epd and HF – are breached and manifested simultaneously in tumor-initiating cells. Intriguingly, this feature also occurs during a wound-response, but it is transient and resolves itself upon wound-closure. Applying CRISPR/CAS to ablate genes encoding two distinguishing lineage TFs, SOX9 (HFSCs) and KLF5 (EpdSCs), we document the physiological relevance of both TFs in wound repair and cancer. We further unveil at both the transcriptome- and chromatin- levels a striking convergence between the two stressed states. Finally, we show that their divergence is encrypted by a group of high-stress, tumor-specific enhancers that lock cancers into a permanent lineage infidelity state. Exploiting the remarkable specificity of these enhancer elements, we now pave the way for future advancements in therapeutic targeting.
RESULTS
Tumor Stem Cells Undergo Global Changes in Chromatin Accessibility
We used ATACseq to delineate how open chromatin states reflective of TF binding differ across homeostatic, wound-induced and tumorigenic stem cell populations in vivo. By complementing these data with transcriptional profiling and chromatin immunoprecipitation followed by sequencing (ChIPseq), we could predict clustered TF binding motifs that define each cellular state (Figures S1). Comparative analyses revealed distinct chromatin accessibilities of SCC-SCs compared to HF- and Epd-SCs (Figure 1A), indicating that large-scale chromatin remodeling had occurred during tumorigenesis, as suggested previously (Latil et al., 2016; Yang et al., 2015).
Figure 1. Tumor Stem Cells Undergo Global Changes in Chromatin Accessibility Compared to Their Normal Counterparts.
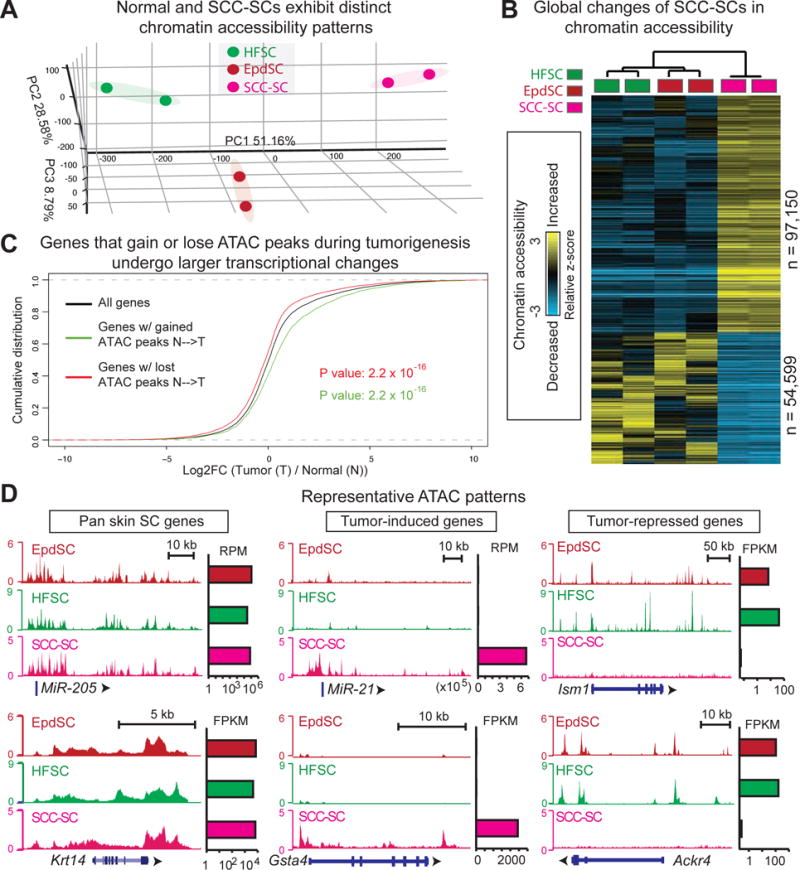
(A) Principal component analysis of ATACseq signals from biological duplicates of FACS sorted tumor (SCC-) and normal (HF- and Epd-) SCs.
(B) Genome-wide ATAC signals in SCC-, Epd- and HF-SCs are z-score-transformed and averaged across 100-bp genomic windows (n=# windows plotted). Hierarchical clustering shows comparison of open chromatin regions between normal (Epd and HF) and SCC-SCs. Heatmap shows gain (yellow), loss (blue) or no change (black) of ATAC signals from normal to stress comparison.
(C) Cumulative density plot shows that genes upregulated in tumor (T) versus normal (N) SCs have gained ATAC peaks (log2FC positive, green curve right shift), whereas those downregulated have lost ATAC peaks (log2FC negative, red curve left shift). KS one-sided test was used to compare genes that had gained or lost ATAC peaks in T vs N SCs relative to all genes.
(D) SCC-, Epd- and HF-SC ATAC tracks of representative genes that are constitutively active, induced or suppressed in tumors, respectively. Shown to the right are transcript levels (RPM for miRNA reads, FPKM for mRNA reads).
Also see Figure S1.
To identify genomic regions where chromatin accessibility is altered in tumors, we z-score-transformed ATAC signals and averaged them across 100-bp genomic windows (STAR Methods). The hierarchical clustering heatmap revealed numerous accessible regions specific to SCC-SCs (Figure 1B). When combined with transcriptome profiling, genes associated with gain or loss of ATAC peaks were also more highly changed in expression (Figure 1C). Hence, our datasets appeared to capture key regulatory regions responsible for dictating these transcriptional remodeling events. ATAC patterns were largely unchanged for pan-epithelially expressed genes (e.g., miR-205, Krt14), but showed marked differences for genes that were either induced (e.g. miR-21, Gsta4) or suppressed (e.g. Ism1, Ackr4) in tumors (Figure 1D).
Tumors Co-express Key Identity Genes that Normally Distinguish Epidermal and HF Lineages
To track these distinct changes between normal and malignant states, we used HOMER de novo motif search (Heinz et al., 2010), and identified TF motifs that are uniquely enriched within open chromatin regions of each SC population. We then analyzed how this differs according to SC identity and state. As expected, motifs for HFSC identity TFs (Blanpain et al., 2004; Tumbar et al., 2004) were within the HFSC but not EpdSC profile (Figure 2A). Of significance, HFSC-specific ATAC peaks captured previously annotated regulatory regions from ChIPseq where the full suite of HFSC identity TFs is bound and shouldered by active histone mark H3K27Ac (Figure S1C) (Adam et al., 2015). These so called ‘epicenters’ (ECs) of densely clustered TFs sit within broad open chromatin domains known as ‘super-enhancers’ (SEs) (Whyte et al., 2013).
Figure 2. SCC Stem Cells Express Both Epidermal and Hair Follicle Lineage Markers.
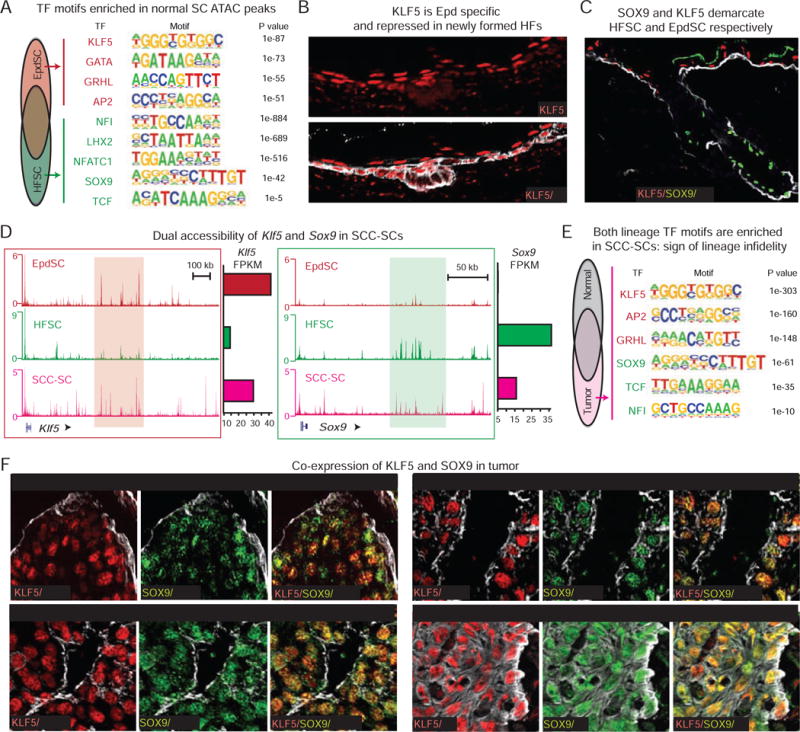
All images are representative and from at least 5 biologically independent replicates. Bars = 50μm. Dashed line denotes epidermal-dermal border.
(A) Motif analysis identifies enriched TF motifs associated with ATAC-peaks unique to HFSCs or EpdSCs compared to peaks common to both lineages.
(B) Immunofluorescence reveals downregulation of Epd KLF5 (arrows) in newly emerged hair germs (open arrowheads) at embryonic day E17.5.
(C) Lineage restricted SOX9 and KLF5 expression during skin homeostasis. Asterisk denotes artifactual autofluorescence of Epd squames.
(D) ATAC tracks reveal enhanced chromatin accessibility within Klf5 and Sox9 regulatory regions (red and green shades) in SCC-SCs compared to SCs of the opposite lineage. mRNA levels (FPKM) at right.
(E) Motif analysis identifies enriched TF motifs associated with SCC-SC-exclusive ATAC-peaks compared to those shared between SCC- and normal SCs.
(F) Co-expression of SOX9 and KLF5 (arrows) in papillomas, murine and human SCCs, and lung metastases.
Also see Figure S2.
Stem cell master regulators use super-enhancers to govern their own expression and those of other key SC fate genes. Previously, this led us to SOX9 as a master regulator of HFSC identity (Adam et al., 2015). We therefore posited that when combined, transcriptome and ATAC datasets could serve as valuable predictive tools to identify key regulators of EpdSC identity. ATAC peaks unique to EpdSC compared to HFSC were enriched for KLF5, GATA, GRHL and AP2 motifs (Figure 2A), with KLF5 being the top enriched EpdSC TF.
Probing deeper, we found that KLF5 was expressed in embryonic Epd progenitors, but waned in nascent SOX9+ HFs (Figures 2B and S2A). In adult homeostasis, KLF5 and SOX9 also demarcated Epd and HF lineages (Figure 2C). Moreover, just as the accessibility of the Sox9 locus was unique to HFSCs, the Klf5 locus was more accessible in EpdSCs (Figure 2D).
Intriguingly, regulatory regions for both Klf5 and Sox9 displayed a highly accessible state in SCC-SCs (Figure 2D). To understand why, we analyzed SCC-SC ATAC peaks across the genome to identify what is unique compared to those of each lineage-specific SCs in their homeostatic state. Interestingly, the SCC-SC-unique ATAC peaks contained TF motifs for both EpdSCs (KLF5, GRHL, AP2) and HFSCs (SOX9, TCF, NFI) (Figure 2E).
As shown in Figure 2F and S2B, typically uni-lineage EpdSC and HFSC TFs unexpectedly colocalized in SCC-SCs at the tumor-stromal interface. Dual-lineage expression emerged in skin hyperplasia, and was progressively stronger in benign and finally malignant tumors. Attesting human relevance, similar TF co-expression was also observed in patient SCCs, both in primary tumors and lung metastases.
Simultaneous manifestation of two SC lineages genes in SCC-SCs extended well beyond SOX9 and KLF5. Unlike a simple merge of two lineages, a selective subset of key identity genes (30% of EpdSC signature and >10% of HFSC signature) was co-expressed (Figure S2C). Representative examples included Tcf7l1 (TCF3), Actn1 and Grem1 of HFSCs, and Ap2g (AP2γ), Ly6a and Hes1 of EpdSCs (Figures S2D–E). We refer to this condition as “lineage infidelity”.
Lineage Infidelity and Its Functional Implications for Tumor Maintenance
Having documented lineage infidelity in SCC-SCs, we next addressed its functional significance. To this end, we used CRISPR/CAS to inactivate the Klf5 and Sox9 genes in SCs that we purified by fluorescence activated cell sorting (FACS) from established SCCs in vivo. qPCR confirmed that relative to cells transduced with a scrambled small guide (Scr-sg) RNA, cells transduced with Klf5 or Sox9 sgRNAs were markedly diminished for their respective TF (Figure 3A).
Figure 3. Co-expression of KLF5 and SOX9 Is a Functional Hallmark of Tumorigenesis.
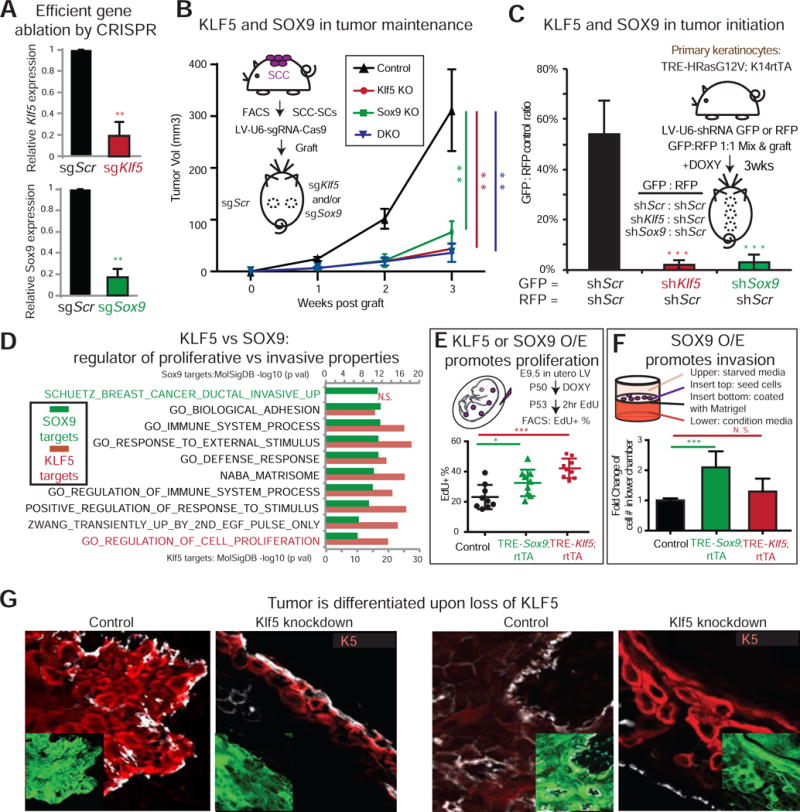
(A–B) SCCs-SCs were FACS-purified and infected with lentivirus (LV) harboring CAS9 and small guide RNAs against Klf5 (red) or Sox9 (green) or Scrambled (Scr) control (black). Following 2d puromycin selection, cells were subjected to either qPCR (A), or engrafted onto backskins of Nude mice (B). Tumor volume was measured each week thereafter (n=5).
(C) Primary keratinocytes from TRE-HRasG12V; K14rtTA mice were transduced with LV-H2BGFP harboring small hairpins against Klf5, Sox9 or Scr. Cells were sorted 3d later, mixed 1:1 GFP/RFP, and engrafted onto backskins of Nude mice with doxycycline. GFP/RFP ratio was measured 3 wks later by FACS.
(D) Genes associated with SCC-SC ATAC peaks harboring SOX9 or KLF5 motifs were analyzed by MolSigDB for their associated molecular pathways. Note preference of KLF5 for proliferation and SOX9 for invasion pathway genes.
(E) Overexpression (O/E) of KLF5 in vivo was achieved by LV-TRE-Klf5 infection of E9.5 K14-rtTA embryos. O/E of SOX9 in vivo was achieved by LV-rtTA infection of E9.5 TRE-Sox9 embryos. At P50, mice were treated 3d with doxycycline 3d and then pulsed with EdU 2 hr prior to FACS. Shown are % EdU+ of total basal cells. n = 9.
(F) Keratinocytes from K14-rtTA mice were infected with LV TRE-Sox9 or TRE-Klf5 (TRE-empty as control) and treated 3d with doxycycline prior to Boyden chamber assays. Keratinocytes in starvation media in the upper chamber were assayed for their ability to invade through matrigel-coated filters to reach the stimulatory dermal fibroblast-conditioned media in the lower chamber. 1d after seeding, cells reaching the bottom were counted, and results were plotted as fold change compared to control. n = 6.
(G) Immunofluorescence of engrafted SCC-SCs (LV-GFP transduced to mark tumor cells) knocked down for Klf5. Note decrease in progenitor marker K5 and increase in differentiation marker K10. Bar = 50μm. At least 5 biologically independent replicates were analyzed. Shown are representative images.
Paired t tests were performed for A, C, E, F. Two-way ANOVA with repeated measurement was performed for B. Shown as mean ± std. *P <0.05, **P<0.01. ***P <0.001. N.S. not significant.
Also see Figure S3, Table S1 and S2.
In subsequent tumorigenesis assays where Scr-sgRNA- and TF-sgRNA-transduced SCC-SCs were injected onto the respective left and right sides of host recipient mice, tumor growth was selectively crippled on the right side. Effects were comparable when stem cells lacked Klf5, Sox9 or both (Figures 3B and S3A), suggesting that KLF5 and SOX9 are important for tumor maintenance. To test whether lineage infidelity functions in tumor initiation, we used primary keratinocytes transgenic for an inducible HRAS oncogene and transduced them with Klf5 or Sox9 shRNAs. We then mixed in an equal number of control Scr-shRNA-transduced keratinocytes prior to each engraftment. Upon doxycycline administration to induce HRASG12V, tumors failed to form from Klf5 or Sox9 deficient cells (Figure 3C).
To better understand the purpose of lineage infidelity in tumorigenesis, we used HOMER (Heinz et al., 2010) and MolSigDB (Mootha et al., 2003; Subramanian et al., 2005) to search for molecular pathways associated with genes whose ATAC peaks are enriched for SOX9 and KLF5 motifs within previously mapped SCC-SC super-enhancers (Yang et al., 2015) (STAR Methods). Under these criteria, both SOX9 and KLF5 scored as putative governors of cellular responses to external stimuli, immune regulation, extracellular matrix (matrisome) and adhesion pathways. Cell proliferation genes showed some preference for KLF5, while invasive carcinoma genes correlated more prominently with SOX9 (Figure 3D). This was intriguing since KLF5 expression plateaued in early tumorigenesis, while SOX9 levels continued to rise during invasive carcinoma progression.
To assess the physiological significance of these correlations, we used our in utero lentiviral (LV) delivery method (Beronja et al., 2010) and generated K14-rtTA mice whose epidermis was selectively transduced with inducible Klf5 or Sox9 transgenes (Figure 3E). Three days after induction, adult mice were pulsed 2hr with 5-ethynyl-2′-deoxyuridine (EdU). SOX9+ EpdSCs displayed only a modest increase in proliferation but an enhanced ability to invade matrigel and migrate to the bottom well in a Boyden chamber assay (Figures 3E and 3F). Conversely, over-expressing KLF5 did not significantly alter EpdSC migration, but it boosted proliferation. Moreover, when Klf5 was depleted from SCCs, the proliferative (K5+) population was diminished concomitant with the appearance of differentiated (K10+) cells (Figures 3G and S3B–C).
Epithelial Wounding Displays Transient Lineage Infidelity
To acquire further insights into how and why tumor lineage infidelity occurs, we turned to the response of stem cells following injury, where proliferation, migration and invasion transpire naturally during the course of wound-repair. We reasoned that if tumors were to hijack and rewire normal processes to sustain malignancy, the roots of lineage infidelity might reside in wound repair.
To test this possibility, we employed partial-thickness wounding, a controlled process where skin epidermis and uppermost dermis is selectively removed, challenging the bulge HFSCs remaining in the dermis to re-epithelialize and restore the skin barrier (Figure 4A). Notably, by 3-5d post epidermal denuding, mobilized HFSCs in and above the bulge niche induced KLF5, resulting in its co-expression with SOX9. As wounds healed, SOX9 and KLF5 restored their homeostatic expression, demarcating HF and epidermis, respectively. Similar behaviors were seen with two other prominent lineage-specific TFs, TCF3 (HFSCs) and AP2γ (EpdSCs) (Figure S4A).
Figure 4. Epithelial Wounding Transiently Inflicts and Relies on Lineage Infidelity for Repair.
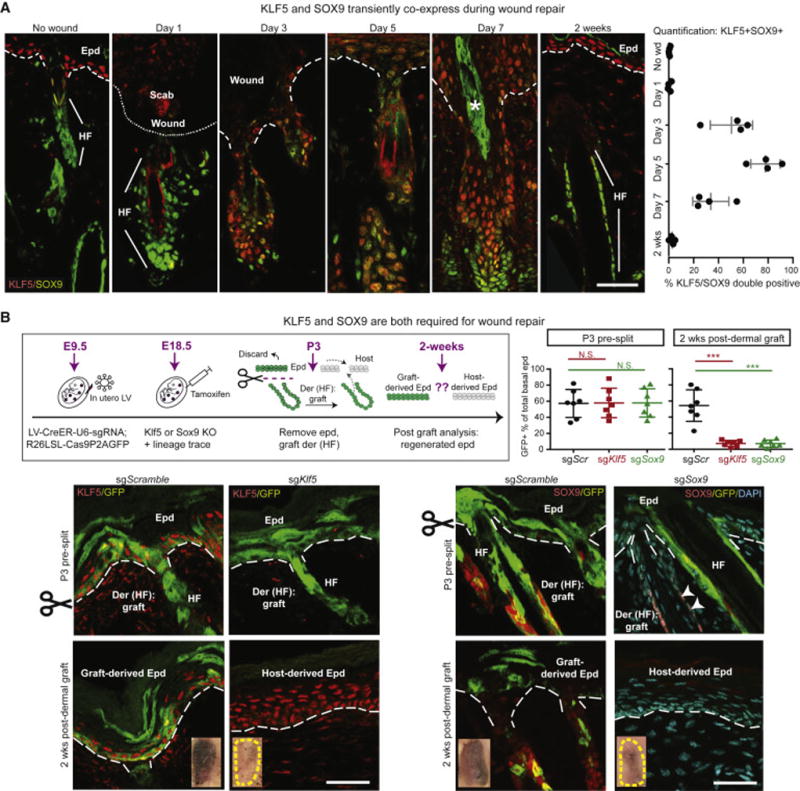
All images are representative and from at least 3 biologically independent replicates. Bars = 50μm. Dashed line denotes epidermal-dermal border.
(A) Temporal changes of SOX9 and KLF5 following a partial-thickness wound. Note co-expression peaks at height of wound-repair, and is subsequently resolved. Asterisk denotes artifactual autofluorescence of hair shaft.
(B) (Top left) Experimental design for inducing epithelial-specific Klf5 and Sox9 knockout by in vivo CRISPR/CAS and analyzing consequences to wound-repair. R26-LSL-Cas9-P2A-GFP E9.5 embryos were transduced with LV-CreER-U6-sgKlf5 or -sgSox9, followed by tamoxifen at E18.5. Postnatal pup backskin was either directly frozen for sectioning and immunofluorescence, or treated with EDTA to remove epidermis prior to dermal grafting. Grafts were analyzed 2wk later by FACS quantification of % GFP+ cells within total re-epithelialized EpdSCs (top right), or by immunofluorescence (bottom row). Note that in contrast to Scr sg controls, no contribution from GFP+ HF cells is detected in the regenerated epidermis without either Klf5 or Sox9. Arrowheads point to SOX9 signal in GFP- cells. n = 7 for FACS quantification. Paired t test was performed. ***P<0.001. N.S. not significant.
Also see Figure S4.
To address whether transient lineage infidelity is functionally relevant for wound repair, we ablated Sox9 and Klf5 individually in skin epithelium in vivo. We accomplished this by using in utero LV delivery to transduce CRISPR small guide (sg) RNAs and PGK-CreER selectively into multipotent nascent skin SCs of living E9.5 embryos harboring a Lox-Stop-Lox-Cas9-P2A-eGFP cassette within the ubiquitously active Rosa26 locus (Platt et al., 2014) (Figure 4B). After administering tamoxifen at E18.5 to activate CAS9 and eGFP expression permanently in Epd and HFs, we removed the epidermis from neonatal P3 skins and then engrafted the dermis (STAR Methods). This method is analogous to partial-thickness wounding in that it challenges HFSCs to re-epithelialize skin denuded of its epidermis.
Prior to split-thickness grafting, both Epd and HF compartments displayed efficient transduction with targeted TF gene ablation selective to the GFP-marked, CAS9-activated cells (Figures 4B ‘P3 pre-split’ and S4B–C). Following dermal engraftment, GFP+, CAS9-activated HF cells in the sgScr control group contributed efficiently to re-epithelialization (‘2wks post-dermal graft’). By contrast, only WT (GFP-, CAS9-inactive) cells from sgKlf5 or sgSox9 dermal grafts participated in Epd regeneration. These results pointed to a role for lineage infidelity in the context of wounding.
Similarities in Transcriptome and Chromatin Accessibility of Wound and Tumor
To search for common stress signals that might be instrumental in triggering the breakdown of SOX9-KLF5 lineage confinement in wound and tumorigenic states, we FACS-purified and transcriptionally profiled wound-induced, HF-derived YFP+ SCs (Wd-SCs) from skins of Sox9CreER;R26YFP mice (STAR Methods). Unsupervised clustering revealed strong similarities in transcriptomes of wounded and tumor (SCC-) SCs, and marked deviation from homeostatic SCs (Figures 5A and 5B).
Figure 5. Wounded and Tumorigenic Stem Cells Display Similar Transcriptomes and Genome-wide Chromatin Accessibilities.
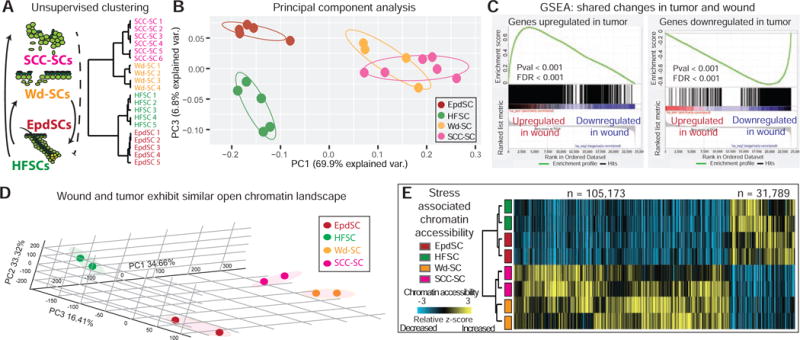
(A–B) Unsupervised hierarchical clustering and principal component analysis (PCA) of RNAseq data reveals similarities between SCC- and wounded (Wd)-SCs relative to homeostatic SCs.
(C) Gene set enrichment analysis (GSEA) reveals striking parallels in transcriptome changes that occur in tumor and wound vs normal SCs. Gene changes in tumor vs normal are compared against pre-ranked changes in wound vs normal.
(D) PCA of ATACseq signals from biological duplicates of FACS sorted tumor (SCC-), wound (Wd-), and normal (HF and Epd) SCs.
(E) Genome-wide ATAC signals in Wd-, SCC-, Epd- and HF-SCs are z-score-transformed and averaged across 100-bp genomic windows (N=# windows plotted). Hierarchical clustering shows divergence between normal (Epd and HF) and stress-experienced (Wd and SCC) SCs. Heatmap shows gain (yellow), loss (blue) or no change (black) of ATAC signals in normal:stress comparisons.
See also Figure S5.
Gene expression changes in wound and tumor from normal SCs were >98% concordant (Figure S5A), further corroborated by Gene Set Enrichment Analysis (GSEA) (Subramanian et al., 2005) (Figures 5C). By contrast, neither tumor nor wound resembled proliferative lineage-committed progenies of HFSCs (Figure S5B), indicating that the stress response mounted by wound-mobilized and tumorigenic SCs goes beyond mere proliferation status of the lineage.
Paralleling transcriptome profiles, global open chromatin landscapes of wound-SCs (Wd-SCs) were also more akin to SCC-SCs than to their homeostatic normal counterparts (Figure 5D and S5C–D, STAR Methods). A heatmap compiling hierarchical clustering of gain (yellow) or loss (blue) of ATAC signals graphically illustrated the striking convergence between wound and tumor, in contrast to their homeostatic SCs (Figure 5E).
Stress-induced TFs Drive Lineage Infidelity Irrespective of Stem Cell Origin
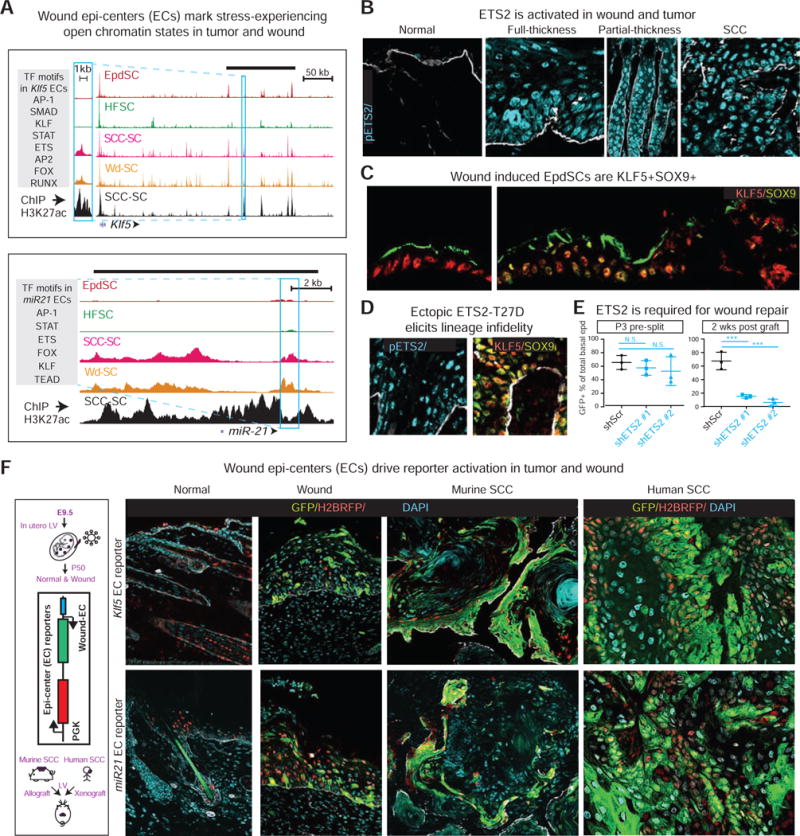
Enriched motifs of AP-1, ETS2 and often STAT3 distinguished the accessible regions of wound and tumor SC chromatin from that of homeostatic SCs (Figure 6A). Genes that acquired a plethora of new AP1, ETS2 and STAT-associated ATAC-peaks in SCC- and Wd-SCs included some that had been active in either homeostatic EpdSCs (e.g. Klf5, Ly6a, Hes1) (Figure 6A and S6A), or homeostatic HFSCs (e.g. Sox9; Figure S6B). Other genes such as miR-21 that acquired these ATAC peaks were induced specifically under stress situations (see Figure 1D). Consistent with the potential significance of these TFs, immunofluorescence of activated (phosphorylated) pETS2, pSTAT3 and AP-1 (JUN/FOS) displayed potent induction in tumorigenic and wound stress states (Figures 6B and S6C).
Figure 6. A Role for Stress-Induced Transcription Factors in Driving Lineage Infidelity in Wounds and Tumors.
All fluorescence images of tissues are representative of at least 3 biologically independent replicates. Bars = 50μm. Dashed line denotes epidermal-dermal border. Asterisks denote artifactual autofluorescence of Epd squames (C) or hair shaft (F).
(A) Shown are Klf5 and miR-221 ATAC of Wd-, SCC-, Epd- and HF-SCs and H3K27Ac ChIPseq of SCC-SCs. Boxes denote epicenters (ECs) cloned for testing their enhancer activities with eGFP reporters in vivo. Grey shaded boxes list TF motifs within these ECs. Overhead black bars denote annotated super-enhancers (SE) for Klf5 and miR-221 in SCC-SCs (Yang et al., 2015).
(B) pETS2 is induced in tumor and wound.
(C) SOX9 is induced in KLF5+ wounded epidermis (Epd), indicating that lineage infidelity occurs in Epd as well upon injury. Arrows indicate direction of wound closure.
(D) Forced activation of ETS2 in skin epithelium by transducing K14rtTA embryos with LV TRE-T72D-Ets2, and followed by 4wks doxycycline starting at P0 (Yang et al., 2015). Backskin was analyzed for pETS2, KLF5 and SOX9. Note ectopic KLF5 in HF and SOX9 in Epd.
(E) Ets2 knockdown in vivo dramatically impairs the ability of SCs to contribute to wound-repair. Shown are quantifications (n=3) of re-epithelialization contribution when split thickness grafts are deficient for ETS2 with two different shRNAs.
(F) Wound-induced epicenter-driven reporter activity (eGFP), in tumors and wounds, but not homeostatic skin. Control PGK-H2BRFP reveals equivalent LV transduction in all states.
See also Figure S6.
Notably, ETS2 was activated in both Epd and HFs of wounded skin (shown). Moreover, in full-thickness wounds, a condition that forces re-epithelialization from surrounding mobilized KLF5+ EpdSCs, SOX9 was induced near the wound edge (Figure 6C). This was analogous to the KLF5 induction that occurred in mobilized SOX9+ HFSCs (see Figure 4A). Finally, in both wounded tissue and papillomas, SOX9 and KLF5 were co-induced in the LRIG1+ cells of the upper HF, known to have SC potential and contribute to wound repair and tumorigenesis (Page et al., 2013) (Figure S6D). Collectively, these results strengthened the link between lineage infidelity and stress, irrespective of stem cell origin.
We next wondered whether stress-induced TFs might be causal to lineage infidelity. ETS2 was particularly intriguing given that ERK1/2, activated in wounding, is known to phosphorylate ETS2 at T72, thereby enhancing its activity (Foulds et al., 2004). We therefore focused on ETS2 to test the hypothesis that stress-responsive TFs cause lineage-infidelity.
When skin progenitors were transduced with ETS2-T72D in utero and then examined postnatally, the KLF5+ epidermis had activated the cohort of stress-responsive TFs as well as SOX9 (Figures 6D and S6E). The importance of ETS2 was further revealed by knockdown studies. When GFP-marked, shEts2-transduced skins of mice were denuded of their epidermis and engrafted, re-epithelialization came exclusively from non-GFP surrounding host epidermis, in contrast to shScr control skins where the engrafted dermis (HFs) participated efficiently in wound repair (Figure 6E). Together with our previous observation that pETS2 is required for tumor maintenance (Yang et al., 2015), these data suggest that activated ETS2 is both sufficient to induce lineage infidelity and a prerequisite for such stress responses.
Activation of Stress-Induced Epicenters in Wounds and in SCCs of Mice and Humans
Previously, we identified large open chromatin domains that were specifically marked by strong histone H3K27Ac peaks in SCC-SCs (Yang et al., 2015). In comparing those ChIPseq profiles with our new data, we were intrigued to find that many of the ATAC peaks which were induced specifically in wounds, and then maintained in tumors, resided within SCC-SC super-enhancers. Notably, these ATAC peaks were also shouldered by strong active (H3K27Ac) histone marks (see Figure 6A). Within these ATAC signals were densely clustered motifs of ETS, AP1 and STAT TFs [‘epicenters (ECs)’], leading us to wonder whether they might be reflective of unique enhancer elements that activate genes in a stress-induced state. To test this, we cloned them into LV reporters (with internal H2BRFP control) and examined their ability to drive eGFP expression in vivo.
In homeostasis, skin displayed only nuclear H2BRFP, indicating efficient transduction but no epicenter activity (Figure 6F). However when wounded, the skin showed striking activation of eGFP, indicating commissioning of the stress-responsive epicenter. Marked eGFP expression was also found in invasive human and mouse SCCs generated by transduction and engraftment (Figure 6F). These results illustrated the functionality of the de novo ATAC peaks of wound and tumor, and extended their relevance to human cancers.
Resolution of Lineage Infidelity After Wound Repair
In contrast to cancers, wounds only induced lineage infidelity transiently, as evidenced by the switch in identity from HFSCs to EpdSCs as wounds healed. To understand how this happens, we considered functions of SOX9. In HFSCs, SOX9 loss results in epidermal conversion (Kadaja et al., 2014), while in EpdSCs, ectopic SOX9 elicits activation of other HFSC identity genes (Adam et al., 2015). Thus to achieve the HFSC to EpdSC fate switch, Sox9 must be silenced.
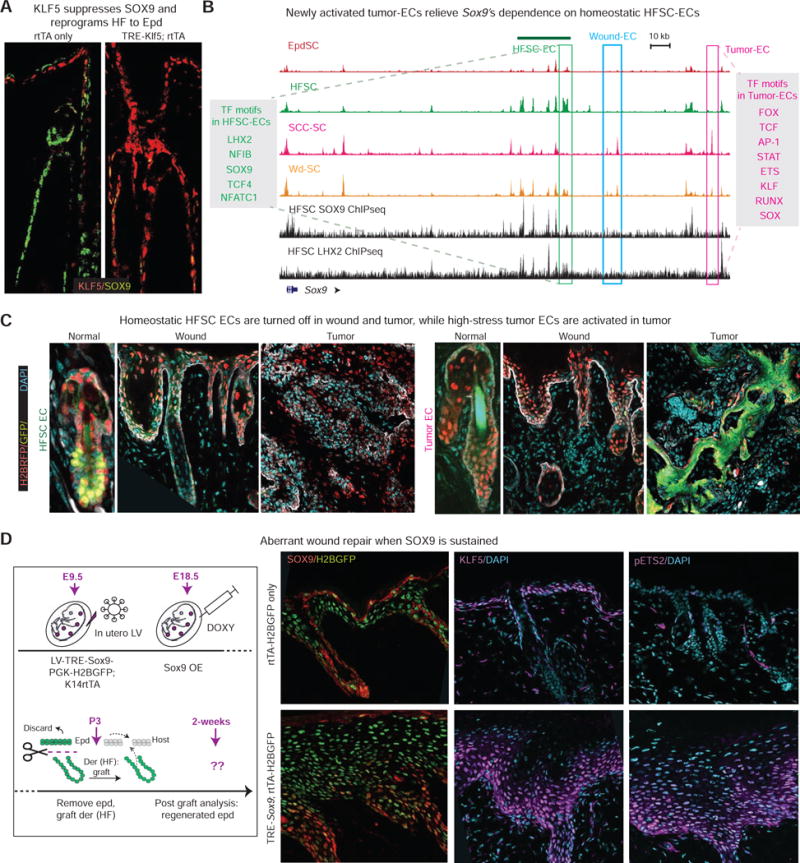
One possibility is that KLF5 antagonizes Sox9, as posited previously based upon their expression patterns and the presence of KLF5 motifs in the Sox9 promoter (Bell et al., 2013; McConnell et al., 2011; Nandan et al., 2014). Indeed, when we transduced K14rtTA embryos with a doxycycline-inducible Klf5 LV and then induced KLF5 expression in adult HFs, SOX9 was diminished along with another HFSC marker TENASCIN C, while EpdSC markers K10 and LORICRIN were activated (Figures 7A and S7A). These results support a model whereby ETS2 activation in the HFSCs of wounded skin triggers KLF5 expression, in turn suppressing the homeostatic regulation of Sox9 and driving the reprogramming from HF to Epd fate as the epidermal barrier is being restored.
Figure 7. Newly activated epicenters Lock Tumors Into Sustained Lineage Infidelity.
All fluorescence images are representative and from at least 3 biologically independent replicates. Bars = 50μm. Dashed line denotes epidermal-dermal border.
(A) Within 2 wks forced activation of KLF5, SOX9 is suppressed in adult HFs.
(B) ATAC peaks at the Sox9 locus of Wd-, SCC-, Epd- and HF-SCs, and contrasted with SOX9 and LHX2 ChIPseq peaks of HFSC-SCs. Three types of epicenters are boxed: HFSC-EC green, Tumor-EC pink, Wound-EC blue. Note silencing of Sox9’s homeostatic enhancer and activation of new tumor-specific enhancer in SCC-SCs.
(C) Sox9’s homeostatic enhancer drives GFP reporter activity only in HFSCs and not in tumor or wound states, while Sox9’s tumor-EC is active only in SCCs and not in wounds or normal homeostatic skin. Note the contrast to wound-ECs, which are active in both wounds and tumors (Figure 6). All reporters were transduced comparably (H2BRFP).
(D) Forced activation of SOX9 in skin epithelium was achieved by transducing TRE-Sox9 embryos with LV rtTA-H2BGFP, and then treating animals with doxycycline just prior to split-thickness engraftment. Skin grafts were then analyzed 2wk later, with half used for sectioning and immunofluorescence and the other half for EdU pulse and analyses.
See also Figure S7.
New Epicenters Are Activated in Malignancy to Lock Tumors Into Lineage Infidelity
If KLF5 suppresses Sox9 and reprograms the HF lineage into epidermis during wound healing, why then is lineage infidelity sustained in malignancy? To understand how Sox9 escapes KLF5 suppression during tumor progression, we compared the ‘Model-based Analysis of ChIPseq2′ defined ATAC peaks (STAR Methods) within the Sox9 locus of SCC-SCs to those of normal and wounded SCs (Figure 7B).
Although wound-induced epicenters remained open in SCC-SCs (blue box), new tumor-specific ATAC peaks emerged (pink box). Interestingly, the tumor-activated epicenters showed binding motifs for SOX, as well as KLF, ETS and AP1. Since these composite enhancer elements of stress and lineage TFs were newly commissioned in tumor, we posited that elevated oncogenic RAS/MAPK, upstream from ERK1/2 and ETS2 (Yang et al., 2015), might be responsible. Such a notion would be consistent with our findings that under stress, Sox9 and Klf5 became dependent upon ETS, and that forced ETS2 activation caused elevation of SOX9 and KLF5. Indeed, as ETS2 and KLF5 rose, homeostatic HFSC epicenters were diminished during wounding, and were completely decommissioned in SCCs (Figure 7B, green box).
Our observations so far suggested an appealing hypothesis that during tumor-progression, skin SCs first silence homeostatic enhancer elements and activate low-stress wound-induced regulatory elements (wound-EC). Then as RAS-MAPK and pETS levels rise, composite high-stress elements (tumor-EC) are activated, upon which point tumor bifurcates from the wound. If this model is correct, then unlike wound-induced epicenters that were active in both wound and tumor (see Figure 6F), tumor-induced epicenters should be activated only in tumorigenic conditions. In contrast, the HFSC epicenter should be silenced once stem cells exit homeostasis.
We tested our hypothesis by transducing skins with our Sox9 epicenter reporters in utero and analyzing postnatally. As shown in Figure 7C, the HFSC epicenter was active in normal homeostasis but silenced in wound and tumor states. By contrast, the tumor epicenter was silent in homeostatic and wound states, but active in tumor. Interestingly, the tumor epicenter was active irrespective of the tumor being invasive or benign (Figures 7C and S7B), suggesting that even an early neoplasm may have passed the “point-of-no-return” from wound to tumor with respect to chromatin states.
Finally, since SOX9 waned in re-epithelialized epidermis but persisted in SCCs, we tested the consequences of sustaining SOX9 during wounding-healing. To this end, we engineered TRE-Sox9; LV-rtTA-PGK-H2BGFP mice, applied doxycycline, wounded and then analyzed skin two weeks later. Whereas control skin had returned to homeostasis, skin with sustained SOX9 displayed aberrant epidermal thickening with high KLF5 and pETS2 levels, reminiscent of a neoplastic state (Figures 7D and S7C–D), suggesting that the antagonistic circuitry between KLF5 and SOX9, seen in both homeostatic and wounded HFSCs, was now overcome.
DISCUSSION
Lineage Constraints on Stem Cells are Transiently Unleashed in Wound-Repair and Permanently Unhinged in Cancer
In tackling the age-old hypothesis that tumors are wounds that never heal, we’ve unearthed a striking lineage infidelity phenotype that arises transiently in a wound response and persists in malignancy. Confined Epd and HF lineages under homeostasis are transiently blurred during wound-repair. All vestiges of lineage confinement break down as lineage infidelity becomes permanent in cancer. At the root of these lineage decisions are two master regulators of fate determination: KLF5 (EpdSCs) and SOX9 (HFSCs). Our combined use of inducible epithelial CRISPR/CAS targeting, and in utero lentiviral CreER and guide RNA delivery exposed hitherto unrecognized roles for these TFs in wounds and in SCCs, as elaborated upon below.
Physiological Relevance of Lineage Infidelity in Wound-Repair and SCC
In contrast to SOX9, which is known to govern HFSC identity, relative little was known about KLF5’s skin functions. We discovered that KLF5 is not only spatially associated with but also essential for EpdSC fate. Our studies suggest that KLF5 is induced early in HFSCs upon epidermal injury, and by virtue of its ability to suppress Sox9, KLF5 enables the reprogramming to EpdSCs that is necessary for HFSCs to regenerate epidermis during wound-repair. The similar antagonistic relation between KLF5 and SOX9 in the intestine and colon (Bell et al., 2013; McConnell et al., 2011; Nandan et al., 2014) hints at their broader importance in cell fate decisions.
Our studies further showed that by activating a group of targets that are preferentially associated with cell proliferative activities, KLF5 reinforces the proliferative features of the malignant state, a previously recognized attribute of this TF (Sur et al., 2006). Importantly, our loss of function studies showed that malignant progression is stalled and SCCs collapse when KLF5-deficient SCs terminally differentiate.
Our findings also unveiled a newfound importance of SOX9 during wound-repair and SCC malignant SCC progression. Importantly, by constitutively expressing SOX9 in epidermis, which we discovered happens transiently in wounds, the epidermis receives a potent push to the neoplastic state. In this regard, SOX9’s behavior resembles two other wound-induced regulators, TGFα (Vassar and Fuchs, 1991) and JUN (Schuh et al., 1990). SOX9 was also recently found to be essential for basal cell carcinomas, which in contrast to RAS/MAPK-driven SCCs (Balmain and Yuspa, 2014), are rooted in aberrant Sonic Hedgehog pathway (Larsimont et al., 2015; Vidal et al., 2005). Intriguingly SCCs differ in that they also express SOX2 (Boumahdi et al., 2014; Siegle et al., 2014). Given that both SOX2 and SOX9 display phenotypic consequences when lost, their possible non-redundant roles merit future investigation.
Wound and Tumor Converge on Lineage Infidelity Irrespective of Stem Cell Origin
Regardless of SC origin, lineage infidelity surfaced in HFSCs and in EpdSCs in response to injury. In full-thickness wounds, mobilized EpdSCs at wound edges induced HFSC identity TFs SOX9 and TCF3, before resolving back to EpdSC. In partial-thickness wounds, mobilized HFSCs first induced EpdSC identity TFs KLF5 and AP2γ, and then lost their own identity as they re-epithelialized the denuded epidermis and restored the skin barrier. Similarly, even though both HFSCs and EpdSCs can be the cell of origin for SCCs (Lapouge et al., 2011; Latil et al., 2016; White et al., 2011), we show here that this dual-lineage state is a hallmark of their RAS/MAPK induced malignant progression. Given the established deviations in epithelial-stromal communication that occur in wounds and cancers, it will be interesting to see in the future if lineage infidelity also occurs in associated stromal cells.
Tumor Diverges From Wound as Lineage Plasticity Persists
Upon injury or tumorigenesis, potent mitogens emanate from the vasculature and its surroundings, and stem cells respond by activating stress-responsive TFs such as ETS2. A similar situation arises when culturing SCs in serum and growth factor-rich media. Why then is the lineage infidelity state reversible in a wound or culture but sustained in cancer?
Our collective results suggest the model illustrated in Figure S7E. In normal homeostatic EpdSCs, KLF5 keeps Sox9 suppressed, while in HFSCs, SOX9 reigns, governed by HFSC master TFs, including itself (Adam et al., 2015). Upon injury or in tumor, HRAS/MAPK signaling phosphorylates ETS2, spawning the activation of stress-associated ETS/AP1-driven regulatory elements present within both Klf5 and Sox9 super-enhancers. This overrides the normal homeostatic regulatory elements, and marks the onset of lineage infidelity. As ERK1/2 and pETS2 levels wane near the conclusion of wound-repair, the reliance upon such stress-associated enhancers diminishes. In EpdSCs and in HFSC-derived progeny that have reached the epidermis, KLF5 ensures the silencing of Sox9 to complete fate switch and restore epidermal homeostasis.
The model further suggests that during malignant progression, newly emerging “high-stress” epicenters (tumor-specific) join the “low-stress” epicenters (shared by both wound and tumor), thereby signifying the divergence from wound to tumor. This expanded enhancer landscape is rooted in composite regulatory elements comprised of both stress-induced- and lineage-TF motifs. The commissioning of these new regulatory elements is likely the consequence of the rise in HRAS/MAPK activity during malignant progression (Quintanilla et al., 1986; Rodriguez-Puebla et al., 1999). This leads to sustained phosphorylation and activation of ETS2 (Foulds et al., 2004; Yang et al., 1996), which in turn elevates both Sox9 and Klf5 expression, as our studies here show.
In summary, our comparative landscaping of open chromatin domains across different lineages and states illustrate how microenvironmental stress signals can trigger stem cell fate switching through the activation of stress-induced regulatory elements and silencing of homeostatic enhancers. During this process, a plastic state of lineage infidelity endures regardless of stem cell origin. Our functional evidence documents that such plasticity is essential for SCs to transition through stressful environs and heal wounds. Finally, we show that sustained stress signals induce new regulatory elements driven by combined usage of lineage and stress-responsive TFs, generating a “wound that never heals”. Our study now illuminates the clinical path to regulatory drivers that selectively target malignancy while sparing normal stem cells.
STAR Methods
CONTACT FOR REAGENT AND RESOURCE SHARING
Further information and requests for resources and reagents should be directed to and will be fulfilled by the Lead Contact, Elaine Fuchs (fuchslb@rockefeller.edu).
EXPERIMENTAL MODEL AND SUBJECT DETAILS
All animal experiments were performed in the AAALAC-accredited Comparative Bioscience Center at The Rockefeller University. Experiments were in accordance with NIH guidelines for Animal Care and Use, approved and overseen by The Rockefeller University’s Institutional Animal Care and Use Committee. For in utero injections, pregnant females were used at embryonic day E9.5, just after gastrulation. For the rest of the experiments, treatments on both males and females were begun at adult age of P50–P60 (second telogen of hair cycle). Animals of both sexes were used in the analysis. See Method Details for sample size selection and randomization strategies. Sex of mouse keratinocytes and squamous cell carcinoma cells not available.
METHOD DETAILS
Fluorescence Activated Cell Sorting and Analysis
Purification of adult populations was performed using P60 second telogen WT mice. Purifications of tumor populations were performed using transplants of SCCs from mice on a TGFβRII-deficient, oncogenic HRAS (Tbra2−/−;HrasG12V) background. Purifications of wound populations were performed using Sox9CreER;R26YFP mice that had been treated with tamoxifen at postnatal day P53, wounded at P60 and then collected at P67.
For partial thickness wounds, we used a Dremel drill head to gently scrape against the backskin of anesthetized mice. Our method removes the upper HF, including most infundibulum and isthmus cells, but leaves the CD34+ SOX9+ bulge. For adult cell isolations, backskins were first scraped from the dermal side to remove fat. For tumor isolations, tumors were first minced and then placed in collagenase solution (Sigma, 0.25% in HBSS) for 1 h at 37°C, followed by collection of the cells by centrifugation at 300 × g 4°C. For wound isolation, the wound center was dissected and treated with ethylenediaminetetraacetic acid (EDTA, 50mM) for 30min at 37°C, after which the epidermis was peeled off with a forceps. The remaining epidermal side (adult skin) or cell mixture (tumor) or epidermis (wound) was then transferred to trypsin [Gibco, 0.25% in phosphate buffered saline (PBS)] at 37°C for 10 min.
Single-cell suspensions were obtained by scraping the skin from the epidermal side (adult skin) or pipetting (tumor or wound) gently. The cells were then filtered through 70μM followed by 40μM strainers, and pelleted at 300 × g 4°C. For fluorescence activated cell sorting (FACS) analysis, 5-ethynyl-2′-deoxyuridine EdU was administrated through intraperitoneal injection at 100μl (5mg/ml) per 20 g mouse weight for 1 h before euthanasia. Cells were first stained with Live/Dead Blue (Life Tech, 1:100), and then fixed, permeabilized, immunostained with anti-GFP (1:1,000), followed by EdU Click-iT reactions (Thermo Fisher) and Alexa Fluor (IntA6) staining.
For FACS sorting, cell suspensions were incubated with the appropriate cell surface antibodies for 30 min on ice and washed. Single cell suspensions were first gated against 4′,6-Diamidino-2-Phenylindole, Dihydrochloride (DAPI) to exclude dead cells, and then with forward and side scatters to gate for singlets. Lineage-negative gating was performed with the following surface antibodies: CD31 for endothelial cells, CD45 for immune cells, CD117 for melanocytes, and CD140a for fibroblasts.
Adult EpdSCs were further gated as Integrin-α6+ Sca1+ and CD34neg, while HFSCs were gated as Integrin- α6+ CD34+ and Sca1neg. To isolate HFSCs from wounded-activated skin, we gated on YFP+ (cells derived from SOX9+ SCs activated prior to wounding) and Integrin-α6+. To purify the tumor SC populations, tumor grafts formed from previously characterized GFP-expressing, aggressive SCCs (Yang et al, 2015) were gated as GFP+ Integrin-α6+ and Integrin-β4+. Whether cultured, or injected directly into recipient mice, these basal SCC cells have been previously shown to have tumor-initiating properties characteristic of cancer stem cells (Schober et al 2011; Oshimori et al, 2015). Our findings here corroborate this behavior as shown by the tumor-initiating assays in figures throughout the manuscript.
Sources and concentrations of antibodies were: CD34_eFluor660 (1:100, eBioscience 50-0341-80), IntA6_PE (1:100, BD Bioscience 551129), IntB4_Alexa647 (1:1,000, eBioscience 142911), Sca1_PerCP-Cy5.5 (1:1,000, eBioscience 45-5981-80), CD140a_PE-Cy7(1:100, eBioscience 14-1401-81), CD31_PE-Cy7 (1:1,000, eBioscience 25-0311-81), CD117_PE-Cy7 (1:1,000, eBioscience 25-1171-82), CD45_APC-eFluor450(1:1,000, eBioscience 48-0451-80). DAPI (0.2 μg/ml) was used to exclude dead cells. Sorting was performed on a BD FACSAria II equipped with Diva software (BD Biosciences). Analyses were performed on LSRII FACS analyzers and FlowJo, available in Rockefeller’s FACS facility.
ATAC-Seq
ATAC-seq libraries were made from freshly FACS-sorted stem cells, with two biologically independent replicates for cell population. Library preparations and analyses were performed as described (Buenrostro et al., 2013). Briefly, Freshly FACS-sorted cells (20K–200K) were subjected to tagmentation reactions with 2–10μl TnD transposase (Illumina), cleaned up with QIAquick PCR Purification Kit (Qiagen) and PCR-amplified with 10–15 cycles. Library concentrations and quality were confirmed with D1000 Tape Station (Agilent) prior to sequencing.
RNA-Seq and Quantitative PCR
Normal HF-, Epd- and SCC-SCs were isolated as previously described (Ge et al., 2016). For wound-activated SCs (Wd-SCs), adult second telogen (P60) Sox9CreER; R26YFP female mice were subjected to full-thickness 7mm punch wounds. Seven days post-wounding, single cell suspensions were obtained by FACS as Lineage-YFP+ Integrin-α6+ (HF-derived) and Lineage-YFPneg Integrin-α6+ (Epd-derived). Cells were lysed with TrizolLS (Invitrogen) and total RNA was isolated with the Direct-zol RNA MiniPrep kit (Zymo Research) and submitted to the Genomics Resources Core Facility of the Weill Cornell Medical College for quality control (determined using Agilent 2100 Bioanalyzer, with all samples passing the quality threshold of RNA integrity numbers (RIN 8). Library constructions were performed using IlluminaTruSeq Stranded mRNA Sample Prep Kits, and sequencing was performed on an Illumina HiSeq2000 sequencing machine.
For RNA quantitative PCR, primers DNA oligos were synthesized from Eurofinsgenomics complementary DNAs were generated from 1μg of total RNA using the SuperScript Vilo cDNA synthesis kit (Life Tech), diluted and used as templates for real-time PCR performed with the 7900HT Fast Real-Time PCR System (Applied Biosystems) and gene-specific primers listed in Table S2. Glyceraldehyde dehydrogenase (GAPDH) was used as a loading reference.
Immunofluorescence and Microscopy
For immunofluorescence, skin samples (sections) or embryos (whole mount) were pre-fixed in 4% paraformaldehyde (PFA) in phosphate buffered saline (PBS) for 1hr at 4°C and washed extensively in PBS. For sections, samples incubated with 30% sucrose in PBS overnight, embedded in Optimal Cutting Temperature (OCT) compound (Tissue Tek), and sectioned at a thickness of 12μm. For whole-mount, embryos were washed with PBS overnight at 4°C and then dissected under dissection scope. Tissue samples were then blocked at room temperature in Gelatin Block (2% fish gelatin, 5% normal donkey serum, 1% bovine serum albumin, 0.3% Triton, in PBS). When immunolabeling with mouse antibodies, sections were incubated with the M.O.M. blocking kit (Vector Laboratories). Samples were then incubated with primary antibody overnight at 4°C, washed in PBS, and then exposed to secondary antibody for 1hr at room temperature (sections) or overnight at 4°C. Following these steps, samples were then washed in PBS, and mounted in ProLong Gold with DAPI (Life Tech) prior to imaging. The following primary antibodies and dilutions were used: KLF5 (goat, 1:50, R&D), SOX9 (rabbit, 1:300, E. Fuchs), P-Cadherin (goat, 1:400, R&D), LHX2 (rabbit, 1:2000, E. Fuchs), TCF3 (rabbit, 1:1000, E. Fuchs), GFP (chicken, 1:2000, Abcam), JUN (rabbit, 1:1000, Cell Signaling), FOS (rabbit, 1:100, Abcam), pSTAT3 (rabbit, 1:1000, Cell Signaling), pETS2 (rabbit, 1:200, Thermo Fisher Sci), K5 (rabbit, 1:500, E. Fuchs), K10 (rabbit, 1:1,000, Covance), LRIG1 (goat, 1:50, R&D), AP2g (mouse, 1:100, Millipore), Secondary antibodies were conjugated to Alexa488, 546, 647 (1:1,000, Life Technologies A-11006). Images were captured on a Zeiss Axioplan2 using a Plan-Apochromat 20×/0.8 air objective. For whole mount imaging, z stacks of 20–40 planes (0.25mm) were acquired. Images were processed using ImageJ and Adobe Photoshop CS5.
Human SCC Xenografts and Metastases
Cells from human head and neck SCC line A431 were infected in culture with lentiviruses (LVs) harboring the desired epicenter reporter and a ubiquitously active control PGK-H2BRFP gene. RFP+ transduced cells were purified by FACS and then grafted (50K) onto Nude mouse backskin. After 3 wk, primary tumors were harvested. To generate lung metastases, we injected 1 million transduced cells into Nude mice (Taconic) and waited 2 months prior to analyses of the lungs.
CRISPR/CAS Knockouts in Vivo
To identify efficient CRISPR guide RNAs (sgRNAs), we synthesized DNA oligos from Eurofinsgenomics and subcloned into pLentiGuide-Puro, transiently transfected pLentiGuide-Puro carrying sgRNAs against Klf5 or Sox9 (Doench et al., 2016; Sanjana et al., 2014) into cultured keratinocytes, and then exposed to puromycin (3μg/mL) for 2d for selection of transduced cells. We then isolated RNAs, and measured target gene expression by qPCR. The most efficient guides (as judged by qPCR) were then subcloned into LV-Cre or LV-CreER LV vectors and packaged into high-titer virus, followed by in utero LV injection into E9.5 R26-LSL-Cas9-P2A-GFP embryos. In vivo ablations were validated by immunostaining of E18.5 (sections) or E16.5 (whole mount) embryos. For wounding assays, LV-CreER driven CAS9 activation (hence target gene ablation) was first induced by administrating a single dose of tamoxifen (200μl at 20mg/mL per 40g body weight) by oral gavage at E18.5. This minimized the aborted litters that were otherwise frequently obtained with intraperitoneal tamoxifen injections at doses sufficient to induce recombination.
CRISPR/CAS Knockouts in SCC-SC Cells
Guides against Klf5 or Sox9 were selected as described above and the most efficient guides were then subcloned into plentiCRISPRv2 vectors (Sanjana et al., 2014). sgRNAs against Scrambled sequences were used as controls and done side-by-side with sgRNAs against target sites throughout the experiments to rule out phenotypic changes due to nonspecific targeting. The plentiCRISPRv2 vectors carrying our targeting sgRNAs were then packaged into LV and used to transduce SCC-SCs cells. Transduced cells were selected with puromycin (3μg/ml) for 2d, and then transplanted into the backs of immunocompromised Nude mice. Quantitative PCRs were performed prior to transplantations to validate the effectiveness of gene knockouts. At least two small guides for each gene were tested and results were consistent for all examples shown.
Tumor Growth Curves
SCC-SCs were transduced with pLentiV2 CRISPR sgRNAs against Scramble, Klf5 or Sox9, respectively. Transduced cells were then briefly selected with puromycin for 2d, and then transplanted onto the backs of immunocompromised (Nude) mice by intradermal injection as previously described (Ge et al., 2016). Animals were monitored every 3d for a month. Tumor size was measured using a digital caliper, and tumor volume was calculated using the formula (π(length × width)2)/6. GraphPad Prism software was used to generate the tumor growth curves and to calculate the P value by two-way ANOVA with repeated measurement test.
LV-mediated Transductions and shRNA Knockdowns In Utero and In Primary Keratinocytes
Initial screening of efficient small hairpin RNAs (shRNAs) was carried out by transiently transfecting pLKO-shRNA carrying shRNAs against Klf5 or Sox9 (Sigma) into cultured keratinocytes, selecting with puromycin (3μg/mL) for 2d, isolating RNA, and measuring gene expression by qPCR. The most efficient hairpins (as judged by qPCR) were then subcloned into LV-H2BGFP vectors and packaged into high-titer virus. Transductions were achieved by in utero injection of lentivirus into the amniotic sacs of E9.5 WT outbred CD1 embryos (Taconic) (Beronja et al., 2010). At this stage, the skin exists as a single layer of unspecified progenitors, which become efficiently transduced within 24 hr. Thereafter, the DNA carried by the lentivirus is stably propagated into adulthood within the epidermis and hair follicles. In utero LV deliveries were used for all knockdowns or knockouts required for wounding assays. LV transduction of primary keratinocytes isolated from TRE-HRasG12V;K14-rtTA mouse backskin were used for tumor initiation competition assays.
Cell Culture and Boyden Chamber Assay
Mouse SCC-SC cell lines were isolated from malignant tumors and previously reported (Schober et al., 2011)(Yang et al., 2015). Mouse keratinocytes were isolated and cultured as previously described (Blanpain et al., 2004; Guasch et al., 2007). SCC-SC cells were cultured in E intermediate calcium medium (contains 300μM calcium); mouse keratinocytes were cultured in E low calcium medium (contains 50μM calcium), made in house (Blanpain et al., 2004).
For cell migration assays, keratinocytes were cultured in regular culture media until close to confluent, and then placed in serum-free P media containing 0.3mM calcium overnight. The second day, cells were treated with mitomycin C (10μg/ml) for 2hr 37°C to arrest cell proliferation. 24mm Corning Transwell polycarbonate membrane cell culture inserts with 8.0 um pore were coated with fibronectin on the bottom side and matrigel on top side of the membrane. 2.5mL of 3T3-fibroblast feeder conditioned E low calcium media (left for 24hr on feeders) was placed into bottom wells of Boyden Chambers (Corning 24mm Transwell with 8.0μm Pore Polycarbonate Membrane Insert), and cells were seeded at 2 million cells per insert in 1.5mL P media onto the top of membrane to reach ~70% confluency. After incubating for 24hr, cells from both chambers were trypsinized and media was added slowly to resuspend the cells and place them into collection tubes for counting.
Partial- and Full-thickness Wounding
For full-thickness wounds, adult mice whose HFs were in the extended (2 month) second telogen were anesthetized. Their backskins were then shaven, and 6 mm punch wounds were created. For partial-thickness wounds, we used the wounding method modified from (Levy et al., 2007). Briefly, skins were gently stretched between two fingers, and a Dremel tool with a polishing wheel was used to generate abrasions by polishing the skin laterally for 4 times (100 series rotary tool and 520 polishing wheel from Dremel Inc).
Split- and Full-thickness Engraftments
Split- and Full-thickness grafts were performed as previously described (Nowak et al., 2008; Rhee et al., 2006). Briefly, for full-thickness grafts, head skins from early postnatal (P3) mice were dissected and placed onto the backs of anesthetized female nu/nu (Nude) recipient mice. Grafts were secured by sterile gauze and cloth bandages, which were removed after healing (14d). For split-thickness grafts, head skins from P3 mice were placed dermis-side up in 50 mM EDTA in PBS for 1 hr at 37°C. The epidermis was removed as a single sheet from hair follicle/dermis. Denuded dermis was then grafted in the same manner as full thickness grafts. For these engraftments, we used P3 skins from R26-LSL-Cas9-P2A-GFP animals which had been transduced in utero with an inducible Cre recombinase and either scramble guide (LV-CreER-sgScr) or guide against gene of interest (LV-CreER-sgGene). In all cases, paired sgScr and sgGene partial-thickness grafts of comparable size were grafted side-by-side, with full-thickness grafts as control on the same Nude recipient mouse.
QUANTIFICATION AND STATISTICAL ANALYSIS
RNA-Seq Alignment and Differential Expression Analysis
Raw sequenced reads were aligned to the Mouse reference genome (Version mm10 from Genome Reference Consortium GRCm38) using STAR (Version 2.4.2) aligner. Aligned reads were quantified against the reference annotation (mm10 from UCSC) to obtain FPKM (Fragments per Kilobase per million) and raw counts using CuffLinks (v 2.2.1) and HTSeq, respectively. Differential expression to compare expression profiles of respective groups was performed on normalized raw counts using the limma package in R (http://bioconductor.org/packages/release/bioc/html/limma.html). Genes with absolute log2 fold change > 2 and false discovery rate (FDR) < 0.05 were considered to be significantly differentially expressed.
Hierarchical Clustering and Principle Component Analysis
In order to classify the samples based on gene expression profiles, we performed unsupervised clustering, namely Hierarchical data clustering and Principal Component analysis (PCA). Both methods were performed on the log2 transformed FPKM expression values in R statistical software.
Gene Set Enrichment Analysis
Pathway analysis using GSEA (Gene Set Enrichment Analysis Software) Software from the Broad Institute (Massachusetts Institute of Technology) was used to identify functions of differentially expressed genes. Genes were ranked by the t-statistic value obtained from comparisons and the pre-ranked version of the tool was used to identify significantly enriched biological pathways. Pathways enriched with false discovery rate (FDR) < 0.25 were considered to be significant.
ATAC-Seq Alignment and Peak Calling
50-bp paired-end reads were aligned to the most recent genomic builder for mus musculus (Version mm10 from Genome Reference Consortium GRCm38) as previously described (Buenrostro et al., 2013). Briefly, mapping was performed using Bowtie package with the parameters “–X 2000” and “–m 1” to align 50-bp paired-end reads. Duplicates were removed using Picard (https://github.com/broadinstitute/picard/releases/tag/2.7.1). Peaks were called using Model Based Analysis of Chip-seq 2 (MACS2; 2.1.1.20160309) (Zhang et al., 2008) with the parameter “–keep-dup all” which allows the MACS package to skip the filtering step and keep all the sequencing reads generated by combining experimental replicates.
TSS and CTCF plots
Average ATAC signals for Transcription Start Sites (TSS) (+/− 3000 bp) and CCCTC (CTCF) binding sites (+/− 1000 bp) were plotted in each sample. CTCF binding sites were used as a stable reference to scale average profiles. Simple linear transformations were applied to match CTCF profiles across conditions. CTCF sites were derived from CTCF Peaks called in E14.5 C57BL/6 Limb embryo from ENCODE (Accession: ENCFF001YAK) and converted to mm10 coordinates using liftOver (UCSC genome browser).
Principal Component Analysis of ATAC signals
PCA analyses were performed on the union set of peak calls for Epd-SC, HFSC, SCC-SC (Figure 1), and Wd-SC (Figure 5), and then combined and merged using BEDTools. Read counts were summed for each genomic region, and then normalized for sequencing depth, and finally log transformed.
Z-Score Transformation and Hierarchical Clustering of ATAC Signal and Cumulative distribution Plot
To normalize data across different samples, ATAC signal was Z-score transformed to indicate how many standard deviations each bp is above or below the mean signal using the average ATAC signal per base-pair over the genome, excluding chromM and chromY for each sample. Scores were then averaged over 100-bp non-overlapping windows. To filter out regions of background signal, we required that the windows averaged greater than 1 in all replicates. Significance was assayed between groups using a t-test (p-value < 0.05). Filtered data were then clustered using Cluster 3.0 (Eisen et al., 1998) and visualized using Java Treeview (Saldanha, 2004). Significantly altered windows were then associated with genes and subjected to pathway enrichment using GREAT (McLean et al., 2010).
Cumulative Distribution Plot
ATAC-seq peaks for tumor and epidermis were associated with genes using GREAT (McLean et al., 2010) and quantified as peaks per gene. Log2FC (Tumor/Normal) of gene expression was presented as a cumulative distribution for a) genes demonstrating an increase in number of ATAC peak associations in tumor relative epidermis (gain of at least 6 peaks, green), loss of ATAC peaks (loss of at least 1 peak, red), and all genes (black).
Motif Analysis of ATAC Peaks
Intersecting or unique ATAC peaks were generated via BEDTools v2.25.0 (Quinlan and Hall, 2010). HOMER (Heinz et al., 2010) de novo motif search was used to generate the list of enriched sequence motifs that matched known transcription factor binding sites. For putative Sox9 and Klf5 targets, HOMER-derived target gene lists were then subjected to MolSigDB (Broad Institute, MIT) and scored for significantly enriched pathways associated with each gene within previously annotated super-enhancers for normal SCs (Adam et al., 2015) or SCC-SCs (Yang et al., 2015).
Statistics and Blinding
Statistical analyses were performed using Microsoft Excel and Prism 6 (Graphpad) software. All experiments shown were repeated at least three times, and representative data are shown. For all measurements, three biological replicates and two or more technical replicates were used. To determine the significance between two groups, comparisons were made using paired two-tailed Student’s t-test or repeated measurement ANOVA test as indicated. Randomization and experimenter blinding were not necessary, given the lack of ambiguity in the phenotypes observed, and/or the internal controls used for the engraftment experiments.
DATA AND SOFTWARE AVAILABILITY
Raw and analyzed data reported in this paper is available via NCBI GEO under accession number GSE89928. https://www.ncbi.nlm.nih.gov/geo/query/acc.cgi?acc=GSE89928.
Supplementary Material
Figure S1. Attributes of ATACseq Peaks in Tumor and Wound SCs Confirm Their Quality and Usefulness to Identify Gene Regulatory Regions. Related to Figure 1.
(A) Averaging of the genomic-wide distribution of ATAC signals for the transcription start site (TSS=0) or CCCTC-binding factor (CTCF) across SCC-, Epd- and HF-SC chromatin. Genome-wide data are plotted in kb relative to average tag count (average number of sequencing reads at each position). Note that the expected peaks and coverage are similar to that known for these chromatin features and which have been mapped previously by ChIPseq (ENCODE) (Buenestro et al., 2013).
(B) Distribution of ATAC peaks (total numbers listed) over annotated genomic regions is shown as pie charts for SCC-, Epd- and HF-SC chromatin. Note consistency with enriched signals over intergenic regulatory regions.
(C) Location of an ATAC peak that occurs within an epicenter (EC) of the Cxcl14 gene super-enhancer. Previously, we showed that the Cxcl14 gene is active in HFSCs, and its ECs are bound by the entire suite of HFSC-specific TFs. Note also that the bound TFs within the EC are flanked by the active histone mark, H3K27Ac, as well as MED1, a member of the mediator complex that brings together the super-enhancer and promoter of active genes (Adam et al., 2015; see also Whyte et al., 2013). Here, we plot the current ATAC dataset for chromatin isolated from EpdSCs, SCC-SCs and HFSCs against these ChIP-seq data to illustrate that ATAC-seq can be used to identify bona fide gene regulatory regions, in this case, for a gene which is active in HFSCs but silent in SCC-SCs and EpdSCs.
Figure S2. Expression KLF5 and SOX9 in Embryonic and Hyperplastic Stage, and Lineage Infidelity Occurrence in SCC Stem Cells. Related to Figure 2.
(A) Immunofluorescence reveals that KLF5, initially in multipotent embryonic skin progenitors and sustained in the EpdSCs, declines concomitantly with a gain of SOX9 as embryonic hair follicles (hair germs) develop (left). Note the demarcation of these two TFs into Epd (KLF5) and HF (SOX9) as HF morphogenesis proceeds (right). Dashed line denotes epidermal-dermal border.
(B) Immunofluorescence reveals that lineage-specific TFs KLF5 (Epd) and SOX9 (HF) are co-expressed during early during hyperplasia caused by oncogenic HRasG12V expression. Same image is shown in the three frames, with KLF5 and SOX9 channels separate or merged with INTEGRIN. Dashed line denotes epidermal-dermal border.
(C) Venn diagram shows overlap of HFSC signature (defined by mRNA expression log2FC>2 compared to EpdSC) and EpdSC signature (defined by mRNA expression log2FC>2 compared to HFSC) with SCC-SC signature genes (defined by mRNA expression log2FC>2 compared to either normal SCs). Note that nearly 500 HFSC and >700 EpdSC genes are highly expressed in SCC-SCs, indicative of lineage infidelity.
(D) Immunofluorescence shows that in normal homeostasis (control), TCF3 is a HFSC-specific transcription factor while AP2γ is an Epd-specific transcription factor. However, in SCCs, these two lineage-specific TFs are co-expressed. Asterisk denotes autofluorescence, a frequent problem of stratum corneum and hair shaft. Dashed line denotes epidermal-dermal border.
(E) ATAC tracks of representative genes that display lineage specificity in the homeostatic chromatin state, but lineage infidelity in SCC-SC chromatin state.
All immunofluorescence images are representative and from at least 5 biologically independent replicates. Dashed line denotes epidermal-dermal border. All scale bars = 50μm.
Figure S3. Efficient Knockdown of Klf5 in SCC. Related to Figure 3.
(A) Tumor images from transplantations of SCC-SCs transduced with sgScr(left) and sgKlf5(top right) or sgSox9 (bottom right) LV vectors prior to intradermal injections into Nude mouse backs. Representative images from these experiments were taken after 3wk of tumor growth. Five biologically independent experiments were performed.
(B–C) HRASG12V-transformed SCC cells were transduced with a GFP lentivirus (to mark the tumor cells as opposed to stroma) and also a Klf5 or Scramble control shRNA hairpin and puromycin selection marker, administered for 2d to obtain stable integration. Tumors were then generated by intradermal injections of transduced SCC cells into host recipient Nude mice.
(B) Western blot analysis of KLF5 and GAPDH. KLF5 has been reported to undergo ubiquitination and other forms of posttranslational modification. Importantly, all 3 KLF5 bands were lost following knockdown.
(C) Immunofluorescence for KLF5 and INTEGRIN β4 (GFP epifluorescence in insets). Scale bar = 50 μm. Two different Klf5 shRNA hairpins were tested and gave consistent results. Three biologically independent experiments were performed.
Figure S4. Efficient CRISPR/CAS-mediated Sox9 and Klf5 Gene Ablation In Vivo. Related to Figure 4.
(A) Immunofluorescence reveals activation of EpdSC AP2γ in TCF3+ HFs and HFSC TCF3 in AP2γ+ Epd following a partial-thickness and full-thickness wound (see Star Methods).
(B–C) In vivo testing results of efficient Klf5 or Sox9 Crispr guides. Amniotic sacs of living Rosa26-Loxp-STOP-Loxp-Cas9-P2A-GFP E9.5 embryos were injected in utero with lentivirus (LV) harboring PGK-Cre and a U6-sgRNA against Klf5 or Sox9 or Scramble control. Embryos were removed for immunofluorescence analysis of either sagittal skin sections (B, E18.5, Klf5 ablated; Scr) or whole mount (C, E16.5, Sox9 ablated; Scr). Note that KLF5 and GFP are mutually exclusive in the epidermis, reflective of efficient Klf5 knockout in LV-transduced cells. Note that for SOX9, green GFP (boxed insets in lower left corners of mainframes) shows high transductions across all conditions, as that HF formation is abrogated in Sox9 sg-transduced regions and not in Scr sg-transduced regions. This is consistent with the essential role of SOX9 in HFSCs (Nowak et al., 2008). P-cadherin (PCAD) and LHX2 served as controls to mark HFs and were not affected by Sox9 ablation. For whole mounts, areas boxed are color-coded and magnified at right. Scale bar = 50μm for sagittal sections, 200μm for whole mount images. At least two distinct sgRNAs were tested for each gene and both gave consistent results.
All immunofluorescence images are representative and from at least 5 biologically independent replicates. Dashed lines in (B) denotes epidermal-dermal borders.
Figure S5. Wound and Tumor Transcriptomes and Chromatin Accessibility Profiles Share Similarities That Are Distinct from Proliferative Committed Progenies. Related to Figure 5.
(A) Venn diagrams reveal how transcripts up or downregulated by ≥4X (p<0.05) in SCC-SCs relative to their WT counterparts (numbers of transcripts indicated) compare to those up or downregulated in Wd-SCs relative to unwounded SCs. Note that 98.5% of all changes—up or down– are concordant (Fisher’s exact test, p value = 0) while only 1.5% are discordant.
(B) Gene set enrichment analyses (GSEA) reveal that the transcripts up or downregulated by ≥4X (p<0.05) in proliferative, committed, ‘transit-amplifying cells’ (TACs) of HFs are distinct from those of stressed conditions of either wound or tumor. The poor overlap with TAC data indicates that the striking similarities seen in stress (Wd-SCs and SCC-SCs) versus homeoastatic (Epd-SCs and HFSCs) states go beyond mere proliferative differences.
(C) Strong ATAC signals are centered throughout the transcription start sites (TSS, left) and CCCTC (CTCF) motif sites (right) of the wounded (Wd) SC chromatin. Plots of the genome-wide data illustrate the expected peaks (numbers on X axis in kb; Y axis, average number of sequencing reads at each position).
(D) The distribution of ATAC peaks over annotated genomic regions of Wd-SC chromatin is shown as a pie chart, and highlights the enrichment of ATAC signals over intergenic regulatory regions.
Figure S6. Stress-Induced Enhancers Drive Stem Cell Lineage Infidelity in Skin Malignancy. Related to Figure 6.
(A) ATAC peaks at the Ly6a and Hes1 loci illustrate that these two EpdSC expressed genes lose some peaks (red boxes) and acquire others (blue boxes) in wound and tumor states.
(B) ATAC peaks at the Sox9 locus illustrate the presence of de novo stress-associated enhancer epicenters (ECs) (blue boxes) and loss of some homeostatic ECs (red boxes). Note that the stress-associated ECs are enriched for binding motifs for ETS, AP1 and often STAT factors, all of which are exclusively induced in stress states.
(C) Immunofluorescence reveals the presence of AP1 factors JUN and FOS as well as pSTAT3 in tumors and wounded skin. Note that in homeostatic skin, FOS is absent and JUN and pSTAT3 are weak.
(D) Immunofluorescence reveals LRIG1+ SCs in the upper HF are largely SOX9-negative during normal homeostasis, but they become SOX9+ after wounding. The co-expression of LRIG1 and SOX9 is also seen in benign papillomas, but in SCCs, LRIG1 was not detected.
(E) Forced activation of ETS2 in skin epithelium was achieved by transducing E9.5 K14rtTA embryos in utero with a lentivirus harboring TRE-ETS2 (T72D). Doxycycline was administered starting at P0 and mice were analyzed at 4 weeks (Yang et al., 2015). Sagittal sections of backskins were analyzed for JUN, FOS and pSTAT3 expression.
All immunofluorescence images are representative and from at least 3 biologically independent replicates. All scale bars = 50μm.
Figure S7. Sustained KLF5 Promotes HF to Epidermal Fate, While Sustained SOX9 Pushes Wounds into a Neoplastic State. Related to Figure 7.
(A) Forced activation of KLF5 in skin epithelium was achieved by transducing K14rtTA embryos with lentiviral TRE-Klf5 (PGK-H2BRFP to identify transduced cells), followed by doxycycline induction (through the mother’s milk) for 2 wks starting at P0. Backskins were analyzed for K10 and LORICRIN (Epd markers), and TENASCIN C (HF marker). Insets are magnified at right. Note that when KLF5 is overexpressed (H2BRFP+), Epd markers are ectopically induced in the HF, while HF markers are correspondingly diminished.
(B) Epicenters specific to wound and the tumor chromatin (see Figure 7) were each used separately to drive eGFP, delivered by in utero LV transduction (PGK-rtTA-p2A-H2BRFP control) into E9.5 embryos transgenic for TRE-HRASG12V. In adult mice, doxycycline was administered and non-invasive regions of developing tumors were examined for transduction and EC-driven reporter activity. Note that eGFP, which was silent in homeostatic skin for both wound and tumor ECs and activated only for the wound-EC in injury states (see Figure 7), was activated in these benign tumor regions, consistent with the stress-inducible nature of these epicenters.
(C–D) Forced activation of SOX9 in the skin epithelium was achieved by transducing E9.5 TRE-Sox9 embryos in utero with lentivirus harboring PGK-rtTA-H2BGFP. Doxycycline was administered starting at E18.5 and at P3, split-thickness grafts were performed on host Nude mice (see Method Details). Dermal skin grafts were processed 2 weeks later, and either a) sectioned sagittally and stained for K5, K10, LORICRIN (C), or b) EdU pulsed for 2hr and subjected to FACS analysis for % of EdU+ cells out of total basal cells (D). n = 8 for F. Results are shown as mean +/− std. Paired t-test was performed. ***P <0.001. All immunofluorescence images are representative and from at least 5 biologically independent replicates. All scale bars = 50μm.
(E) Model for How Lineage Specificity in Homeostasis is Transiently Lost in Wounds and Permanently Lose in Tumorigenesis. Under normal homeostasis, skin EpdSCs and HFSCs govern their own fates by activating lineage-specific homeostatic epicenters (ECs) for Klf5 and Sox9, respectively. In wound-repair, wound-epicenters are activated when RAS/MAPK (ERK1/2) phosphorylates and activates pETS2 and other stress-induced TFs. These wound-ECs drive expression of both Klf5 and Sox9 genes irrespective of SC origin, leading to lineage infidelity. Lineage infidelity is then resolved when RAS/MAPK levels and pETS2 activity wane as the skin barrier is restored. By contrast, RAS/MAPK and pETS2 activity rise during malignant progression, driving heightened wound-EC activity and Klf5 and Sox9 gene expression. As SOX9 and KLF5 levels rise, new enhancer elements (tumor-ECs) are acquired, whose activity are regulated by composite lineage- and stress-response TFs. The outcome is now a complete independence of Klf5 and Sox9 on their homeostatic enhancers, and sustained lineage infidelity that typifies the malignant state.
Table S1. Small guide sequences used for CRISPR. Related to Figure 3.
Table S2. qPCR primers. Related to Figure 3.
Acknowledgments
We thank S. Chai for technical assistance; J. Levorse and M. Sribour for assisting with mice experiments; Z. Shen, S. Luo, M. Laurin, S. Ellis, Y. Miao, S. Naik, S. Larsen, K. Lay and S. Liu for discussions; J. Vidigal, A Ventura (Memorial Sloan Kettering Cancer Institute), C. Vokac and K. Chang (Cold Spring Harbor Laboratories) for advice in designing CRISPR guides; Comparative Bioscience Center (AAALAC accredited) for care of mice in accordance with NIH guidelines; Rockefeller (C. Zhao, Director) and Weill Cornell Genomics Resource Center (J. Xiang, Director) for sequencing; Flow Cytometry facility (S. Mazel, Director) for cell sorting. E.F. is an Investigator of the Howard Hughes Medical Institute. Y.G. is the recipient of a Robertson Therapeutic Development Fund, and a Department of Defense Breast Cancer Postdoctoral Fellowship. The work was supported by grants from the National Institutes of Health (R37-AR27883 and R01-AR31737).
Footnotes
Publisher's Disclaimer: This is a PDF file of an unedited manuscript that has been accepted for publication. As a service to our customers we are providing this early version of the manuscript. The manuscript will undergo copyediting, typesetting, and review of the resulting proof before it is published in its final citable form. Please note that during the production process errors may be discovered which could affect the content, and all legal disclaimers that apply to the journal pertain.
Author Contributions
Y.G. and E.F. designed the experiments and wrote the manuscript. N.G. performed ATAC peak calling, quality control, z-score clustering and cumulative distribution. R.A. and Y.G tested epicenters. M.N. assisted in all CRISPR experiments. H.Y. performed knockdown of KLF5. A.V. and O.E. performed RNAseq analysis. C.L. generated RNAseq data for wounds. L.P. performed skin grafts. S.Y. generated mice with lung metastases. Y.G. performed all other experiments. All authors provided intellectual input, vetted and approved the final manuscript.
References
- Adam RC, Yang H, Rockowitz S, Larsen SB, Nikolova M, Oristian DS, Polak L, Kadaja M, Asare A, Zheng D, et al. Pioneer factors govern super-enhancer dynamics in stem cell plasticity and lineage choice. Nature. 2015;521:366–370. doi: 10.1038/nature14289. [DOI] [PMC free article] [PubMed] [Google Scholar]
- Akiyama H, Kim JE, Nakashima K, Balmes G, Iwai N, Deng JM, Zhang Z, Martin JF, Behringer RR, Nakamura T, et al. Osteo-chondroprogenitor cells are derived from Sox9 expressing precursors. Proc Natl Acad Sci U S A. 2005;102:14665–14670. doi: 10.1073/pnas.0504750102. [DOI] [PMC free article] [PubMed] [Google Scholar]
- Antsiferova M, Werner S. The bright and the dark sides of activin in wound healing and cancer. J Cell Sci. 2012;125:3929–3937. doi: 10.1242/jcs.094789. [DOI] [PubMed] [Google Scholar]
- Arwert EN, Hoste E, Watt FM. Epithelial stem cells, wound healing and cancer. Nat Rev Cancer. 2012;12:170–180. doi: 10.1038/nrc3217. [DOI] [PubMed] [Google Scholar]
- Balmain A, Yuspa SH. Milestones in skin carcinogenesis: the biology of multistage carcinogenesis. J Invest Dermatol. 2014;134:E2–7. doi: 10.1038/skinbio.2014.2. [DOI] [PubMed] [Google Scholar]
- Bell SM, Zhang L, Xu Y, Besnard V, Wert SE, Shroyer N, Whitsett JA. Kruppel-like factor 5 controls villus formation and initiation of cytodifferentiation in the embryonic intestinal epithelium. Dev Biol. 2013;375:128–139. doi: 10.1016/j.ydbio.2012.12.010. [DOI] [PMC free article] [PubMed] [Google Scholar]
- Beronja S, Livshits G, Williams S, Fuchs E. Rapid functional dissection of genetic networks via tissue-specific transduction and RNAi in mouse embryos. Nat Med. 2010;16:821–827. doi: 10.1038/nm.2167. [DOI] [PMC free article] [PubMed] [Google Scholar]
- Blanpain C, Lowry WE, Geoghegan A, Polak L, Fuchs E. Self-renewal, multipotency, and the existence of two cell populations within an epithelial stem cell niche. Cell. 2004;118:635–648. doi: 10.1016/j.cell.2004.08.012. [DOI] [PubMed] [Google Scholar]
- Boumahdi S, Driessens G, Lapouge G, Rorive S, Nassar D, Le Mercier M, Delatte B, Caauwe A, Lenglez S, Nkusi E, et al. SOX2 controls tumour initiation and cancer stem-cell functions in squamous-cell carcinoma. Nature. 2014;511:246–250. doi: 10.1038/nature13305. [DOI] [PubMed] [Google Scholar]
- Buenrostro JD, Giresi PG, Zaba LC, Chang HY, Greenleaf WJ. Transposition of native chromatin for fast and sensitive epigenomic profiling of open chromatin, DNA-binding proteins and nucleosome position. Nat Methods. 2013;10:1213–1218. doi: 10.1038/nmeth.2688. [DOI] [PMC free article] [PubMed] [Google Scholar]
- Chang HY, Sneddon JB, Alizadeh AA, Sood R, West RB, Montgomery K, Chi JT, van de Rijn M, Botstein D, Brown PO. Gene expression signature of fibroblast serum response predicts human cancer progression: similarities between tumors and wounds. PLoS Biol. 2004;2:E7. doi: 10.1371/journal.pbio.0020007. [DOI] [PMC free article] [PubMed] [Google Scholar]
- Doench JG, Fusi N, Sullender M, Hegde M, Vaimberg EW, Donovan KF, Smith I, Tothova Z, Wilen C, Orchard R, et al. Optimized sgRNA design to maximize activity and minimize off-target effects of CRISPR-Cas9. Nat Biotechnol. 2016;34:184–191. doi: 10.1038/nbt.3437. [DOI] [PMC free article] [PubMed] [Google Scholar]
- Dunham LJ. Cancer in man at site of prior benign lesion of skin or mucous membrane: a review. Cancer Res. 1972;32:1359–1374. [PubMed] [Google Scholar]
- Dvorak HF. Tumors: wounds that do not heal. Similarities between tumor stroma generation and wound healing. N Engl J Med. 1986;315:1650–1659. doi: 10.1056/NEJM198612253152606. [DOI] [PubMed] [Google Scholar]
- Eisen MB, Spellman PT, Brown PO, Botstein D. Cluster analysis and display of genome-wide expression patterns. Proc Natl Acad Sci U S A. 1998;95:14863–14868. doi: 10.1073/pnas.95.25.14863. [DOI] [PMC free article] [PubMed] [Google Scholar]
- Foulds CE, Nelson ML, Blaszczak AG, Graves BJ. Ras/mitogen-activated protein kinase signaling activates Ets-1 and Ets-2 by CBP/p300 recruitment. Mol Cell Biol. 2004;24:10954–10964. doi: 10.1128/MCB.24.24.10954-10964.2004. [DOI] [PMC free article] [PubMed] [Google Scholar]
- Fuchs E. Epithelial Skin Biology: Three Decades of Developmental Biology, a Hundred Questions Answered and a Thousand New Ones to Address. Curr Top Dev Biol. 2016;116:357–374. doi: 10.1016/bs.ctdb.2015.11.033. [DOI] [PMC free article] [PubMed] [Google Scholar]
- Ge Y, Zhang L, Nikolova M, Reva B, Fuchs E. Strand-specific in vivo screen of cancer-associated miRNAs unveils a role for miR-21(*) in SCC progression. Nat Cell Biol. 2016;18:111–121. doi: 10.1038/ncb3275. [DOI] [PMC free article] [PubMed] [Google Scholar]
- Guasch G, Schober M, Pasolli HA, Conn EB, Polak L, Fuchs E. Loss of TGFbeta signaling destabilizes homeostasis and promotes squamous cell carcinomas in stratified epithelia. Cancer Cell. 2007;12:313–327. doi: 10.1016/j.ccr.2007.08.020. [DOI] [PMC free article] [PubMed] [Google Scholar]
- Haddow A. Molecular repair, wound healing, and carcinogenesis: tumor production a possible overhealing? Adv Cancer Res. 1972;16:181–234. doi: 10.1016/s0065-230x(08)60341-3. [DOI] [PubMed] [Google Scholar]
- Hance MW, Nolan KD, Isaacs JS. The double-edged sword: conserved functions of extracellular hsp90 in wound healing and cancer. Cancers (Basel) 2014;6:1065–1097. doi: 10.3390/cancers6021065. [DOI] [PMC free article] [PubMed] [Google Scholar]
- Heinz S, Benner C, Spann N, Bertolino E, Lin YC, Laslo P, Cheng JX, Murre C, Singh H, Glass CK. Simple combinations of lineage-determining transcription factors prime cis-regulatory elements required for macrophage and B cell identities. Mol Cell. 2010;38:576–589. doi: 10.1016/j.molcel.2010.05.004. [DOI] [PMC free article] [PubMed] [Google Scholar]
- Ito M, Liu Y, Yang Z, Nguyen J, Liang F, Morris RJ, Cotsarelis G. Stem cells in the hair follicle bulge contribute to wound repair but not to homeostasis of the epidermis. Nat Med. 2005;11:1351–1354. doi: 10.1038/nm1328. [DOI] [PubMed] [Google Scholar]
- Iyer VR, Eisen MB, Ross DT, Schuler G, Moore T, Lee JC, Trent JM, Staudt LM, Hudson J, Jr, Boguski MS, et al. The transcriptional program in the response of human fibroblasts to serum. Science. 1999;283:83–87. doi: 10.1126/science.283.5398.83. [DOI] [PubMed] [Google Scholar]
- Jensen KB, Collins CA, Nascimento E, Tan DW, Frye M, Itami S, Watt FM. Lrig1 expression defines a distinct multipotent stem cell population in mammalian epidermis. Cell Stem Cell. 2009;4:427–439. doi: 10.1016/j.stem.2009.04.014. [DOI] [PMC free article] [PubMed] [Google Scholar]
- Kadaja M, Keyes BE, Lin M, Pasolli HA, Genander M, Polak L, Stokes N, Zheng D, Fuchs E. SOX9: a stem cell transcriptional regulator of secreted niche signaling factors. Genes Dev. 2014;28:328–341. doi: 10.1101/gad.233247.113. [DOI] [PMC free article] [PubMed] [Google Scholar]
- Langmead B, Trapnell C, Pop M, Salzberg SL. Ultrafast and memory-efficient alignment of short DNA sequences to the human genome. Genome Biol. 2009;10:R25. doi: 10.1186/gb-2009-10-3-r25. [DOI] [PMC free article] [PubMed] [Google Scholar]
- Lapouge G, Youssef KK, Vokaer B, Achouri Y, Michaux C, Sotiropoulou PA, Blanpain C. Identifying the cellular origin of squamous skin tumors. Proc Natl Acad Sci U S A. 2011;108:7431–7436. doi: 10.1073/pnas.1012720108. [DOI] [PMC free article] [PubMed] [Google Scholar]
- Larsimont JC, Youssef KK, Sanchez-Danes A, Sukumaran V, Defrance M, Delatte B, Liagre M, Baatsen P, Marine JC, Lippens S, et al. Sox9 Controls Self-Renewal of Oncogene Targeted Cells and Links Tumor Initiation and Invasion. Cell Stem Cell. 2015;16:00217–00219. doi: 10.1016/j.stem.2015.05.008. [DOI] [PubMed] [Google Scholar]
- Latil M, Nassar D, Beck B, Boumahdi S, Wang L, Brisebarre A, Dubois C, Nkusi E, Lenglez S, Checinska A, et al. Cell-Type-Specific Chromatin States Differentially Prime Squamous Cell Carcinoma Tumor-Initiating Cells for Epithelial to Mesenchymal Transition. Cell Stem Cell. 2016;20:191–204. doi: 10.1016/j.stem.2016.10.018. [DOI] [PMC free article] [PubMed] [Google Scholar]
- Levy V, Lindon C, Zheng Y, Harfe BD, Morgan BA. Epidermal stem cells arise from the hair follicle after wounding. Faseb J. 2007;21:1358–1366. doi: 10.1096/fj.06-6926com. [DOI] [PubMed] [Google Scholar]
- McConnell BB, Kim SS, Yu K, Ghaleb AM, Takeda N, Manabe I, Nusrat A, Nagai R, Yang VW. Kruppel-like factor 5 is important for maintenance of crypt architecture and barrier function in mouse intestine. Gastroenterology. 2011;141:1302–1313. doi: 10.1053/j.gastro.2011.06.086. [DOI] [PMC free article] [PubMed] [Google Scholar]
- McLean CY, Bristor D, Hiller M, Clarke SL, Schaar BT, Lowe CB, Wenger AM, Bejerano G. GREAT improves functional interpretation of cis-regulatory regions. Nat Biotechnol. 2010;28:495–501. doi: 10.1038/nbt.1630. [DOI] [PMC free article] [PubMed] [Google Scholar]
- Mootha VK, Lindgren CM, Eriksson KF, Subramanian A, Sihag S, Lehar J, Puigserver P, Carlsson E, Ridderstrale M, Laurila E, et al. PGC-1alpha-responsive genes involved in oxidative phosphorylation are coordinately downregulated in human diabetes. Nat Genet. 2003;34:267–273. doi: 10.1038/ng1180. [DOI] [PubMed] [Google Scholar]
- Morris RJ, Liu Y, Marles L, Yang Z, Trempus C, Li S, Lin JS, Sawicki JA, Cotsarelis G. Capturing and profiling adult hair follicle stem cells. Nat Biotechnol. 2004;22:411–417. doi: 10.1038/nbt950. [DOI] [PubMed] [Google Scholar]
- Nandan MO, Ghaleb AM, Liu Y, Bialkowska AB, McConnell BB, Shroyer KR, Robine S, Yang VW. Inducible intestine-specific deletion of Kruppel-like factor 5 is characterized by a regenerative response in adult mouse colon. Dev Biol. 2014;387:191–202. doi: 10.1016/j.ydbio.2014.01.002. [DOI] [PMC free article] [PubMed] [Google Scholar]
- Nguyen H, Rendl M, Fuchs E. Tcf3 governs stem cell features and represses cell fate determination in skin. Cell. 2006;127:171–183. doi: 10.1016/j.cell.2006.07.036. [DOI] [PubMed] [Google Scholar]
- Nowak JA, Polak L, Pasolli HA, Fuchs E. Hair follicle stem cells are specified and function in early skin morphogenesis. Cell Stem Cell. 2008;3:333. doi: 10.1016/j.stem.2008.05.009. [DOI] [PMC free article] [PubMed] [Google Scholar]
- Page ME, Lombard P, Ng F, Gottgens B, Jensen KB. The epidermis comprises autonomous compartments maintained by distinct stem cell populations. Cell Stem Cell. 2013;13:471–482. doi: 10.1016/j.stem.2013.07.010. [DOI] [PMC free article] [PubMed] [Google Scholar]
- Pedersen TX, Leethanakul C, Patel V, Mitola D, Lund LR, Dano K, Johnsen M, Gutkind JS, Bugge TH. Laser capture microdissection-based in vivo genomic profiling of wound keratinocytes identifies similarities and differences to squamous cell carcinoma. Oncogene. 2003;22:3964–3976. doi: 10.1038/sj.onc.1206614. [DOI] [PubMed] [Google Scholar]
- Platt RJ, Chen S, Zhou Y, Yim MJ, Swiech L, Kempton HR, Dahlman JE, Parnas O, Eisenhaure TM, Jovanovic M, et al. CRISPR-Cas9 Knockin Mice for Genome Editing and Cancer Modeling. Cell. 2014;159:440–455. doi: 10.1016/j.cell.2014.09.014. [DOI] [PMC free article] [PubMed] [Google Scholar]
- Quinlan AR, Hall IM. BEDTools: a flexible suite of utilities for comparing genomic features. Bioinformatics. 2010;26:841–842. doi: 10.1093/bioinformatics/btq033. [DOI] [PMC free article] [PubMed] [Google Scholar]
- Quintanilla M, Brown K, Ramsden M, Balmain A. Carcinogen-specific mutation and amplification of Ha-ras during mouse skin carcinogenesis. Nature. 1986;322:780. doi: 10.1038/322078a0. [DOI] [PubMed] [Google Scholar]
- Rashid NU, Giresi PG, Ibrahim JG, Sun W, Lieb JD. ZINBA integrates local covariates with DNA-seq data to identify broad and narrow regions of enrichment, even within amplified genomic regions. Genome Biol. 2011;12:R67. doi: 10.1186/gb-2011-12-7-r67. [DOI] [PMC free article] [PubMed] [Google Scholar]
- Rhee H, Polak L, Fuchs E. Lhx2 maintains stem cell character in hair follicles. Science. 2006;312:1946–1949. doi: 10.1126/science.1128004. [DOI] [PMC free article] [PubMed] [Google Scholar]
- Riss J, Khanna C, Koo S, Chandramouli GV, Yang HH, Hu Y, Kleiner DE, Rosenwald A, Schaefer CF, Ben-Sasson SA, et al. Cancers as wounds that do not heal: differences and similarities between renal regeneration/repair and renal cell carcinoma. Cancer Res. 2006;66:7216–7224. doi: 10.1158/0008-5472.CAN-06-0040. [DOI] [PubMed] [Google Scholar]
- Rodriguez-Puebla ML, LaCava M, Bolontrade MF, Russell J, Conti CJ. Increased expression of mutated Ha-ras during premalignant progression in SENCAR mouse skin. Mol Carcinog. 1999;26:150–156. [PubMed] [Google Scholar]
- Rosenbloom KR, Armstrong J, Barber GP, Casper J, Clawson H, Diekhans M, Dreszer TR, Fujita PA, Guruvadoo L, Haeussler M, et al. The UCSC Genome Browser database: 2015 update. Nucleic Acids Res. 2015;43:D67081. [Google Scholar]
- Saldanha AJ. Java Treeview–extensible visualization of microarray data. Bioinformatics. 2004;20:3246–3248. doi: 10.1093/bioinformatics/bth349. [DOI] [PubMed] [Google Scholar]
- Sanjana NE, Shalem O, Zhang F. Improved vectors and genome-wide libraries for CRISPR screening. Nat Methods. 2014;11:783–784. doi: 10.1038/nmeth.3047. [DOI] [PMC free article] [PubMed] [Google Scholar]
- Schober M, Fuchs E. Tumor-initiating stem cells of squamous cell carcinomas and their control by TGF-beta and integrin/focal adhesion kinase (FAK) signaling. Proc Natl Acad Sci U S A. 2011;108:10544–10549. doi: 10.1073/pnas.1107807108. [DOI] [PMC free article] [PubMed] [Google Scholar]
- Schuh AC, Keating SJ, Monteclaro FS, Vogt PK, Breitman ML. Obligatory wounding requirement for tumorigenesis in v-jun transgenic mice. Nature. 1990;346:756–760. doi: 10.1038/346756a0. [DOI] [PubMed] [Google Scholar]
- Siegle JM, Basin A, Sastre-Perona A, Yonekubo Y, Brown J, Sennett R, Rendl M, Tsirigos A, Carucci JA, Schober M. SOX2 is a cancer-specific regulator of tumour initiating potential in cutaneous squamous cell carcinoma. Nat Commun. 2014;5:4511. doi: 10.1038/ncomms5511. [DOI] [PMC free article] [PubMed] [Google Scholar]
- Subramanian A, Tamayo P, Mootha VK, Mukherjee S, Ebert BL, Gillette MA, Paulovich A, Pomeroy SL, Golub TR, Lander ES, et al. Gene set enrichment analysis: a knowledge-based approach for interpreting genome-wide expression profiles. Proc Natl Acad Sci U S A. 2005;102:15545–15550. doi: 10.1073/pnas.0506580102. [DOI] [PMC free article] [PubMed] [Google Scholar]
- Sur I, Rozell B, Jaks V, Bergstrom A, Toftgard R. Epidermal and craniofacial defects in mice overexpressing Klf5 in the basal layer of the epidermis. J Cell Sci. 2006;119:3593–3601. doi: 10.1242/jcs.03070. [DOI] [PubMed] [Google Scholar]
- Tumbar T, Guasch G, Greco V, Blanpain C, Lowry WE, Rendl M, Fuchs E. Defining the epithelial stem cell niche in skin. Science. 2004;303:359–363. doi: 10.1126/science.1092436. [DOI] [PMC free article] [PubMed] [Google Scholar]
- Vassar R, Fuchs E. Transgenic mice provide new insights into the role of TGF-alpha during epidermal development and differentiation. Genes Dev. 1991;5:714–727. doi: 10.1101/gad.5.5.714. [DOI] [PubMed] [Google Scholar]
- Vidal VP, Chaboissier MC, Lutzkendorf S, Cotsarelis G, Mill P, Hui CC, Ortonne N, Ortonne JP, Schedl A. Sox9 is essential for outer root sheath differentiation and the formation of the hair stem cell compartment. Curr Biol. 2005;15:1340–1351. doi: 10.1016/j.cub.2005.06.064. [DOI] [PubMed] [Google Scholar]
- White AC, Tran K, Khuu J, Dang C, Cui Y, Binder SW, Lowry WE. Defining the origins of Ras/p53-mediated squamous cell carcinoma. Proc Natl Acad Sci U S A. 2011;108:7425–7430. doi: 10.1073/pnas.1012670108. [DOI] [PMC free article] [PubMed] [Google Scholar]
- Whyte WA, Orlando DA, Hnisz D, Abraham BJ, Lin CY, Kagey MH, Rahl PB, Lee TI, Young RA. Master transcription factors and mediator establish super-enhancers at key cell identity genes. Cell. 2013;153:307–319. doi: 10.1016/j.cell.2013.03.035. [DOI] [PMC free article] [PubMed] [Google Scholar]
- Yang BS, Hauser CA, Henkel G, Colman MS, Van Beveren C, Stacey KJ, Hume DA, Maki RA, Ostrowski MC. Ras-mediated phosphorylation of a conserved threonine residue enhances the transactivation activities of c-Ets1 and c-Ets2. Mol Cell Biol. 1996;16:538–547. doi: 10.1128/mcb.16.2.538. [DOI] [PMC free article] [PubMed] [Google Scholar]
- Yang H, Schramek D, Adam RC, Keyes BE, Wang P, Zheng D, Fuchs E. ETS family transcriptional regulators drive chromatin dynamics and malignancy in squamous cell carcinomas. Elife. 2015;4:e10870. doi: 10.7554/eLife.10870. [DOI] [PMC free article] [PubMed] [Google Scholar]
- Zhang Y, Liu T, Meyer CA, Eeckhoute J, Johnson DS, Bernstein BE, Nusbaum C, Myers RM, Brown M, Li W, et al. Model-based analysis of ChIP-Seq (MACS) Genome Biol. 2008;9:R137. doi: 10.1186/gb-2008-9-9-r137. [DOI] [PMC free article] [PubMed] [Google Scholar]
Associated Data
This section collects any data citations, data availability statements, or supplementary materials included in this article.
Supplementary Materials
Figure S1. Attributes of ATACseq Peaks in Tumor and Wound SCs Confirm Their Quality and Usefulness to Identify Gene Regulatory Regions. Related to Figure 1.
(A) Averaging of the genomic-wide distribution of ATAC signals for the transcription start site (TSS=0) or CCCTC-binding factor (CTCF) across SCC-, Epd- and HF-SC chromatin. Genome-wide data are plotted in kb relative to average tag count (average number of sequencing reads at each position). Note that the expected peaks and coverage are similar to that known for these chromatin features and which have been mapped previously by ChIPseq (ENCODE) (Buenestro et al., 2013).
(B) Distribution of ATAC peaks (total numbers listed) over annotated genomic regions is shown as pie charts for SCC-, Epd- and HF-SC chromatin. Note consistency with enriched signals over intergenic regulatory regions.
(C) Location of an ATAC peak that occurs within an epicenter (EC) of the Cxcl14 gene super-enhancer. Previously, we showed that the Cxcl14 gene is active in HFSCs, and its ECs are bound by the entire suite of HFSC-specific TFs. Note also that the bound TFs within the EC are flanked by the active histone mark, H3K27Ac, as well as MED1, a member of the mediator complex that brings together the super-enhancer and promoter of active genes (Adam et al., 2015; see also Whyte et al., 2013). Here, we plot the current ATAC dataset for chromatin isolated from EpdSCs, SCC-SCs and HFSCs against these ChIP-seq data to illustrate that ATAC-seq can be used to identify bona fide gene regulatory regions, in this case, for a gene which is active in HFSCs but silent in SCC-SCs and EpdSCs.
Figure S2. Expression KLF5 and SOX9 in Embryonic and Hyperplastic Stage, and Lineage Infidelity Occurrence in SCC Stem Cells. Related to Figure 2.
(A) Immunofluorescence reveals that KLF5, initially in multipotent embryonic skin progenitors and sustained in the EpdSCs, declines concomitantly with a gain of SOX9 as embryonic hair follicles (hair germs) develop (left). Note the demarcation of these two TFs into Epd (KLF5) and HF (SOX9) as HF morphogenesis proceeds (right). Dashed line denotes epidermal-dermal border.
(B) Immunofluorescence reveals that lineage-specific TFs KLF5 (Epd) and SOX9 (HF) are co-expressed during early during hyperplasia caused by oncogenic HRasG12V expression. Same image is shown in the three frames, with KLF5 and SOX9 channels separate or merged with INTEGRIN. Dashed line denotes epidermal-dermal border.
(C) Venn diagram shows overlap of HFSC signature (defined by mRNA expression log2FC>2 compared to EpdSC) and EpdSC signature (defined by mRNA expression log2FC>2 compared to HFSC) with SCC-SC signature genes (defined by mRNA expression log2FC>2 compared to either normal SCs). Note that nearly 500 HFSC and >700 EpdSC genes are highly expressed in SCC-SCs, indicative of lineage infidelity.
(D) Immunofluorescence shows that in normal homeostasis (control), TCF3 is a HFSC-specific transcription factor while AP2γ is an Epd-specific transcription factor. However, in SCCs, these two lineage-specific TFs are co-expressed. Asterisk denotes autofluorescence, a frequent problem of stratum corneum and hair shaft. Dashed line denotes epidermal-dermal border.
(E) ATAC tracks of representative genes that display lineage specificity in the homeostatic chromatin state, but lineage infidelity in SCC-SC chromatin state.
All immunofluorescence images are representative and from at least 5 biologically independent replicates. Dashed line denotes epidermal-dermal border. All scale bars = 50μm.
Figure S3. Efficient Knockdown of Klf5 in SCC. Related to Figure 3.
(A) Tumor images from transplantations of SCC-SCs transduced with sgScr(left) and sgKlf5(top right) or sgSox9 (bottom right) LV vectors prior to intradermal injections into Nude mouse backs. Representative images from these experiments were taken after 3wk of tumor growth. Five biologically independent experiments were performed.
(B–C) HRASG12V-transformed SCC cells were transduced with a GFP lentivirus (to mark the tumor cells as opposed to stroma) and also a Klf5 or Scramble control shRNA hairpin and puromycin selection marker, administered for 2d to obtain stable integration. Tumors were then generated by intradermal injections of transduced SCC cells into host recipient Nude mice.
(B) Western blot analysis of KLF5 and GAPDH. KLF5 has been reported to undergo ubiquitination and other forms of posttranslational modification. Importantly, all 3 KLF5 bands were lost following knockdown.
(C) Immunofluorescence for KLF5 and INTEGRIN β4 (GFP epifluorescence in insets). Scale bar = 50 μm. Two different Klf5 shRNA hairpins were tested and gave consistent results. Three biologically independent experiments were performed.
Figure S4. Efficient CRISPR/CAS-mediated Sox9 and Klf5 Gene Ablation In Vivo. Related to Figure 4.
(A) Immunofluorescence reveals activation of EpdSC AP2γ in TCF3+ HFs and HFSC TCF3 in AP2γ+ Epd following a partial-thickness and full-thickness wound (see Star Methods).
(B–C) In vivo testing results of efficient Klf5 or Sox9 Crispr guides. Amniotic sacs of living Rosa26-Loxp-STOP-Loxp-Cas9-P2A-GFP E9.5 embryos were injected in utero with lentivirus (LV) harboring PGK-Cre and a U6-sgRNA against Klf5 or Sox9 or Scramble control. Embryos were removed for immunofluorescence analysis of either sagittal skin sections (B, E18.5, Klf5 ablated; Scr) or whole mount (C, E16.5, Sox9 ablated; Scr). Note that KLF5 and GFP are mutually exclusive in the epidermis, reflective of efficient Klf5 knockout in LV-transduced cells. Note that for SOX9, green GFP (boxed insets in lower left corners of mainframes) shows high transductions across all conditions, as that HF formation is abrogated in Sox9 sg-transduced regions and not in Scr sg-transduced regions. This is consistent with the essential role of SOX9 in HFSCs (Nowak et al., 2008). P-cadherin (PCAD) and LHX2 served as controls to mark HFs and were not affected by Sox9 ablation. For whole mounts, areas boxed are color-coded and magnified at right. Scale bar = 50μm for sagittal sections, 200μm for whole mount images. At least two distinct sgRNAs were tested for each gene and both gave consistent results.
All immunofluorescence images are representative and from at least 5 biologically independent replicates. Dashed lines in (B) denotes epidermal-dermal borders.
Figure S5. Wound and Tumor Transcriptomes and Chromatin Accessibility Profiles Share Similarities That Are Distinct from Proliferative Committed Progenies. Related to Figure 5.
(A) Venn diagrams reveal how transcripts up or downregulated by ≥4X (p<0.05) in SCC-SCs relative to their WT counterparts (numbers of transcripts indicated) compare to those up or downregulated in Wd-SCs relative to unwounded SCs. Note that 98.5% of all changes—up or down– are concordant (Fisher’s exact test, p value = 0) while only 1.5% are discordant.
(B) Gene set enrichment analyses (GSEA) reveal that the transcripts up or downregulated by ≥4X (p<0.05) in proliferative, committed, ‘transit-amplifying cells’ (TACs) of HFs are distinct from those of stressed conditions of either wound or tumor. The poor overlap with TAC data indicates that the striking similarities seen in stress (Wd-SCs and SCC-SCs) versus homeoastatic (Epd-SCs and HFSCs) states go beyond mere proliferative differences.
(C) Strong ATAC signals are centered throughout the transcription start sites (TSS, left) and CCCTC (CTCF) motif sites (right) of the wounded (Wd) SC chromatin. Plots of the genome-wide data illustrate the expected peaks (numbers on X axis in kb; Y axis, average number of sequencing reads at each position).
(D) The distribution of ATAC peaks over annotated genomic regions of Wd-SC chromatin is shown as a pie chart, and highlights the enrichment of ATAC signals over intergenic regulatory regions.
Figure S6. Stress-Induced Enhancers Drive Stem Cell Lineage Infidelity in Skin Malignancy. Related to Figure 6.
(A) ATAC peaks at the Ly6a and Hes1 loci illustrate that these two EpdSC expressed genes lose some peaks (red boxes) and acquire others (blue boxes) in wound and tumor states.
(B) ATAC peaks at the Sox9 locus illustrate the presence of de novo stress-associated enhancer epicenters (ECs) (blue boxes) and loss of some homeostatic ECs (red boxes). Note that the stress-associated ECs are enriched for binding motifs for ETS, AP1 and often STAT factors, all of which are exclusively induced in stress states.
(C) Immunofluorescence reveals the presence of AP1 factors JUN and FOS as well as pSTAT3 in tumors and wounded skin. Note that in homeostatic skin, FOS is absent and JUN and pSTAT3 are weak.
(D) Immunofluorescence reveals LRIG1+ SCs in the upper HF are largely SOX9-negative during normal homeostasis, but they become SOX9+ after wounding. The co-expression of LRIG1 and SOX9 is also seen in benign papillomas, but in SCCs, LRIG1 was not detected.
(E) Forced activation of ETS2 in skin epithelium was achieved by transducing E9.5 K14rtTA embryos in utero with a lentivirus harboring TRE-ETS2 (T72D). Doxycycline was administered starting at P0 and mice were analyzed at 4 weeks (Yang et al., 2015). Sagittal sections of backskins were analyzed for JUN, FOS and pSTAT3 expression.
All immunofluorescence images are representative and from at least 3 biologically independent replicates. All scale bars = 50μm.
Figure S7. Sustained KLF5 Promotes HF to Epidermal Fate, While Sustained SOX9 Pushes Wounds into a Neoplastic State. Related to Figure 7.
(A) Forced activation of KLF5 in skin epithelium was achieved by transducing K14rtTA embryos with lentiviral TRE-Klf5 (PGK-H2BRFP to identify transduced cells), followed by doxycycline induction (through the mother’s milk) for 2 wks starting at P0. Backskins were analyzed for K10 and LORICRIN (Epd markers), and TENASCIN C (HF marker). Insets are magnified at right. Note that when KLF5 is overexpressed (H2BRFP+), Epd markers are ectopically induced in the HF, while HF markers are correspondingly diminished.
(B) Epicenters specific to wound and the tumor chromatin (see Figure 7) were each used separately to drive eGFP, delivered by in utero LV transduction (PGK-rtTA-p2A-H2BRFP control) into E9.5 embryos transgenic for TRE-HRASG12V. In adult mice, doxycycline was administered and non-invasive regions of developing tumors were examined for transduction and EC-driven reporter activity. Note that eGFP, which was silent in homeostatic skin for both wound and tumor ECs and activated only for the wound-EC in injury states (see Figure 7), was activated in these benign tumor regions, consistent with the stress-inducible nature of these epicenters.
(C–D) Forced activation of SOX9 in the skin epithelium was achieved by transducing E9.5 TRE-Sox9 embryos in utero with lentivirus harboring PGK-rtTA-H2BGFP. Doxycycline was administered starting at E18.5 and at P3, split-thickness grafts were performed on host Nude mice (see Method Details). Dermal skin grafts were processed 2 weeks later, and either a) sectioned sagittally and stained for K5, K10, LORICRIN (C), or b) EdU pulsed for 2hr and subjected to FACS analysis for % of EdU+ cells out of total basal cells (D). n = 8 for F. Results are shown as mean +/− std. Paired t-test was performed. ***P <0.001. All immunofluorescence images are representative and from at least 5 biologically independent replicates. All scale bars = 50μm.
(E) Model for How Lineage Specificity in Homeostasis is Transiently Lost in Wounds and Permanently Lose in Tumorigenesis. Under normal homeostasis, skin EpdSCs and HFSCs govern their own fates by activating lineage-specific homeostatic epicenters (ECs) for Klf5 and Sox9, respectively. In wound-repair, wound-epicenters are activated when RAS/MAPK (ERK1/2) phosphorylates and activates pETS2 and other stress-induced TFs. These wound-ECs drive expression of both Klf5 and Sox9 genes irrespective of SC origin, leading to lineage infidelity. Lineage infidelity is then resolved when RAS/MAPK levels and pETS2 activity wane as the skin barrier is restored. By contrast, RAS/MAPK and pETS2 activity rise during malignant progression, driving heightened wound-EC activity and Klf5 and Sox9 gene expression. As SOX9 and KLF5 levels rise, new enhancer elements (tumor-ECs) are acquired, whose activity are regulated by composite lineage- and stress-response TFs. The outcome is now a complete independence of Klf5 and Sox9 on their homeostatic enhancers, and sustained lineage infidelity that typifies the malignant state.
Table S1. Small guide sequences used for CRISPR. Related to Figure 3.
Table S2. qPCR primers. Related to Figure 3.