

Abstract
The micromolar equilibrium constants for heme dissociation from IsdG and IsdI reported in the literature call into question whether these enzymes are actually members of the iron-regulated surface determinant system of Staphylococcus aureus, which harvests heme iron from a host during infection. In order to address this question, the heme dissociation constants for IsdG and IsdI were reevaluated using three approaches. The heme dissociation equilibrium constants were measured using a UV/Vis absorption-detected assay analyzed with an assumption-free model, and using a newly developed fluorescence-detected assay. The heme dissociation rate constants were estimated using apomyoglobin competition assays. Analyses of the UV/Vis absorption data revealed a critical flaw in the previous measurements; heme is 99.9% protein-bound at the micromolar concentrations needed for UV/Vis absorption spectroscopy, which renders accurate equilibrium constant measurement nearly impossible. However, fluorescence can be measured for more dilute samples, and analyses of these data resulted in dissociation equilibrium constants of 1.4 ± 0.6 nM and 12.9 ± 1.3 nM for IsdG and IsdI, respectively. Analyses of the kinetic data obtained from apomyoglobin competition assays estimated heme dissociation rate constants of 0.022 ± 0.002 s-1 for IsdG and 0.092 ± 0.008 s-1 for IsdI. Based upon these data, and what is known regarding the post-translational regulation of IsdG and IsdI, it is proposed that only IsdG is a member of the heme iron acquisition pathway and IsdI regulates heme homeostasis. Furthermore, the nanomolar dissociation constants mean that heme is bound tightly by IsdG and indicates that competitive inhibition of this protein will be difficult. Instead, uncompetitive inhibition based upon a detailed understanding of enzyme mechanism is a more promising antibiotic development strategy.
Graphical Abstract
A new fluorescence-based assay reveals that the affinities of Staphylococcus aureus IsdG and IsdI for heme are 2-3 orders of magnitude greater than previously realized.

Introduction
Staphylococcus aureus is a gram-positive human pathogen that has been labelled a serious antibiotic-resistant threat by the Centers for Disease Control and Prevention. The major concern is the growing number of methicillin- and even vancomycin-resistant cases,1 which means that humans are in a race against S. aureus to develop a new antibiotic before all known drugs become ineffective. A promising target is the iron-regulated surface determinant (Isd) system of S. aureus,2 which is responsible for harvesting an essential nutrient, iron, from a mammalian host during infection.3 The Isd system consists of nine proteins that: bind host hemoglobin, extract the heme cofactor, import heme into the bacterial cytosol,4 and degrade heme to iron,5 staphylobilin,6 and formaldehyde.7 The final two enzymes of this pathway responsible for heme degradation, IsdG and IsdI, appear to be potentially promising antibiotic targets since their inhibition would not only starve S. aureus of a vital nutrient, iron,3 but also lead to the build-up of a toxic molecule, heme.8 Indeed, it has been shown that both IsdG and IsdI are required for pathogenesis in mice.3 However, there remain several open questions regarding the biochemistry of IsdG and IsdI that must be answered before a selective inhibitor of these enzymes can be designed.
The fundamental issue is that IsdG and IsdI have similar enzymatic functions to human heme oxygenases (HOs), and the differences between the enzyme families must be elucidated in order to selectively inhibit IsdG and IsdI in the presence of human HOs. Human HOs are members of a class of enzymes known as canonical HOs that oxygenate heme to biliverdin,9 while IsdG and IsdI are non-canonical HOs that degrade heme to staphylobilin.6 One difference between these classes of enzymes to potentially target is the first oxygenation reaction catalyzed by both HO families: the conversion of heme to meso-hydroxyheme.10, 11 Canonical HOs rely upon a conserved water cluster to guide a transient hydroxyl radical to the meso carbon of heme (Fig. 1),12-14 whereas it has been proposed that non-canonical HOs proceed through a bridged Fe–O–O–C transition state.15, 16 Another target for selective inhibition of IsdG and IsdI in the presence of human HOs is the meso-hydroxyheme intermediate. In canonical HOs, meso-hydroxyheme is converted to verdoheme and biliverdin,17 whereas IsdG and IsdI convert this intermediate to formyl-oxo-bilin and staphylobilin (Fig. 2).11 Based upon data available prior to this publication, the most promising strategy for selective inhibition of IsdG and IsdI in the presence of human HOs was competitive inhibition since the dissociation equilibrium constants for heme from IsdG and IsdI were reported to be 1000-fold greater than for heme from human HOs.5, 18, 19
Fig. 1.

There are several important differences between human HOs and the non-canonical HOs IsdG and IsdI from S. aureus. Human HOs bind heme via His25 with nanomolar Kd values and degrade this substrate to biliverdin, carbon monoxide, and iron. Asp140 organizes a network of water molecules that guides a transient hydroxyl radical to the meso carbon of heme. In contrast, S. aureus IsdG and IsdI have been reported to bind heme via His76/77 with micromolar Kd values and produce statphylobilin, formaldehyde, and iron. The second-sphere residues Asn6/7 and Trp66/67 are essential for enzymatic turnover.
Fig. 2.

IsdG and IsdI degrade heme to staphylobilin via a meso-hydroxyheme intermediate. The first oxygenation reaction proceeds via a mechanism that is distinct from that of human HOs. The second oxygenation reaction is unique to IsdG and IsdI.
Nevertheless, several observations call into question the accuracy of the Kd values reported in the literature for heme-bound IsdG (IsdG–heme) and IsdI (IsdI–heme). First, it was recently reported that the concentration of the cytosolic labile heme pool is 20-40 nM,20, 21 which means that only 1% of cytosolic heme would be bound to IsdG and IsdI under typical conditions based upon the reported micromolar Kd values.5 It is unrealistic to suggest that the Isd pathway increases the concentration of cytosolic heme to micromolar concentrations, since a recent study has demonstrated that this concentration of heme is toxic to S. aureus.8 Finally, micromolar Kd values for IsdG–heme and IsdI–heme simply do not fit with the observation of this laboratory that heme is almost fully protein-bound following separation of a mixture of IsdG–heme (or IsdI–heme) and heme by size-exclusion chromatography. A potential explanation for these observations relates to the fact that the Kd values for IsdG–heme and IsdI–heme were determined by fitting UV/Vis absorption titration data to a Michaelis-Menten model.5 Subsequent research has called into question whether this enzyme follows Michaelis-Menten kinetics due to the requirement of at least three substrates,5, 7, 11 plus a reductase,22 and the presence of at least two enzymatic intermediates.11 Thus, the dissociation constants for IsdG–heme and IsdI–heme were re-investigated.
This paper reports Kd measurements for heme dissociation from S. aureus IsdG and IsdI by UV/Vis absorption and fluorescence spectroscopies, and koff estimates from apomyoglobin competition assays. UV/Vis absorption-detected titrations of heme into IsdG and IsdI were fit to a model that did not employ the weak binding approximation, where the total ligand concentration is used to approximate the unbound ligand concentration, resulting in a quadratic equation.23 This approximation-free model is essential whenever the Kd for ligand dissociation is significantly smaller than the protein concentration. Careful analyses of these data revealed that the values measured by UV/Vis absorption spectroscopy only represent an upper-bound. Thus, a more sensitive fluorescence-detected assay was developed. Fits of the fluorescence-detected titrations yield accurate Kd values for IsdG–heme and IsdI–heme in the nanomolar range. Analyses of the apomyoglobin competition assays yielded koff rates on the order of 10-2 s-1. The implications of these results for the accuracy of Kd values reported in the literature, for the in vivo functions of IsdG and IsdI, and for the design of a selective IsdG inhibitor are discussed.
Experimental
Unless otherwise noted, all materials in this work were purchased from Fisher Scientific and used without further purification.
Expression and purification
The cloning of IsdG and IsdI into pET-15b (Ampr, Novagen) and S219V tobacco etch virus (TEV) protease into pRK793 (Ampr) have been previously described. 15, 24, 25 IsdG and IsdI were expressed as previously described for IsdG,5 with one change. Expression was induced at OD600 = 0.8 with 1.0 mM isopropyl β-D-1-thiogalactopyranoside, and cell growth continued for four hours at 37 °C. S219V TEV protease was expressed and purified as previously described.15
IsdG was purified as previously described,15 with minor changes noted below. Following cleavage of IsdG by S219V TEV protease, 50 mM imidazole was added and the solution was loaded onto a HisPur Ni-NTA column (Pierce). The flow-through was collected and the column was washed with 50 mM Tris pH 7.4, 150 mM NaCl, 50 mM imidazole. The wash was collected and pooled with the flow-through. IsdG was then dialyzed against 1 L of 50 mM Tris pH 7.4, 150 mM NaCl. This procedure yields untagged IsdG in >99% purity as determined by SDS-PAGE gel electrophoresis (Fig. S1).
IsdI was purified as previously described,24 with the following changes. S219V TEV protease was added to His6-tagged IsdI in an OD280 ratio of 1:10 with sufficient dithiothreitol and ethylenediaminetetracetic acid to reach final concentrations of 1 mM and 0.5 mM, respectively. The mixture was dialyzed twice against 50 mM NaPi pH 7.4, 150 mM NaCl; then once against 50 mM Tris pH 7.4, 150 mM NaCl, all at 4 °C. The dialyzed solution was then loaded onto a Ni-NTA column equilibrated with 50 mM Tris pH 7.4, 150 mM NaCl and all flow-through was collected. The flow-through was reloaded onto a Ni-NTA column equilibrated with 50 mM Tris pH 7.4, 150 mM NaCl one additional time and all flow-through was collected. This procedure yields untagged IsdI in >99% purity as determined by SDS-PAGE gel electrophoresis (Fig. S2).
Apomyoglobin was prepared via extraction of heme from equine skeletal muscle myoglobin (Sigma-Aldrich) using the methyl ethyl ketone method,26 as recently described.27
Spectroscopic Characterization
The extinction coefficients for IsdG–heme and IsdI–heme were determined using a procedure similar to one previously described.15 IsdG–heme and IsdI–heme in 50 mM Tris pH 7.4, 150 mM NaCl were prepared, and their room temperature UV/Vis absorption spectra were acquired from 700 to 325 nm at a scan rate of 600 nm/min with a 1.0 nm data interval and 0.1 s integration time on a Cary 100 Bio UV-Vis Spectrophotometer. The extinction coefficients for IsdG–heme and IsdI–heme at 411 nm were found to be 98.5 mM-1cm-1 and 96.6 mM-1cm-1, respectively, as determined by the pyridine hemochrome method.28
UV/Vis absorption-detected heme titrations into IsdG and IsdI were carried out using the same spectroscopic equipment and parameters as described above. 6 μM samples of IsdG and IsdI in 50 mM Tris pH 7.4, 150 mM NaCl were prepared. The protein concentrations were estimated using a Bradford assay. A 250 μM hemin solution was prepared as previously described.29 Hemin was then titrated into the IsdG and IsdI solution in 1 μM increments. Prior to UV/Vis absorption spectral characterization, the solutions were allowed to equilibrate until no further spectral changes were observed.
Fluorescence-detected heme titrations into IsdG and IsdI were completed using similar protein samples. 60-80 nM samples of IsdG and IsdI, and 17.5 μM hemin solutions, were prepared in 50 mM Tris pH 7.4, 150 mM NaCl as previously described.29 Hemin was titrated into the IsdG and IsdI solutions in 16 nM increments, and allowed to equilibrate until no further spectral changes were observed. Titrations were considered complete when the fluorescence emission intensity change due to substrate binding was less than one percent of that of substrate-free protein. Fluorescence emission spectra were acquired for 285 nm excitation using a Photon Technology International QuantaMaster 4 spectrofluorometer equipped with a Xenon arc lamp connected to an LPS-220B power supply, an ASOC-10 electronics interface, an MD-4000 motor driver control, and a model 814 photomultiplier detection system. Emission spectra were acquired in the 420 to 300 nm range with a step size of 1 nm, an integration time of 1 s, and slit widths of 3 nm.
For heme dissociation rate measurements, mixtures of 3 μM IsdG–heme and 3 μM IsdG were prepared as described above. These solutions were transferred to Spectrosil quartz cuvettes (Starna) and apomyoglobin, prepared as described above, was added to a final concentration of 30 μM. Following a 7.5 s mixing time, the UV/Vis absorption intensity at 408 nm was monitored as a function of time using the spectroscopic equipment described above with a cycle time of 1.0 s and an integration time of 1.0 s for 30 min. UV/Vis absorption spectra were acquired before and after each kinetics experiment to confirm complete transfer of heme from IsdG to apomyoglobin (Fig. S3).30 Similar experiments were performed for IsdI.
Spectral Analysis
The UV/Vis absorption-detected heme titrations into IsdG and IsdI were analysed in order to determine the dissociation constant (Kd) of the heme substrate. The UV/Vis absorption intensity at 411 nm for a mixture of IsdG, IsdG–heme, and heme depends upon equation 1:
| (1) |
where [IsdGT] is the total IsdG concentration, [hemeT] is the total heme concentration, εIsdG–heme is the molar extinction coefficient for IsdG–heme at 411 nm, and εheme is the molar extinction coefficient for heme at 411 nm. The molar extinction coefficient for heme at 411 nm was determined to be 28.3 mM-1cm-1 based upon the reported extinction coefficient at 385 nm (58.4 mM-1cm-1).31 The UV/Vis absorption intensity at 411 nm as a function of [hemeT] was fit to equation 1 using GraphPad Prism 6.0g in order to determine [IsdGT], Kd, and their standard errors. The fitted value for [IsdGT] was compared to the value estimated from a Bradford assay to further assess the accuracy of the fit. A similar equation can be derived for IsdI. The complete derivation of equation 1 is available in the Supplementary Information.
The heme binding induced quenching of tryptophan fluorescence was analysed to extract Kd for IsdG–heme and IsdI–heme. The tryptophan fluorescence intensity for a mixture of IsdG, IsdG–heme, and heme depends upon equation 2:
| (2) |
where Fmax is the fluorescence intensity in the absence of heme and Fmin is the emission intensity for fully heme-bound IsdG. The fluorescence emission intensity at 323 nm as a function of [hemeT] was fit to equation 2 using GraphPad Prism 6.0g to extract Kd and its standard error. [IsdGT] was constrained to the values determined by the UV/Vis absorption titrations described above prior to sample dilution. A similar equation can be derived for 318 nm fluorescence emission from IsdI. The complete derivation of equation 2 is available in the Supplementary Information.
The first-order rate constants for heme transfer from IsdG–heme or IsdI–heme to apomyoglobin were estimated from the kinetic assays by fitting the UV/Vis absorption intensity at 408 nm to equation 3:
| (3) |
where A0 is the UV/Vis absorption intensity at 0 s, A∞ is the UV/Vis absorption intensity at equilibrium, and koff is the dissociation rate constant. The UV/Vis absorption intensity at 408 nm as a function of time was fit to equation 3 using Graph Pad Prism 6.0g in order to determine A0, A∞, koff, and their standard errors. The fitted values for A0 and A∞ were compared to the UV/Vis absorption intensity at 408 nm before and after the kinetic assay to further assess the accuracy of the fit.
Results
UV/Vis Absorption Spectroscopy
One possible explanation for the discrepancy between the concentration of the labile heme pool and the Kd values for IsdG–heme and IsdI–heme is that the reported Kd values are too large.5, 20, 21 This explanation is reasonable because the Kd values reported in the literature were derived from fits of UV/Vis absorption titration data to a Michaelis-Menten kinetic model,5 and subsequent research has established that IsdG-catalyzed heme degradation does not follow this mechanism.11 Therefore, UV/Vis absorption-detected titrations of heme into IsdG and IsdI were analysed with an approximation-free model in order to estimate Kd values (Fig. 3). The UV/Vis absorption intensity at 411 nm was monitored as a function of titrated heme concentration since this wavelength corresponds to the intense Soret bands of IsdG–heme and IsdI–heme. These data were fit to equation 1, which yielded Kd values of 34 ± 20 nM and 15 ± 10 nM for IsdG and IsdI, respectively. These values are two orders of magnitude lower than those previously reported in the literature.5 At that point, it was clear that the Kd values reported in the literature were inconsistent with those reported here, but it was unclear which data set was more reliable.
Fig. 3.
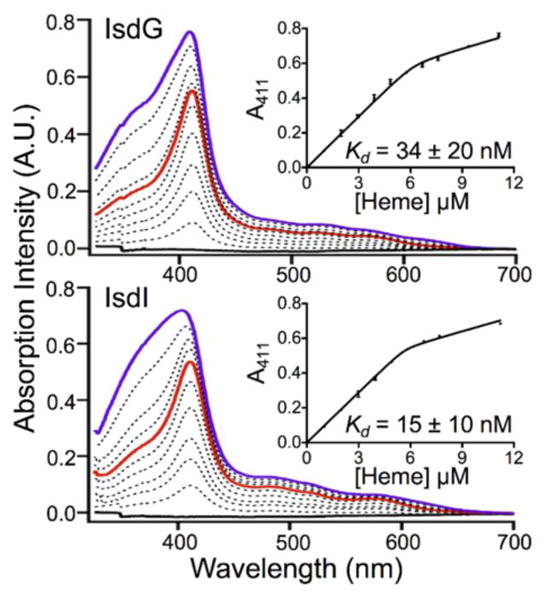
UV/Vis absorption-detected titration of heme into 6 μM IsdG (top) and IsdI (bottom) in 50 mM Tris pH 7.4, 150 mM NaCl. The spectra depict protein in the presence of 0 (solid black), 1 (solid red), 2 (solid violet), and intermediate (dashed black) equivalents of heme. Fits of the UV/Vis absorption intensity at 411 nm to equation 1 are shown in the insets, yielding Kd values of 34 ± 20 nM for IsdG and 15 ± 10 nM for IsdI. The vertical error bars represent the standard deviation of at least three independent measurements.
The accuracy of the Kd values measured here by fitting UV/Vis absorption data to an approximation-free binding model was assessed by comparing the experimental data to titration curves predicted for Kd values one order of magnitude smaller and larger than the best fit (Fig. 4). Fits of the IsdG and IsdI data to titration curves for the Kd values one order of magnitude less than the best fit decreased the R2 values by 0.001 or less. Fits of the titration curves to Kd values one order of magnitude larger than the best fit decreased the R2 values by approximately 0.01. Therefore, the Kd values reported here based upon UV/Vis absorption analysis are upper limits on the actual Kd values. Based upon the estimated Kd values, nearly all titrated heme is protein-bound for heme:protein ratios up to 1:1 at micromolar protein concentrations, which greatly limits the accuracy of the measurement. Thus, both the Kd values previously reported in the literature,5 and those estimated here based upon UV/Vis absorption data, are likely too large due to a fundamental issue with the sensitivity of UV/Vis absorption spectroscopy. Consequently, a more sensitive method for measuring the Kd of heme binding to IsdG and IsdI was sought.
Fig. 4.

Best fits of the UV/Vis absorption-detected heme titration data for IsdG (top) and IsdI (bottom) using equation 1 (solid black). The vertical error bars represent the standard deviation of at least three independent measurements. Titration curves predicted using equation 1 for Kd values one order of magnitude smaller (dotted red) and larger (dashed blue) than the best fit. Based upon the good fit of the UV/Vis absoprtion-detected heme titration data to a Kd value one order of magnitude smaller than the best fit, the Kd values estimated by UV/Vis absorption appear to be upper bounds on the actual value.
Fluorescence Spectroscopy
The greater sensitivity of fluorescence spectroscopy as compared to UV/Vis absorption spectroscopy enabled monitoring of heme binding to IsdG and IsdI at nanomolar concentrations of protein, which increased the concentration of unbound heme and was expected to improve the accuracy of the Kd measurement. The experiments described below rely upon the facts that both IsdG and IsdI have fluorescent Trp residues within 4 Å of the heme substrate,32 which acts as a quencher via Förster resonance energy transfer due to its partially filled Fe 3d subshell. The Trp emission intensity was monitored as a function of titrated heme concentration for 80 nM and 60 nM samples of IsdG and IsdI, respectively (Fig. 5). The fluorescence-detected heme titrations were fit to equation 2, which gave Kd values of 1.4 ± 0.6 nM for IsdG and 12.9 ± 1.3 nM for IsdI. Due to the higher Kd value for heme from IsdI, the titration into IsdI was continued out to 976 nM heme (Fig. S4), but only the data up to 400 nM heme is shown here to ease comparison with IsdG. The fluorescence intensities at 340 nm were also analysed using equation 2 to avoid the signal arising from the Raman scattering of water, and similar results were obtained (Fig. S5). The Kd values derived from fitting fluorescence data are smaller than those estimated from UV/Vis absorption-detected heme titrations reported both here (Fig. 3), and in the literature.5 Due to the differences between the Kd values derived from UV/Vis absorption and fluorescence-monitored heme titrations, the accuracy of the fluorescence fits was assessed carefully.
Fig. 5.

Fluorescence-detected titration of heme into 80 nM IsdG (top) and 60 nM IsdI (bottom) in 50 mM Tris pH 7.4, 150 mM NaCl. The vertical error bars represent the standard deviation of at least three independent measurements. The emission spectra for 285 nm excitation are shown in the insets. Fits of the emission intensity to equation 2 yielded Kd values of 1.4 ± 0.6 nM for IsdG and 12.9 ± 1.3 nM for IsdI.
As was the strategy for assessing the accuracy of the UV/Vis absorption data, the fluorescence data was compared to titration curves predicted for Kd values one order of magnitude smaller and larger than the best fit (Fig. 6). Fits of the fluorescence data to Kd values one order of magnitude less than the best fit decreased the R2 values by 0.01 to 0.1. Fits of the IsdG and IsdI data to titration curves for Kd values one order of magnitude larger than the best fit decreased R2 by approximately 0.1. Thus, the Kd values derived from analysis of the fluorescence data are accurate, and values estimated based upon UV/Vis absorption spectroscopy overestimate Kd for IsdG–heme and IsdI–heme. Importantly, the accurate Kd values measured using fluorescence spectroscopy are consistent with the concentration of the labile heme pool and both enzymes are expected to bind heme tightly in vivo.20, 21 It is also interesting to note that the Kd values for IsdG–heme and IsdI–heme are significantly different from one another. In summary, the data presented here indicates that the Kd values for IsdG–heme and IsdI–heme are two to three orders of magnitude lower than previously reported,5 which is no w consistent with the concentration of the labile heme pool,20, 21 and heme binding to IsdG is nine-fold tighter than heme binding to IsdI.
Fig. 6.

Best fits of the fluorescence-detected heme titration data for IsdG (top) and IsdI (bottom) using equation 2 (solid black). The vertical error bars represent the standard deviation of at least three independent measurements. Titration curves predicted using equation 2 for Kd values one order of magnitude smaller (dotted red) and larger (dashed blue) than the best fit. Based upon the poor fit of the fluorescence-detected heme titration data to Kd values one order of magnitude smaller or larger than the best fit, the Kd values determined by fluorescence spectroscopy are accurate.
Apomyoglobin Competition Assays
The difference between the Kd values for heme dissociation from IsdG–heme and IsdI–heme suggested that the rates for heme dissociation from IsdG–heme and IsdI–heme may be different. The koff rates for IsdG–heme and IsdI–heme were estimated by measuring the rates of heme transfer to apomyoglobin in a competition assay, an approach that was previously used to estimate koff rates for HO-2,19 IsdA,33 IsdB,34, 35 IsdC,33 and IsdE.34 Since the Kd for heme dissociation from myoglobin is femtomolar and kon for heme association is on the order of 108 M-1s-1,36 these rates will primarily depend upon the koff rates for IsdG–heme and IsdI–heme. Analyses of the kinetic data yielded estimates of 0.022 ± 0.002 and 0.092 ± 0.008 s-1 for the koff rates of IsdG–heme and IsdI–heme, respectively (Fig. 7). According to these data, the rate of heme dissociation from IsdG–heme is four-fold slower than heme dissociation from IsdI–heme. This is consistent with the differences between the Kd values reported in this work. As will be discussed below, the heme dissociation differences between IsdG–heme and IsdI–heme have important biological and medical implications.
Fig. 7.

UV/Vis absorption-detected kinetic traces for heme transfer from 3 μM IsdG–heme to 30 μM apomyoglobin (top) and 3 μM IsdI–heme to 30 μM apomyoglobin (bottom) in 50 mM Tris pH 7.4, 150 mM NaCl. The first 100 s of data are shown in the insets. The gray shaded regions represent the standard deviation of at least three separate measurements. Fits of the kinetic data to equation 3 yielded koff values of 0.022 ± 0.002 and 0.092 ± 0.008 s-1 for IsdG–heme and IsdI–heme, respectively.
Discussion
The data reported in this article has important implications for all heme oxygenase enzymes. The nanomolar Kd values measured for IsdG–heme and IsdI–heme are 2-3 orders of magnitude lower than those previously reported for these enzymes.5 However, the Kd values reported here for IsdG and IsdI are on the same order of magnitude as those recently reported for truncated, soluble forms of HO-1 and HO-2 lending support for the Kd values measured here for non-canonical heme oxygenases.18, 19 The fundamental problem with the older Kd measurements for IsdG and IsdI is that heme is 99.9% protein-bound prior to saturation when a nanomolar dissociation constant is measured at micromolar protein concentrations, which makes accurate curve fitting to extract an accurate Kd value nearly impossible. These data highlight the existence of a dangerous minefield in the biochemical literature. The Kd value for heme dissociation from a heme oxygenase is below the lower limit of detection for UV/Vis absorption spectroscopy, especially if a weak binding approximation is employed. All reported Kd values for HOs must be reviewed on a case-by-case basis, and for cases where micromolar Kd values are accurate, researchers should reconsider whether these proteins are competent heme oxygenases in vivo.
Since both IsdG and IsdI are transcriptionally-regulated by the ferric uptake regulator;3 both degrade heme to non-heme iron,5 staphylobilin,6 and formaldehyde;7 and both are required for pathogenesis in mice; the purpose for two nearly identical enzymes in S. aureus has remained an open question. One key clue has been that the half-life of IsdG is increased 2.5-fold by the presence of heme whereas the half-life of IsdI is unaffected by the presence of heme,3 and now the facts that IsdG and IsdI have different Kd and koff values for heme dissociation can be considered two additional clues. These three facts imply that in low heme conditions, IsdG will be degraded and IsdI will be the sole heme oxygenase present at a significant concentration. The Kd value for IsdI is on the same order as the concentration of the cytosolic labile heme pool,20, 21 suggesting that IsdI may regulate heme levels and mitigate heme toxicity.3 In contrast, when the concentration of cytosolic heme is increased by an active Isd pathway, IsdG will be the primary heme oxygenase due to its lower Kd value. Due to the tight binding of heme by IsdG, there is no apparent need for a heme trafficking protein between the IsdDEF cytoplasmic membrane transporter and IsdG in the S. aureus heme iron acquisition pathway.2, 4 Thus, while IsdG and IsdI have the same chemical function, it appears that the two enzymes have distinct biological functions.
Finally, the Kd values reported here have important implications for the rational design of a selective IsdG inhibitor. Since IsdG enzymes have been discovered in several human pathogens, including S. aureus,5 Bacillus anthracis,37 and Listeria monocytogenes,38 they have been identified as potential antibiotic targets.22, 39, 40 The first inhibitors of IsdG identified were non-iron metalloporphyrins (Fig. 8),32 but the tight binding of ferric heme by IsdG now seems to rule out competitive inhibition as a viable strategy. Later, it was established that cyanide and azide are uncompetitive inhibitors of IsdG that bind to the iron of IsdG–heme, block access for molecular oxygen, and prevent enzymatic turnover.15 Cyanide and azide are poor drugs due to their ability to inhibit canonical heme oxygenases,41, 42 but in principle it should be possible to design a selective, uncompetitive inhibitor for the heme to meso-hydroxyheme monooxygenation reaction or the meso-hydroxyheme to staphylobilin dioxygenation reaction (Fig. 2).11, 15, 16 A third strategy for IsdG inhibition is the development of an allosteric inhibitor analogous to the strategy currently being explored for a canonical heme oxygenase from Pseudomonas aeruginosa,43, 44 but there are no promising leads for this strategy and it does not appear necessary due to the significant structural and functional differences between IsdG and canonical heme oxygenases. Thus, the most promising strategy for developing a selective IsdG inhibitor is to elucidate the enzymatic mechanism of IsdG in order to identify and target features of the reaction that are unique compared to canonical heme oxygenases.
Fig. 8.

At least three strategies for IsdG inhibition can be envisaged. Based upon the Kd value reported here, competitive inhibition of IsdG seems impractical. However, uncompetitive or allosteric inhibition of IsdG should be feasible. Due to the significant structural and functional differences between IsdG and mammalian heme oxygenases, elucidation of the IsdG mechanism followed by design of an uncompetitve inhibitor appears to be the most promising strategy for development of a new antibiotic.
Conclusions
In summary, the Kd for heme dissociation from S. aureus IsdG and IsdI is 2-3 orders of magnitude lower than previously reported.5 To be specific, the Kd for heme dissociation from S. aureus IsdG is 1.4 ± 0.6 nM and Kd for IsdI is 12.9 ± 1.3 nM. The differences between the current and previous values are attributed to protein concentration; at the micromolar concentrations used previously, heme is 99.9% enzyme-bound making accurate data analysis nearly impossible. Here, the development of a fluorescence spectroscopy-based assay enabled measurements at nanomolar protein concentrations. In addition, apomyoglobin competition assays estimated koff rates of 0.022 ± 0.002 and 0.092 ± 0.008 s-1 for IsdG–heme and IsdI–heme, respectively. Notably, these are the first reports of significant differences between the biochemical properties of IsdG and IsdI leading to the proposals that IsdG is the heme degrading member of the S. aureus Isd system and IsdI combats heme toxicity. Based upon the tight binding of heme by IsdG, this enzyme is not a good candidate for competitive inhibition. Instead, researchers should pursue uncompetitive inhibition of IsdG, which will be aided by a more detailed understanding of enzyme mechanism.
Supplementary Material
Significance to Metallomics.
Staphylococcus aureus uses the iron-regulated surface determinant system to acquire an essential nutrient, iron, from its host organism. Here, the heme dissociation constants for two putative members of this pathway have been measured. These data provide insight into heme iron trafficking and homeostasis in S. aureus.
Acknowledgments
M.D.L. thanks the National Institutes of Health (R01-GM114277) and the National Science Foundation (DMR-1506248) for financial support. In addition, D.P. thanks ACS Project SEED for summer support.
Footnotes
Electronic Supplementary Information (ESI) available: derivations of equations 1 and 2, SDS-PAGE gels, UV/Vis absorption spectra for apomyoglobin competition assays, complete fit of fluorescence-detected titration of heme into IsdI, fits of 340 nm emission data. See DOI: 10.1039/x0xx00000x
References
- 1.David MZ, Daum RS. Clin Microbiol Rev. 2010;23:616–687. doi: 10.1128/CMR.00081-09. [DOI] [PMC free article] [PubMed] [Google Scholar]
- 2.Mazmanian SK, Skaar EP, Gaspar AH, Humayun M, Gornicki P, Jelenska J, Joachmiak A, Missiakas DM, Schneewind O. Science. 2003;299:906–909. doi: 10.1126/science.1081147. [DOI] [PubMed] [Google Scholar]
- 3.Reniere ML, Skaar EP. Mol Microbiol. 2008;69:1304–1315. doi: 10.1111/j.1365-2958.2008.06363.x. [DOI] [PMC free article] [PubMed] [Google Scholar]
- 4.Muryoi N, Tiedemann MT, Pluym M, Cheung J, Heinrichs DE, Stillman MJ. J Biol Chem. 2008;283:28125–28136. doi: 10.1074/jbc.M802171200. [DOI] [PMC free article] [PubMed] [Google Scholar]
- 5.Skaar EP, Gaspar AH, Schneewind O. J Biol Chem. 2004;279:436–443. doi: 10.1074/jbc.M307952200. [DOI] [PubMed] [Google Scholar]
- 6.Reniere ML, Ukpabi GN, Harry SR, Stec DF, Krull R, Wright DW, Bachmann BO, Murphy ME, Skaar EP. Mol Microbiol. 2010;75:1529–1538. doi: 10.1111/j.1365-2958.2010.07076.x. [DOI] [PMC free article] [PubMed] [Google Scholar]
- 7.Matsui T, Nambu S, Ono Y, Goulding CW, Tsumoto K, Ikeda-Saito M. Biochemistry. 2013;52:3025–3027. doi: 10.1021/bi400382p. [DOI] [PMC free article] [PubMed] [Google Scholar]
- 8.Wakeman CA, Stauff DL, Zhang Y, Skaar EP. J Bacteriol. 2014;196:1335–1342. doi: 10.1128/JB.01067-13. [DOI] [PMC free article] [PubMed] [Google Scholar]
- 9.Tenhunen R, Marver HS, Schmid R. J Biol Chem. 1969;244:6388–6394. [PubMed] [Google Scholar]
- 10.Liu Y, Moënne-Loccoz P, Loehr TM, Ortiz de Montellano PR. J Biol Chem. 1997;272:6909–6917. doi: 10.1074/jbc.272.11.6909. [DOI] [PubMed] [Google Scholar]
- 11.Streit BR, Kant R, Tokmina-Lukaszewska M, Celis AI, Machovina MM, Skaar EP, Bothner B, DuBois JL. J Biol Chem. 2016;291:862–871. doi: 10.1074/jbc.M115.666560. [DOI] [PMC free article] [PubMed] [Google Scholar]
- 12.Syvitski RT, Li Y, Auclair K, Ortiz de Montellano PR, La Mar GN. J Am Chem Soc. 2002;124:14296–14297. doi: 10.1021/ja028108x. [DOI] [PubMed] [Google Scholar]
- 13.Garcia-Serres R, Davydov RM, Matsui T, Ikeda-Saito M, Hoffman BM, Huynh BH. J Am Chem Soc. 2007;129:1402–1412. doi: 10.1021/ja067209i. [DOI] [PMC free article] [PubMed] [Google Scholar]
- 14.Chen H, Moreau Y, Derat E, Shaik S. J Am Chem Soc. 2008;130:1953–1965. doi: 10.1021/ja076679p. [DOI] [PubMed] [Google Scholar]
- 15.Lockhart CL, Conger MA, Pittman D, Liptak MD. J Biol Inorg Chem. 2015;20:757–770. doi: 10.1007/s00775-015-1263-5. [DOI] [PubMed] [Google Scholar]
- 16.Takayama SJ, Loutet SA, Mauk AG, Murphy ME. Biochemistry. 2015;54:2613–2621. doi: 10.1021/acs.biochem.5b00239. [DOI] [PubMed] [Google Scholar]
- 17.Sano S, Sano T, Morishima I, Shiro Y, Maeda Y. Proc Natl Acad Sci. 1986;83:531–535. doi: 10.1073/pnas.83.3.531. [DOI] [PMC free article] [PubMed] [Google Scholar]
- 18.Koga S, Yoshihara S, Bando H, Yamasaki K, Higashimoto Y, Noguchi M, Sueda S, Komatsu H, Sakamoto H. Anal Biochem. 2013;433:2–9. doi: 10.1016/j.ab.2012.10.002. [DOI] [PubMed] [Google Scholar]
- 19.Fleischhacker AS, Sharma A, Choi M, Spencer AM, Bagai I, Hoffman BM, Ragsdale SW. Biochemistry. 2015;54:2709–2718. doi: 10.1021/acs.biochem.5b00266. [DOI] [PMC free article] [PubMed] [Google Scholar]
- 20.Song Y, Yang M, Wegner SV, Zhao J, Zhu R, Wu Y, He C, Chen PR. ACS Chem Biol. 2015;10:1610–1615. doi: 10.1021/cb5009734. [DOI] [PubMed] [Google Scholar]
- 21.Hanna DA, Harvey RM, Martinez-Guzman O, Yuan X, Chandrasekharan B, Raju G, Outten FW, Hamza I, Reddi AR. Proc Natl Acad Sci. 2016;113:7539–7544. doi: 10.1073/pnas.1523802113. [DOI] [PMC free article] [PubMed] [Google Scholar]
- 22.Loutet SA, Kobylarz MJ, Chau CHT, Murphy MEP. J Biol Chem. 2013;288:25749–25759. doi: 10.1074/jbc.M113.470518. [DOI] [PMC free article] [PubMed] [Google Scholar]
- 23.Yi L, Ragsdale SW. J Biol Chem. 2007;282:21056–21067. doi: 10.1074/jbc.M700664200. [DOI] [PMC free article] [PubMed] [Google Scholar]
- 24.Graves AB, Horak EH, Liptak MD. Dalton Trans. 2016;45:10058–10067. doi: 10.1039/c6dt00702c. [DOI] [PubMed] [Google Scholar]
- 25.Kapust RB, Tözsér J, Fox JD, Anderson DE, Cherry S, Copeland TD, Waugh DS. Protein Eng. 2001;14:993–1000. doi: 10.1093/protein/14.12.993. [DOI] [PubMed] [Google Scholar]
- 26.Teale FWJ. Biochim Biophys Acta. 1959;35:543. doi: 10.1016/0006-3002(59)90407-x. [DOI] [PubMed] [Google Scholar]
- 27.Carter EL, Gupta N, Ragsdale SW. J Biol Chem. 2016;291:2196–2222. doi: 10.1074/jbc.M115.670281. [DOI] [PMC free article] [PubMed] [Google Scholar]
- 28.Berry EA, Trumpower BL. Anal Biochem. 1987;161:1–15. doi: 10.1016/0003-2697(87)90643-9. [DOI] [PubMed] [Google Scholar]
- 29.Graves AB, Morse RP, Chao A, Iniguez A, Goulding CW, Liptak MD. Inorg Chem. 2014;53:5931–5940. doi: 10.1021/ic500033b. [DOI] [PMC free article] [PubMed] [Google Scholar]
- 30.Hargrove MS, Singleton EW, Quillin ML, Ortiz LA, Phillips GN, Olson JS. J Biol Chem. 1994;269:4207–4214. doi: 10.2210/pdb1mgn/pdb. [DOI] [PubMed] [Google Scholar]
- 31.Dawson RMC, Elliot CD, Elliot WH, Jones MK. Data for Biochemical Research. Clarendon Press; Oxford, U.K.: 1989. [Google Scholar]
- 32.Lee WC, Reniere ML, Skaar EP, Murphy MEP. J Biol Chem. 2008;283:30957–30963. doi: 10.1074/jbc.M709486200. [DOI] [PMC free article] [PubMed] [Google Scholar]
- 33.Liu M, Tanaka WN, Zhu H, Xie G, Dooley DM, Lei B. J Biol Chem. 2008;283:6668–6676. doi: 10.1074/jbc.M708372200. [DOI] [PMC free article] [PubMed] [Google Scholar]
- 34.Zhu H, Xie G, Liu M, Olson JS, Fabian M, Dooley DM, Lei B. J Biol Chem. 2008;283:18450–18460. doi: 10.1074/jbc.M801466200. [DOI] [PMC free article] [PubMed] [Google Scholar]
- 35.Gaudin CFM, Grigg JC, Arrieta AL, Murphy ME. Biochemistry. 2011;50:5443–5452. doi: 10.1021/bi200369p. [DOI] [PMC free article] [PubMed] [Google Scholar]
- 36.Hargrove MS, Barrick D, Olson JS. Biochemistry. 1996;35:11293–11299. doi: 10.1021/bi960371l. [DOI] [PubMed] [Google Scholar]
- 37.Skaar EP, Gaspar AH, Schneewind O. J Bacteriol. 2006;188:1071–1080. doi: 10.1128/JB.188.3.1071-1080.2006. [DOI] [PMC free article] [PubMed] [Google Scholar]
- 38.Duong T, Park K, Kim T, Kang SW, Hahn MJ, Hwang HY, Kim KK. Acta Cryst. 2014;D70:615–626. doi: 10.1107/S1399004713030794. [DOI] [PubMed] [Google Scholar]
- 39.Wilks A, Burkhard KA. Nat Prod Rep. 2007;24:511–522. doi: 10.1039/b604193k. [DOI] [PubMed] [Google Scholar]
- 40.Choby JE, Skaar EP. J Mol Biol. 2016;428:3408–3428. doi: 10.1016/j.jmb.2016.03.018. [DOI] [PMC free article] [PubMed] [Google Scholar]
- 41.Hernandez G, Wilks A, Paolesse R, Smith KM, Ortiz de Montellano PR, La Mar GN. Biochemistry. 1994;33:6631–6641. doi: 10.1021/bi00187a033. [DOI] [PubMed] [Google Scholar]
- 42.Zeng Y, Caignan GA, Bunce RA, Rodríguez JC, Wilks A, Rivera M. J Am Chem Soc. 2005;127:9794–9807. doi: 10.1021/ja0425987. [DOI] [PubMed] [Google Scholar]
- 43.Hom K, Heinzl GA, Eakanunkul S, Lopes PEM, Xue F, MacKerrell AD, Wilks A. J Med Chem. 2013;56:2097–2109. doi: 10.1021/jm301819k. [DOI] [PMC free article] [PubMed] [Google Scholar]
- 44.Heinzl GA, Huang W, Yu W, Giardina BJ, Zhou Y, MacKerrell AD, Wilks A, Xue F. J Med Chem. 2016;59:6929–6942. doi: 10.1021/acs.jmedchem.6b00757. [DOI] [PMC free article] [PubMed] [Google Scholar]
Associated Data
This section collects any data citations, data availability statements, or supplementary materials included in this article.