

Abstract
Efficient systemic administration of therapeutic short interfering RNA (siRNA) is challenging. High-density lipoproteins (HDL) are natural in vivo RNA delivery vehicles. Specifically, native HDLs: 1) Load single-stranded RNA; 2) Are anionic, which requires charge reconciliation between the RNA and HDL, and 3) Actively target scavenger receptor type B-1 (SR-B1) to deliver RNA. Emphasizing these particular parameters, we employed templated lipoprotein particles (TLP), mimics of spherical HDLs, and self-assembled them with single-stranded complements of, presumably, any highly unmodified siRNA duplex pair after formulation with a cationic lipid. Resulting siRNA templated lipoprotein particles (siRNA-TLP) are anionic and tunable with regard to RNA assembly and function. Data demonstrate that the siRNA-TLPs actively target SR-B1 to potently reduce androgen receptor (AR) and enhancer of zeste homolog 2 (EZH2) proteins in multiple cancer cell lines. Systemic administration of siRNA-TLPs demonstrated no off-target toxicity and significantly reduced the growth of prostate cancer xenografts. Thus, native HDLs inspired the synthesis of a hybrid siRNA delivery vehicle that can modularly load single-stranded RNA complements after charge reconciliation with a cationic lipid, and that function due to active targeting of SR-B1.
Keywords: lipoprotein, nanoparticle, siRNA, active delivery, single-strand RNA
1. Introduction
Systemic administration of therapeutic short interfering RNA (siRNA) is tremendously appealing due to the ability of siRNA to potently silence any protein target and the opportunities that exist for personalized medicine.[1] Some progress has been made with recent clinical trials demonstrating systemic delivery of therapeutic siRNA; however, drugs mostly target protein expression in the liver and none are FDA approved.[1, 2] More specific to oncology applications, only four systemically administered agents have reached Phase I clinical trials, one was actively targeted, two moved on to Phase II, and none are FDA approved.[3] Ultimately, targeted systemic delivery of therapeutic siRNA remains difficult due to a number of well-known factors, such as: (1) Inherent siRNA instability, (2) Inefficient active delivery to target cells, (3) Exclusion of siRNA from the target cell cytosol where mRNA targets reside, (4) RNA target selection, (5) Toxicity, and (6) Complexity, scalability, and cost.[4–7] In short, realizing the full potential of systemically administered therapeutic siRNA, especially for advanced solid tumors, requires the evolution and development of new technology.
Individual and combinations of strategies have been employed to enhance the efficacy of therapeutic siRNA. Notably, chemical modifications to the siRNA phosphate backbone and/ or ribose sugar have improved RNA stability and can limit off-target effects.[8] However, chemical modifications can significantly increase cost, may generate off-target effects, and can reduce siRNA efficacy.[8] In addition, many siRNA delivery vehicles have been developed. Almost exclusively, delivery vehicles are formed by self-assembling cationic lipids (lipoplexes) or polymers (polyplexes) that encapsulate duplex siRNA.[9] Another example is coupling lipids with lysine-based peptides to form lipopeptides that can encapsulate siRNA.[10] Some of these cationic vehicles have been shown to increase siRNA stability, improve circulating half-life, and enhance cell uptake. However, toxicity, serum opsonization, and lack of active targeting remain significant drawbacks to cationic siRNA delivery vehicles.[11, 12] Ultimately, identifying simple strategies for formulating largely unmodified siRNAs and alternatives to passively targeted cationic delivery vehicles are important for developing the next generation of therapeutic siRNAs.
There is significant interest in developing synthetic mimics of natural RNA delivery vehicles.[8] In particular, HDLs are appealing because they naturally bind endogenous RNAs, like microRNA, stabilize single-stranded RNA (ssRNA) to nuclease degradation, and deliver them to target cells to regulate gene expression.[13, 14] HDL-mediated delivery of RNA is dependent upon target cell expression of scavenger receptor type B-1 (SR-B1), the high-affinity receptor for mature spherical HDLs that have apolipoprotein A-I (apoA-I) on their surface.[13, 15, 16] In addition to HDL, SR-B1 binds anionic particulate ligands in a wide variety of sizes.[17–19] HDLs appear to overcome hurdles to successful systemic delivery of RNA to target cells that express SR-B1. These data have motivated our group[20, 21], and others, to develop synthetic mimics of HDLs that efficiently load, stabilize, and deliver therapeutic RNAs, like siRNA.[22–28] Despite these efforts, further research is required to improve and fundamentally understand the critical properties that enable RNA delivery by synthetic, bio-inspired vehicles.
In this work, we focused on synthesizing particles with an emphasis on the following properties of natural HDL that appear to enable targeted systemic delivery of RNA, including: 1) The ability to bind and stabilize single-stranded RNA in a scalable and modular fashion, 2) Charge reconciliation between HDL and RNA that enables nucleic acid binding and efficient RNA delivery, and 3) Active targeting of SR-B1 for RNA delivery.[13] According to these design elements, we synthesized templated lipoprotein particles (TLP), mimics of spherical HDL, and used them in a self-assembly process that incorporates and stabilizes ssRNA complements of siRNA duplexes after complexation with a cationic lipid. Importantly, employing a cationic lipid reconciles the negative charge of ssRNAs and TLPs enabling efficient and tunable siRNA-TLP self-assembly and function. The particles actively target SR-B1 to potently regulate target gene expression in multiple cancer cell lines in vitro and in an in vivo xenograft model without inherent toxicity. Finally, with an eye toward translation to human patients, siRNA-TLPs are modular such that specific siRNAs targeting different disease-relevant proteins can be formulated with pre-fabricated TLPs demonstrating the potential to manufacture, scale-up, and provide on-demand patient-specific siRNA therapy.
2. Results and Discussion
2.1 The Synthesis of Templated Lipoprotein Nanoparticles
Natural HDL is an anionic delivery vehicle for unmodified RNAs.[13] As such, one goal of this work was to fundamentally understand and develop synthetic particles that incorporate highly unmodified single-stranded complements of a desired siRNA duplex. We started by generating a lipoprotein inspired particle by surface-functionalizing a 5 nm diameter gold nanoparticle (Au NP) template with apolipoprotein A-I (apoA-I), the defining HDL protein,[29] a mixture of two phospholipids, and cholesterol (Scheme 1). The phospholipid containing a di-sulfide headgroup binds to the Au NP providing a hydrophobic surface for the assembly of the outer phospholipid and cholesterol.[21, 30, 31] The outer phospholipid and cholesterol were chosen because they favorably associate with nucleic acids and have been shown to enhance nucleic acid delivery.[32] Characterization of the TLPs reveals similar shape (spherical), size (13 ± 2 nm), and anionic charge (−42 ± 1 mV), comparable to natural HDL.[21] Large batches of TLPs were synthesized, purified, and stored for several months at 4°C, providing a platform for investigating modular addition of RNA.
Scheme 1.
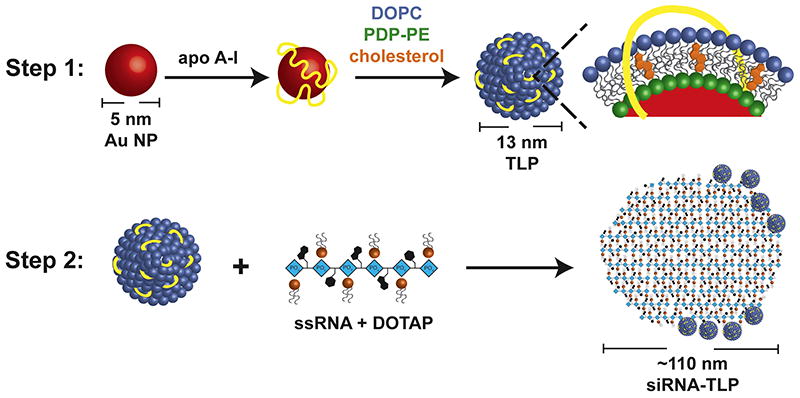
Scheme for siRNA-TLP synthesis. In Step 1, TLPs are synthesized. In Step 2, TLPs are mixed with single-strand RNA (ssRNA), complement strands of a siRNA duplex, complexed with DOTAP.
2.2 Charge Reconciliation by DOTAP Enables Optimal Self-Assembly of Single-Strand RNA to Form siRNA-TLPs
Next, conditions supporting the self-assembly of RNA with TLPs were identified. As an initial proof-of-concept, siRNA sequences were designed to target the androgen receptor (AR), a well-established target for prostate cancer (Table S1).[33] The AR, and the AR signaling axis, is a highly validated systemic target in patients with advanced prostate cancer even after failing the gold standard therapy for systemic disease, castration.[34] Due to the negative charge of TLPs and RNA, 1,2-dioleoyl-3-trimethylammonium-propane (DOTAP), a cationic lipid known to complex RNA through electrostatic (head group-RNA phosphate) and hydrophobic (lipid tail-RNA nucleobase) interactions,[35] was added to mixtures of RNA in water or 1X phosphate buffered saline (PBS). A DOTAP:RNA molar ratio of 40:1 provided approximately one DOTAP molecule per phosphate of the ssRNA sequences (charge ratio ~1:1). RNA alone or DOTAP-RNA mixtures were added to TLPs. After overnight incubation, TLPs mixed with DOTAP-RNA in PBS were irreversibly aggregated and precipitated. Purified solutions of the remaining particles were subjected to ultraviolet-visible (UV-Vis) spectroscopy, which revealed a strong absorption band at ~520 nm, characteristic of disperse 5 nm diameter Au NPs.[36] However, only TLPs mixed with DOTAP-RNA in water demonstrated the presence of RNA by UV-Vis spectroscopy as indicated by a strong absorption at ~260 nm (Figure 1a). These data suggest that charge reconciliation by DOTAP is required for the self-assembly of RNA with TLPs. In addition, because self-assembly only occurred in water, these data suggest that RNA bound to TLPs are single-stranded.
Figure 1.
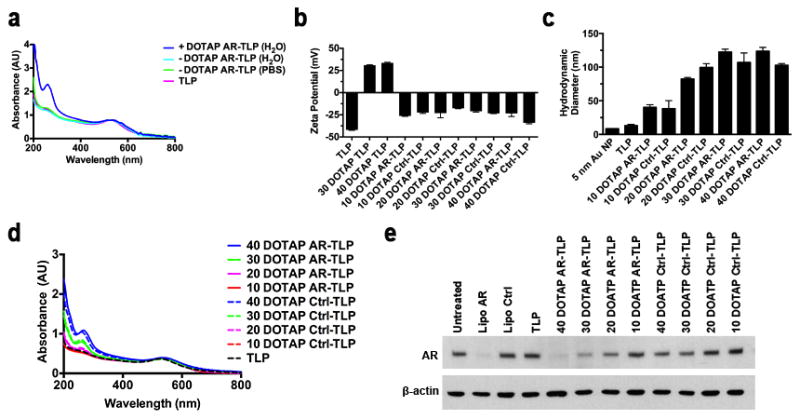
siRNA-TLP optimization, and function. (a) UV-Vis spectroscopy measurement of nanoparticle (λmax~520 nm) and RNA (λmax~260 nm) after centrifugation for purification from unreacted components. (b) ζ-potential measurement of TLPs, DOTAP-TLPs and siRNA-TLP particles synthesized with increasing DOTAP:RNA molar ratios from 10:1–40:1. (c) Hydrodynamic diameter (nm) measurement of 5 nm Au NP (PDI: 0.313 ± 0.192), TLP (PDI: 0.478 ± 0.140), and siRNA-TLP particles synthesized with increasing DOTAP:RNA molar ratios from 10:1–40:1. The polydispersity indices (PDI) are as follows: AR-TLP 10:1 (PDI: 0.184 ± 0.011), Ctrl-TLP 10:1 (PDI: 0.190 ± 0.003), AR-TLP 20:1 (PDI: 0.153 ± 0.004), Ctrl-TLP 20:1 (PDI: 0.183 ± 0.003), AR-TLP 30:1 (PDI: 0.174 ± 0.012), Ctrl-TLP 30:1 (PDI: 0.229 ± 0.007), AR-TLP 40:1 (0.118 ± 0.016), Ctrl-TLP 40:1 (0.121 ± 0.008). (d) UV-Vis spectroscopy measuring purified siRNA-TLPs synthesized with increasing DOTAP:RNA molar ratios. (e) Western blot of siRNA-TLP function regulating target AR expression in LNCaP cells (48 hrs, 20 nM siRNA-TLP). All UV-Vis spectra were normalized according to λmax~520 nm. AR = siRNA targeting the androgen receptor. Ctrl = scrambled control siRNA sequence. Lipo = Lipofectamine® RNAiMax.
To directly test if RNA bound to TLPs were single strands or if DOTAP facilitated siRNA duplex formation in water, thermal denaturation experiments were performed. RNA melting transitions were measured in water and in PBS and compared to the DOTAP-RNA mixture. A clear melting transition was observed for the siRNA duplex in PBS. No melting transition was observed for the RNA sequences in water, which was similar to the data collected for the DOTAP-RNA mixture (Figure S1a). Thus, data demonstrate that DOTAP facilitates the assembly of ssRNA with TLPs.
DOTAP is required for the formation of stable siRNA-TLPs. Thus, we hypothesized that DOTAP neutralizes the negative charge of RNA for assembly with anionic TLPs. To this end, the zeta potential (ζ-potential) of solutions containing DOTAP, RNA, and DOTAP-RNA mixtures were measured in water. DOTAP:RNA molar ratios of 10:1, 20:1, 30:1, and 40:1 (charge ratios ~1:4, 2:1, 3:4, 1:1) were analyzed. Data show that, regardless of the molar ratio, DOTAP had a positive ζ-potential and free RNA had a negative ζ-potential. Surprisingly, all DOTAP-RNA mixtures were negative regardless of the DOTAP:RNA molar ratio (Figure S1b). Collectively, these data suggested that siRNA-TLP self-assembly results from DOTAP binding with TLPs that enables subsequent binding of DOTAP-RNA. To validate these assumptions, TLPs were formulated with DOTAP alone at concentrations consistent with the previously tested DOTAP-RNA molar ratios. Only TLPs mixed with DOTAP at the appropriate 30:1 or 40:1 concentration were stable to irreversible aggregation. ζ-potential measurements show that stable DOTAP-TLPs were positively charged (+31 and +34 mV, respectively), while all of the DOTAP-RNA mixtures, when added to TLPs, yielded negatively charged siRNA-TLPs (Figure 1b). Ultimately, the collective data showed that self-assembled siRNA-TLPs are stabilized, at least in part, by negatively charged RNA molecules at the particle surface. Dynamic light scattering measurements of each of the siRNA-TLPs demonstrated a progressive increase in size with increasing DOTAP:RNA molar ratio (Figure 1c). UV-Vis data supported that the progressive increase in siRNA-TLP size was due, at least in part, to increasing amounts of RNA, and that there is consistent RNA assembly with the TLPs for each of the DOTAP:RNA ratios and for each siRNA pair (Figure 1d).
2.3 TLPs are Required for In vitro Function of siRNA-TLPs
To measure siRNA-TLP function, we treated lymph node derived prostate cancer cells (LNCaP), known to express AR, with siRNA-TLPs made using each DOTAP:RNA molar ratio used above. Western blotting demonstrated that the most potent reduction in AR expression was achieved with the 40:1 siRNA-TLPs followed in step-wise order by the 30:1, 20:1, and 10:1 molar ratios (Figure 1e). As a critical control, because DOTAP has been employed as a nucleic acid transfection reagent,[37, 38] we explored if TLPs are required for siRNA-TLP function. Importantly, data showed that mixtures of DOTAP-RNA particles without TLPs (Figure S1c) did not function to knockdown target AR expression (Figure S1d). Next, the optimal RNA:TLP molar ratio was explored using the 40:1 and 30:1 DOTAP:RNA siRNA-TLPs. In all appropriate pairwise comparisons, UV-Vis data showed that the 40:1 DOTAP:RNA and the 25:1 RNA:TLP molar ratios were optimal for RNA assembly to siRNA-TLPs (Figure S1e). Treatment of LNCaP cells with each of the particles demonstrated dose-dependent reductions in AR expression consistent with the amount of RNA associated with TLPs (Figure S1f). In short, the self-assembly of siRNA-TLPs can be tailored to potently regulate target gene expression, and the optimal siRNA-TLP resulted from the use of 40:1 (DOTAP:RNA) and 25:1 (RNA:TLP) molar ratios, respectively.
2.4 Characterization of siRNA-TLPs
Multiple modalities were used to characterize optimized siRNA-TLPs. Fluorescently labeled apo A-I, cholesterol, DOPC, DOTAP, and RNA were used to quantify the amount of each of these molecules in siRNA-TLPs (Table 1). Of note, addition of the fluorescently labeled DOPC and cholesterol components did not change the size of the TLPs or siRNA-TLPs as measured with DLS (Figure S2a). However, a trend toward a reduction in siRNA-TLP size was observed when half of the RNA (sense strand) added to TLPs was labeled with a molecular fluorophore (Figure S2b). In addition, western blotting was performed to confirm apo A-I presence on the TLP and siRNA-TLP (Figure S3). Transmission electron microscopy (TEM) was used to obtain images of TLPs and siRNA-TLPs. As shown in Figure 2a, there is clear indication of TLP surface functionalization. TEM images of the siRNA-TLPs revealed spherical particles that show TLP self-assembly with solid structures made of DOTAP and RNA. Electron micrographs taken at lower magnification were used to measure the size of the TLPs and siRNA-TLPs, and correlate well with the values obtained using DLS (Figure S4). Further, because siRNA-TLPs are formulated with a mixture of ssRNAs, we sought to conclusively demonstrate that siRNA-TLPs incorporate and require each complement of the siRNA duplex for optimal function.[39, 40] Particles were synthesized with only the sense (S) or antisense (AS) RNA sequence of the siRNA pair and their function was compared to siRNA-TLPs synthesized with both sequences (DS). Only siRNA-TLPs synthesized with both sequences of the siRNA pair functioned to reduce AR expression (Figure 2b). In addition, we determined if function could be achieved by mixing siRNA-TLPs synthesized with only the S or AS RNA sequence. Ultimately, mixed siRNA-TLPs functioned similarly to siRNA-TLPs synthesized with both sequences (Figure 2c). These data support that optimal gene regulation requires delivery of both sequences of the siRNA pair, and that siRNA can be delivered as component single strands on a single or mixed population of siRNA-TLPs.
Table 1.
Molar ratio of each particle component in TLP and siRNA-TLP following purification and quantification.
| Component (M) : AuNP (M) | TLP | AR-TLP | Ctrl-TLP |
|---|---|---|---|
| apo A-I | 2 ± 1 | 2 ± 1 | 2 ± 1 |
| Cholesterol | 18 ± 10 | 14 ± 3 | 10 ± 3 |
| DOPC | 47 ± 10 | 48 ± 7 | 34 ± 8 |
| DOTAP | N/A | 969 ± 250 | 960 ± 61 |
| Sense Strand | N/A | 6 ± 1 | 5 ± 2 |
| Antisense Strand | N/A | 8 ± 3 | 8 ± 2 |
Figure 2.

siRNA-TLP characterization. (a) Transmission electron microscopy of TLP and siRNA-TLP. Scale bar = 50 nm. (b) Western blot of siRNA-TLPs function to regulate AR expression using particles synthesized with either the sense (S), antisense (AS), or both strands of the siRNA duplex pair (DS) in LNCaP cells (48 hrs). (c) Western blot of siRNA-TLPs function to regulate AR expression when formulated with either both RNA complements (DS) on a single siRNA-TLP, or a mixed population of AS and S siRNA-TLPs combined as a single treatment in LNCaP cells (48 hrs, 20 nM siRNA-TLP). AR = siRNA targeting the androgen receptor. Ctrl = scrambled control siRNA sequence. Lipo = Lipofectamine® RNAiMax.
2.5 In vitro Function and Modular Design of siRNA-TLPs
In vitro siRNA-TLP efficacy was determined over time. LNCaP cells were treated with siRNA-TLPs for 24, 48, 72, and 96 hours at Au NP concentrations of 20, 10, and 5 nM. Western blot data demonstrated that siRNA-TLPs reduced AR protein expression in a time and dose-dependent fashion (Figure 3a). In addition, siRNA-TLPs reduced AR mRNA expression measured using qRT-PCR (Figure S5a). In addition to LNCaP cells, AR targeted siRNA-TLPs were tested in a cell culture model of advanced prostate cancer known to be resistant to a common AR blocker, enzalutamide (MDV3100).[41] As in LNCaP cells, siRNA-TLPs reduced AR expression in dose response (Figure S5b).
Figure 3.
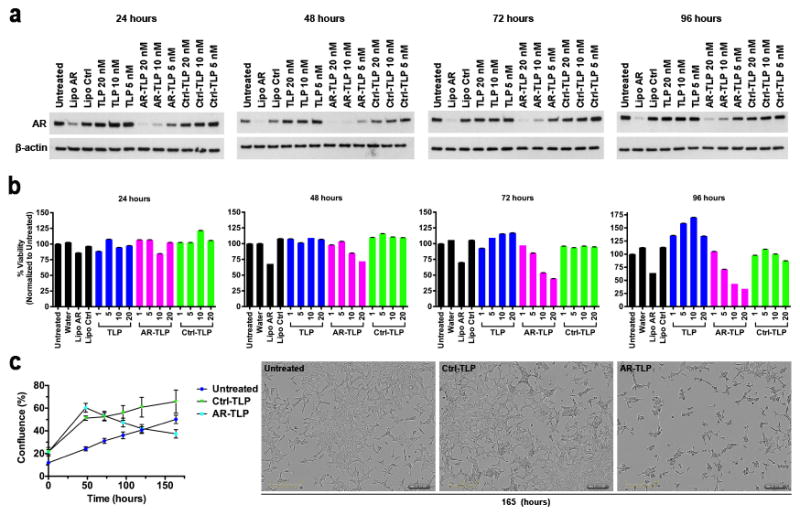
In vitro function of siRNA-TLP and cell viability. (a) Western blot time course of siRNA-TLP function regulating AR expression in LNCaP cells. (b) Cell viability of LNCaP cells after treatment with siRNA-TLPs measured by MTS assay (1, 5, 10, 20 nM siRNA-TLP). (c) LNCaP cell confluence measured over time after treatment with siRNA-TLPs (20 nM), and images taken 165 hours after siRNA-TLP treatment depicting cell confluence. AR = siRNA targeting the androgen receptor. Ctrl = scrambled control siRNA sequence. Lipo = Lipofectamine® RNAiMax.
The AR is important for prostate cancer cell survival.[42] Thus, LNCaP cell viability was tested after treatment with siRNA-TLPs. The AR siRNA-TLPs reduced LNCaP cell viability over time and with a clear dose-response (Figure 3b). Control siRNA-TLPs did not reduce cell viability demonstrating no apparent toxicity and siRNA specificity. In addition, serial images were collected over six days after cell treatment. Using imaging software and analysis, data showed that cell confluence was reduced in the presence of AR-TLPs over time, and images taken at 165 hours confirmed reduced cell confluence (Figure 3c).
Modular addition of desired siRNA sequences with TLPs would enable rapid and facile targeting of different proteins and protein variants relevant to cancer in individual patients. Thus, in addition to targeting AR, siRNA-TLPs targeting EZH2, a histone lysine N-methyltransferase enzyme, known for its oncogenic relevance in prostate cancer and other malignancies such as breast, renal, and ovarian cancers, were synthesized.[43–46] As previously demonstrated for Ctrl and AR sequences formulated with different DOTAP:RNA ratios, UV-Vis data demonstrated equivalent RNA assembly to EZH2-, AR-, and Ctrl-TLPs (Figure S5c). Data showed that siRNA-TLPs reduce EZH2 expression in LNCaP, enzalutamide resistant LNCaP cells, MDA-MB-231 (breast cancer), 786-O (renal cell carcinoma), and OvCar3 (ovarian cancer) in a dose-dependent fashion (Figure S5d).
2.6 Cellular Uptake and Active Targeting of siRNA-TLPs to SR-B1
Next, to study cellular internalization of siRNA-TLPs, LNCaP cells were treated with siRNA-TLPs synthesized with fluorophore-labeled RNA. Ctrl- (Movie S1) and AR-TLP (Movie S2) uptake and cell confluence were captured with imaging software after treating cells for 165 hours. Data showed an apparent two-phase uptake of siRNA-TLPs (Figure 4a and Figure S6a). Representative images of the second uptake phase are presented in Figure 4b.
Figure 4.
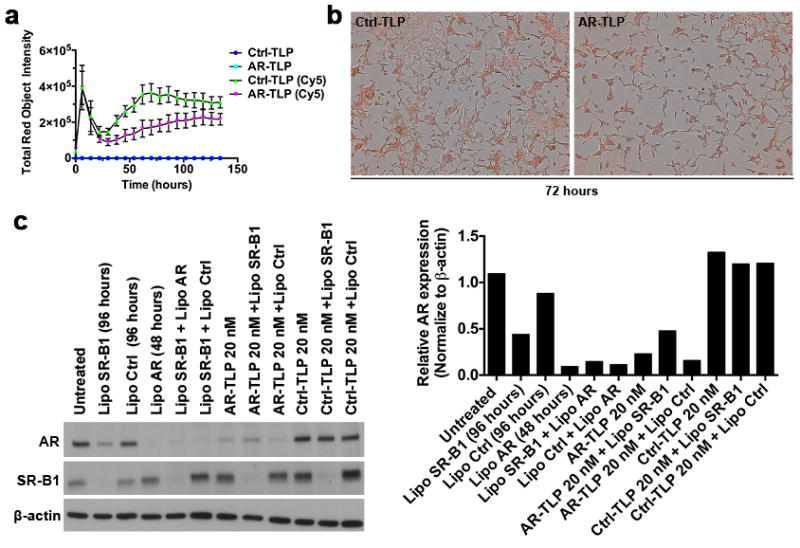
Cell uptake of siRNA-TLP and functional dependence on scavenger receptor type B-1 (SR-B1). (a) Cellular uptake of siRNA-TLP by LNCaP cells measured by fluorescent signal in cells over time using an Incucyte ZOOM (20 nM siRNA-TLP). (b) Representative fluorescent images of siRNA-TLP uptake (72 hrs). (c) Western blot of LNCaP cells pre-treated with SR-B1 and Ctrl siRNA 48 hrs prior to siRNA-TLPs addition to determine if function is dependent on cellular SR-B1 expression. The hours in parenthesis indicate the total treatment time of siRNA sequences added using Lipofectamine® RNAiMAX. LNCaP cells were treated with siRNA-TLPs for 48 hrs. Quantification of western blot data. AR = siRNA targeting the androgen receptor. Ctrl = scrambled control siRNA sequence. Lipo = Lipofectamine® RNAiMax.
To explore if the high-affinity HDL receptor, SR-B1, was required for siRNA-TLP function, western blotting was performed to confirm SR-B1 expression in all of the cultured cells used in this study (Figure S6b). Of note, human prostate cancer, breast cancer, and renal cell carcinoma, among others, have been shown to overexpress SR-B1.[24, 47–49] In LNCaP cells, optimal SR-B1 knockdown using conventional Lipofectamine® RNAiMax was tested in order to ensure maximal SR-B1 reduction at the time of siRNA-TLP addition (48 hours), and that SR-B1 knockdown was maintained for the duration of the experiment to subsequently test siRNA-TLP function (96 hours) (Figure S6c). Thus, conventional SR-B1 knockdown was performed in LNCaP cells followed by addition of siRNA-TLPs, or controls, targeting AR. Following treatments, data showed that conventional knockdown of SR-B1 partially reduces AR expression, which is a finding supported by the published literature but requires further study.[50, 51] Quantitative analysis showed that AR-TLPs added after SR-B1 knockdown do not function to reduce AR expression. On the other hand, conventional delivery of siRNA targeting AR functioned to reduce AR expression in the presence of SR-B1 knockdown (Figure 4c). These data clearly show that active targeting of SR-B1 is required for siRNA-TLP function.
2.7 Nuclease Stability of siRNA-TLPs
Natural HDLs stabilize RNA from nuclease degradation in blood and actively deliver RNA to target cells[13, 16]. To demonstrate the stability of RNA assembled in siRNA-TLPs, free siRNA and siRNA-TLPs were exposed to RNase A and human plasma. Gel electrophoresis was used to determine RNA stability. RNA assembled in siRNA-TLP was protected from degradation after exposure to RNase A (Figure 5a) and human plasma (Figure 5b). Further, we tested the function of siRNA-TLPs after incubation in human serum, and if siRNA-TLPs directly deliver RNA to target cells or if RNA is exchanged with native HDL in serum and indirectly delivered. See supporting information Figure S7 for experimental design. Treatment of LNCaP cells with siRNA-TLPs after incubation in human serum demonstrated reduced AR expression to the same level as siRNA-TLPs directly added to cultured cells. Native HDL isolated from serum after incubation with siRNA-TLPs had no effect on AR expression (Figure 5c). To supplement these experiments, we incubated siRNA-TLPs in human serum for 2, 4, 6, 10, and 24 hours at 37 °C. Serum incubated siRNA-TLP were then added to cultured LNCaP cells and AR expression was measure 48 hours later. Data show that the AR-TLPs continue to reduce AR expression after 10 hour incubation in serum (Figure S8). These data show that siRNA in siRNA-TLPs is highly stable to degradation and is directly delivered to target cells by siRNA-TLPs.
Figure 5.

Stability of RNA on siRNA-TLP and siRNA-TLP function after incubation in human serum. (a) RNA stability of siRNA-TLPs compared to free RNA sequences upon exposure to RNase A. (b) RNA stability of siRNA-TLPs compared to free RNA sequences after exposure to human plasma. (c) Western blot of AR protein expression after treatment of LNCaP cells with TLPs and siRNA-TLPs that have been incubated in human serum (48 hrs, 20 nM siRNA-TLP), and serum supernatant (SN) fraction containing only albumin and HDL separated from siRNA-TLPs. The particle type added to human serum is indicated in parenthesis. AR = siRNA targeting the androgen receptor. Ctrl = scrambled control siRNA sequence. Lipo = Lipofectamine® RNAiMax.
2.8 In vivo Efficacy of siRNA-TLPs
Next, the in vivo efficacy of siRNA-TLPs was investigated. Subcutaneous LNCaP xenografts were established in male nude mice. A total of thirteen treatments were administered via tail vein and tumor volumes were recorded over a 26-day period (Figure S9a). Mice treated with AR-TLPs (0.7 mg siRNA/kg) showed a significant reduction in tumor volume (Figure 6a) and percent change in tumor volume over time (Figure 6b). Targeted siRNA-TLP delivery to tumor tissue was assessed using inductively coupled plasmon mass spectrometry (ICP-MS) to quantify Au NPs, and confocal fluorescent microscopy to visualize RNA. ICP-MS data showed the presence of gold in tumor tissue after the treatment regimen (Figure 6c). Following a single dose of siRNA-TLPs synthesized with fluorescently labeled RNA [sense (Cy3) and antisense (Cy5)], tumor tissue was obtained 24 hours after the injection and confocal fluorescent microscopy confirmed RNA in tumor tissue (Figure 6d). Known consequences of systemic AR knockdown in mice include a reduction in hematocrit and neutrophils.[52] Indeed, a significant reduction in hematocrit (HCT) (Figure 6e), white blood cells (WBC) (Figure 6f), and neutrophils (Figure 6f) was measured in AR-TLP treated mice. Consistent with published literature,[52] no change in hemoglobin (HGB) or platelets (PLT) was measured (Figure 6e).
Figure 6.

In vivo function of siRNA-TLP. (a) Tumor volume measurements of LNCaP xenografts in athymic nude mice over course of in vivo study. (b) The percent change in LNCaP tumor volume over course of in vivo study. (c) Inductively coupled plasmon mass spectrometry to measure Au NPs in tissues after treatment with siRNA-TLP or water. (d) LNCaP tumor uptake of sense (Cy3) and antisense (Cy5) labeled siRNA sequences assembled with siRNA-TLPs following a single systemic administration. Labeled RNA was visualized using confocal fluorescence microscopy 24 hours after injection. Tumor tissues were counterstained with DAPI (blue). (e) Hematocrit (HCT), hemoglobin (HGB), and platelet (PLT) count in whole blood collected from study mice following treatment. (f) White blood cell (WBC) and neutrophil count from study mice following treatment. AR = siRNA targeting the androgen receptor. Ctrl = scrambled control siRNA sequence.
Body weights were maintained and consistent across all study groups (Figure S9b). To determine any off-target side effects, tissues obtained from representative organs were analyzed by hematoxylin and eosin (H&E) staining followed by microscopic examination, and standard serum parameters were measured. Data show no histopathologic changes in the examined organs (Figure S9c). No untoward alterations were observed in serum electrolyte or cholesterol levels and kidney function was normal (Figure S10a). In addition, markers of liver function were normal (Figure S10b). Ultimately, data collected in mice treated with water and Ctrl-TLPs revealed no side effects confirming a lack of toxicity of the vehicle and control RNA.
3. Conclusion
With a goal of synthesizing efficient in vitro and in vivo siRNA delivery vehicles, we adhered to a set of design rules that appear critical for native HDL to systemically deliver RNA, including: 1) Preference for ssRNA, 2) Charge reconciliation, and 3) Active targeting. Pre-synthesized TLPs, mimics of HDL, were incubated with a mixture of DOTAP and ssRNA. Resulting self-assembled siRNA-TLPs are a hybrid between bio-inspired lipoprotein nanoparticles and lipid-RNA structures. Uniquely, siRNA-TLPs are highly efficient siRNA delivery vehicles with a preference for ssRNA complements of an siRNA duplex pair. To our knowledge, this has not been reported. siRNA-TLPs are uniform and their synthesis and function are tailorable based upon the addition of TLP, RNA, and DOTAP. Data clearly show that the TLPs are required for siRNA-TLP self-assembly, active targeting, and function. Presumably, any siRNA duplex pair can be used for self-assembly of siRNA-TLPs, and the particles function to regulate target gene expression in multiple cancer cell types that express SR-B1. In vivo efficacy was achieved in a prostate cancer xenograft model suggesting translational potential. An every-other-day dosing regimen was used to establish proof-of-concept in vivo data; however, because the in vitro data demonstrated robust AR knockdown for up to 96 hours, further study is required to optimize the dose and dosing schedule. Also, the siRNA-TLPs contain a gold nanoparticle used to synthesize the TLPs. Gold is biocompatible, and our data demonstrate no off-target toxicity after thirteen intravenous doses of the siRNA-TLPs. Conceptually, the gold nanoparticle can be removed provided the formulation of the siRNA-TLPs is maintained and the particles target SR-B1 and we are exploring such materials.
Many groups are exploring opportunities that HDLs offer for the targeted systemic delivery of nucleic acids. Yet, approaches to develop synthetic versions of HDL are variable and design rules that enable RNA delivery by native or synthetic HDLs are not well understood. Importantly, native HDLs bind and deliver ssRNA.[13] This is at odds with the delivery of duplex siRNAs where most delivery strategies are focused. Our data support that formulating ssRNAs of a siRNA pair, either in individual or separate siRNA-TLPs, produce a robust reduction in target gene expression. As such, this work suggests that formulating ssRNA complements of a siRNA duplex is a viable approach for systemic siRNA delivery. Also, data show that miRNAs adsorbed to native HDLs localize to the particle surface.[13] Similarly, the siRNA-TLP is formed through a self-assembly process whereby RNA is localized to the particle surface versus encapsulated inside of a lipid or polymer particle. Ultimately, RNA localized to the surface of the siRNA-TLP remains stable and is efficiently delivered to cells for target gene knockdown. RNA stability may result from the anionic nature of the particle and/or because of the solid nature of the particle. Further, the function of siRNA-TLPs may be enhanced because the RNA is not encapsulated and is more freely available to the host cell. Finally, siRNA-TLPs are negatively charged and require the TLP for efficient siRNA delivery and knockdown of target gene expression. Particles made without the TLP, despite being similarly charged, do not function to regulate target gene expression. This finding suggests that anionic particles are, in fact, poor delivery vehicles for RNA unless the particle is inherently targeted or contains a moiety that productively facilitates target cell binding and RNA uptake into the cytoplasm. These findings, inspired by native HDL, may enable and inform new approaches for the development of potent and modular siRNA delivery vehicles, especially synthetic lipoproteins, for personalized medicine.
4. Experimental Section
Synthesis of Templated Lipoprotein Particles (TLP) and siRNA-TLPs
For TLP synthesis, an aqueous solution of citrate stabilized gold nanoparticles (Au NP) (80 nM, 5 ± 0.75 nm, Ted Pella, Inc.) was mixed with a 5-fold molar excess of purified human apoA-I (400 nM, Meridian Life Sciences, >95% pure by SDS PAGE) in a glass vial. The Au NP/ apo A-I mixture was incubated overnight at room temperature (RT) on a flat bottom shaker at low speed. Next, a 1:1 ratio of two phospholipids: 1,2-dipalmitoyl-sn-glycero-3-phosphoethanolamine-N-[3-(2-pyridyldithio)propionate] (PDP-PE) and 1,2-dioleoyl-sn-glycero-3-phophocholine (DOPC) (Avanti Polar Lipids), each dissolved in chloroform (CHCl3, 1 mM), are added to the Au NP/ apo A-I solution in 250-fold molar excess to the Au NP. PDP-PE was added first and the solution was vortexed prior to adding DOPC. Next, cholesterol dissolved in CHCl3 (1 mM, Sigma Aldrich) was added in 25-fold molar excess to the Au NP. The mixture was vortexed and briefly sonicated (~ 2 mins) causing the solution to become opaque and pink in color. The resulting mixture was gradually heated to ~65°C with constant stirring to evaporate CHCl3 and to transfer the phospholipids onto the particle surface and into the aqueous phase (~20 minutes). The reaction was complete when the solution returned to a transparent red color. The resultant TLPs were incubated overnight at RT and then purified via centrifugation (15,870 x g, 50 min). The supernatant was removed and the resulting purified and concentrated TLPs were combined into a single vial. TLPs were stored at 4°C until use. The concentration of the TLPs was measured using UV-Vis spectroscopy (Agilent 8453) where Au NPs have a characteristic absorption at λmax = 520 nm, and the extinction coefficient for 5 nm Au NPs is 9.696 × 10⁶ M−1cm−1.
To synthesize siRNA-TLP, RNA and 1,2-dioleoyl-3-trimethylammonium-propane (DOTAP) were first mixed. Individual sense and antisense RNA sequences of the AR, control (Ctrl), or EZH2 siRNA (Integrated DNA Technologies) were re-suspended in nuclease free water (500 μM, final). Complement pairs were then mixed in nuclease free water at a concentration enabling direct addition to TLPs (100 nM) at 25-fold molar excess of each RNA sequence (2.5 μM, final per RNA sequence). An ethanolic (EtOH) solution of DOTAP was then added to the RNA mixture to desired DOTAP:RNA molar ratios. In each case the resulting solvent ratio was 9:1, EtOH:water (v/v). The mixture of DOTAP and RNA was briefly sonicated and vortexed (x3) and then incubated at RT for 15 minutes prior to addition to a solution of TLPs in water. After the DOTAP-RNA mixture was added to the TLPs, the solvent mixture was 9:1, water:EtOH (v/v). This solution was incubated overnight at RT with gentle shaking on a flat bottom shaker at low speed. Resulting siRNA-TLPs were purified via centrifugation (15,870 x g, 50 min), the supernatant with unbound starting materials was removed, and the pellets were combined in a single tube to concentrate the siRNA-TLPs. The concentration of the siRNA-TLPs was calculated as described for TLP. For siRNA-TLPs, a strong absorption at λmax = 260 nm confirmed the presence of RNA. For particles synthesized with only one strand of the siRNA duplex pair, the synthetic procedure proceeded similarly; however, twice the amount of RNA was added to the TLPs (5 μM, final).
Single Vs Double Strand RNA assembly with DOTAP and TLPs
To investigate if single stranded RNA complements or double stranded siRNA duplexes assembled with TLPs, and the requirement for DOTAP, siRNA-TLPs were synthesized per the above protocol. However, the synthesis was carried out with and without DOTAP and using either water or 1X PBS as the aqueous solvent for siRNA-TLP assembly.
Thermal Denaturation Experiments
We performed thermal denaturation experiments to measure RNA melting transition temperatures (Tm) between 25°–90°C using an Agilent 8453 UV-Vis spectrophotometer equipped with a Peltier temperature controller. Solutions without RNA, but only with water, EtOH, water:EtOH (v/v), and/ or DOTAP had no appreciable absorbance at 260 nm (data not shown).
Quantification of RNA, apo A-I, DOTAP, DOPC and cholesterol
To confirm the presence of each of the molecules used to synthesize TLPs and siRNA-TLPs, and to quantify the amount present, we used molecules labeled with molecular fluorophores to synthesize TLPs and siRNA-TLPs according to the previously described synthetic method. After purification, we measured the amount of each of the fluorescent molecules with reference to standard titration curves developed with each of the fluorescently labeled molecules. More specifically, the number of RNA strands per siRNA-TLP was quantified by incorporating 3′ end-labeled (Cy5) RNA sequences. For Cy5, measurements were obtained using a Biotek Synergy 2 fluorescent plate reader using Ex = 620/40 nm and Em = 680/30 nm. Apo A-I on the particle surface was confirmed by western blotting. For quantification, apoA-I was labeled with Alexa-488 using a commercially available protein labeling kit (Invitrogen) according to the instruction provided by the manufacturer. Measurements were taken using a Biotek Synergy 2 fluorescent plate reader using Ex = 485/20 nm and Em = 528/20 nm. DOTAP, DOPC, and cholesterol were quantified by incorporating nitrobenzoxadiazole (NBD)-fluorescent analogs of each of the molecules (Avanti Polar Lipids) into the particle synthesis at a 10% dilution. All samples were measured in a 1:1 mixture of EtOH:water (v/v), including the standards. Measurements were taken using a Biotek Synergy 2 fluorescent plate reader using the same settings as for apo A-I measurements.
Dynamic light scattering and ζ-potential measurements
Hydrodynamic diameter and ζ-potential measurements were performed using TLP or siRNA-TLP in water (10 nM). Triplicate measurements were made under 173° backscatter setting with 10 runs, 30 sec/ run/ measurement. RNA and RNA-DOTAP mixtures were measured using a concentration of 5 μM RNA. Mixtures containing DOTAP were made where the final concentration of DOTAP = 100 μM, 75 μM, 50 μM, and 25μM to achieve the 40, 30, 20, 10 fold excesses to RNA, respectively. Particle free measurements were taken in 9:1 water:ethanol (v/v) solutions. Measurements were made using a Zetasizer Nano ZS (Malvern). The hydrodynamic diameter data are represented using the number function.
UV-Vis spectroscopy
A UV-Vis spectrophotometer (Agilent 8453) was used to measure the concentration and stability of NPs to aggregation, The concentration of solutions of Au NPs was determined by measuring the absorbance at ~520 nm (extinction coefficient 9.696 × 10⁶ M−1cm−1; Ted Pella). Disperse colloidal gold nanoparticles strongly absorb and scatter light at ~520 nm (Aλmax). The molar concentration of NPs in the preparations was calculated using the formula: (Aλmax × dilution factor) / 9.696 × 10⁶ M−1cm−1. UV-Vis spectrophotometry was also used to determine RNA loading using the strong absorbance of RNA at ~260 nm.
Cell culture
The human lymph node derived prostate cancer LNCaP clone FGC (fast growing colony), androgen receptor positive, androgen sensitive, was obtained from American Type Cell Culture (ATCC). LNCaP cells were grown in RPMI 1640 medium (Invitrogen), supplemented with 10% fetal bovine serum (FBS) and 1% penicillin/streptomycin (Invitrogen). The enzalutamide resistant LNCaP cell line (MDV3100) was a generous gift from Dr. Donald Vander Griend’s laboratory (University of Chicago). LNCaP MDV3100 resistant cells were cultured using the same conditions as LNCaP cells; however, 10 μM (final) MDV3100 was added to the growth medium. A375 cells (human malignant melanoma) and MDA-MB-231 cells (human triple negative breast cancer) were obtained from ATCC. Both cell lines were cultured in DMEM (Invitrogen), supplemented with 10% fetal bovine serum (FBS), 1% penicillin/streptomycin (Invitrogen), and 1X Glutamax. 786-O (human renal cell carcinoma) cells were obtained from ATCC and grown under the same conditions as the LNCaP cells. OvCar3 (human ovarian adenocarcinoma) cells were obtained from ATCC and cultured in RPMI 1640 medium (Invitrogen), supplemented with 10% FBS and 1% penicillin/streptomycin (Invitrogen), and 1% insulin. In general, cells were cultured in T75 flasks and plated into appropriate dishes (e.g. 6-well, 24-well, 96-well) 24–48 hours prior to experiments. All cells were incubated at 37°C in a humidified 5% CO2 incubator.
Conventional siRNA transfection
Prior to all cell transfections, the cell culture media was changed to fresh growth medium. TLPs or RNA-TLPs were directly added to the cultured cells. For comparisons against conventional transfection reagents, Lipofectamine® RNAiMax transfections were used to treat cells with Ctrl, AR, EZH2, or SR-B1 siRNAs according to the protocol provided by the manufacturer (Invitrogen). Briefly, siRNA was mixed with RNAiMax in OpitMEM media to achieve final concentrations of siRNA ranging from 6–12 nM. siRNA RNAiMAX transfections were optimized to achieve maximal target gene knockdown at 48 hours.
Western blotting
Cells were plated at 1.5×10⁵ cells/well for all western blotting experiments. Cells were harvested 48 hours following treatment unless otherwise specified. To harvest protein lysate, cells were washed in ice cold 1X PBS and lysed in M-PER (Mammalian Protein Extraction Reagent) supplemented with 1X protease and phosphatase inhibitors (Thermo Scientific). After protein isolation, the bicinchoninic acid assay (BCA) assay was used to quantify total protein. Protein absorbance was measured at 562 nm (BioTek, Synergy 2). Protein concentrations were normalized and then mixed with 4X Laemmli loading buffer containing β-mercaptoethanol (Bio-Rad) and boiled for 10 minutes at 100°C prior to gel loading. Cellular proteins were resolved by 4–20% SDS-PAGE (200 volts, 32 minutes) and transferred to a 0.2 μm PVDF membrane (65 volts, 1 hour) (Bio-Rad). Membranes were blocked in 5% milk in Tris buffered saline (TBS) and Tween-20 (0.1%) for 1 hour prior to antibody (Ab) addition. Membranes were incubated overnight at 4°C using rabbit polyclonal antibodies directed against androgen receptor (1:1000, Santa Cruz), beta actin (1:2000, Cell Signaling), EZH2 (1:1000, BD Biosciences), apo A-I (1:1000, Abcam), or SR-BI (1:2000, Abcam). Goat anti-rabbit or goat anti-mouse IgG-HRP (1:2000, Bio-Rad) were used as secondary antibodies. The secondary Ab was applied at RT for 30–60 minutes. Blots were washed (3x) in TBST (0.1% Tween-20) for 10 minutes/wash prior to protein detection. Proteins were detected using enhanced chemiluminescence (ECL) detection (GE Healthcare Life Sciences) on x-ray film using Konica SRX101A X-Ray Film Processor (MXR Source One Healthcare). Densitometry measurements for western blot analysis were made using ImageJ software.
Transmission electron microscopy
For images in Figure 2, a pair of tweezers was used to hold a 200 mesh carbon coated copper grid (Electron Microscopy Sciences) while a 5 μL drop of particles (250 nM) was pipetted onto the grid. The drop was allowed to adsorb to the grid for 10 minutes and the excess solution was wicked away with filter paper. Grids were stained with 5 μL of 4% uranyl acetate (UA) for three minutes. Excess UA was wicked off and the staining was repeated two times. The remaining UA was wicked off and the samples were allowed to dry for 10 minutes. For images in Figure S4, a pair of tweezers was used to hold a 200 mesh carbon coated copper grid (Electron Microscopy Sciences). An equal volume of particles (150 nM) and a 2% uranyl acetate solution were mixed and then 10 μL of this solution was added to the grid and allowed to sit for 20 seconds. The excess volume was removed with a piece of filter paper and the grid was allowed to dry. TEM images were taken with a FEI Tecnai Spirit G2 transmission electron microscope operating at 80 kV. In UA-stained samples, phospholipids are visible as white rings around the electron dense NP. Transmission electron microscopy images were analyzed using Nikon Elements Imaging Software to measure the size of TLP, Ctrl-TLP, and AR-TLP. The measurements were taken from three TEM images for each sample, combined, and plotted as histograms using GraphPad Prism.
Cell viability assay
Cells were plated at 3 × 10⁴ cells/well in 96-well plates 48 hours prior to particle treatment. LNCaP cells were treated with increasing concentrations of particles 1, 5, 10, 20 nM. Cell viability was measured at 24, 48, 72, 96 hours using CellTiter 96® AQueous One Solution Cell Proliferation Assay (Promega) according to the instructions provided by the manufacturer. Absorbance was measured at 490 nm (Biotek Synergy 2).
Real-time measurements of particle uptake and confluence
LNCaP cells were plated at 6 × 10⁴ cells/well in 96-well plates 48 hours prior to treatment. LNCaP cells were treated with 20 nM siRNA-TLPs (Ctrl and AR) where the RNA was labeled with Cy5 per the above protocol. Cell confluence and particle uptake were captured for 165 hours using an IncuCyte® Zoom system and software. Cy5 fluorescence was captured using light-emitting diodes with Ex = 585/20 nm and Em = 524/20 nm. The entire experiment was preformed at 37°C in a 5% CO2 humidified incubator. siRNA-TLP uptake was measured by fluorescent labeled (Cy5) RNA bound to the siRNA-TLPs.
Real-time qRT-PCR
Total RNA was isolated from LNCaP cells using RNeasy mini kit (Qiagen). Reverse transcription was preformed using 0.2 μg of RNA and TaqMan Reverse Transcription Kit following the protocol provided by Life Technologies. Real-time qRT-PCR was preformed using TaqMan PCR Master Mix and TaqMan androgen receptor (Catalog # Hs0171172_m1) and β-actin primers/probes for relative mRNA quantification (Life Technologies). qRT-PCR analysis was carried out using an ABI Prism Model 7900HT. Data was analyzed using the comparative Ct method using β-actin as an endogenous control.
Human serum and plasma isolation and lipoprotein depletion
Following IRB approval and informed consent, blood samples were collected via venipuncture from an antecubital vein from a healthy donor into a serum separator tube (Becton Dickinson). Serum was isolated by centrifugation (1,000 × g for 10 minutes) at 4°C. Serum was aliquoted (250 μL) and stored at −20°C prior to use. To generate serum depleted of lipoproteins other than HDL, serum was first mixed with a solution of polyethylene glycol [PEG8000, 20% (v/v) solution in 200 mM glycine, pH 7.4] at a 10:4 serum:PEG solution ratio. The sample was gently mixed and incubated at RT for 20 minutes. Next, the samples were centrifuged for 30 minutes (12,700 × g) at 4°C. The supernatant, consisting of albumin and HDL was set aside and the pellet was discarded. Human plasma samples were collected similarly to serum; however, blood was collected into heparinized tubes (Becton Dickinson) and then centrifuged for 15 minutes (2,000 × g) at 4°C. Resulting plasma was aliquoted (250 μL), used immediately, or stored at −20°C.
siRNA-TLP function and stability post serum incubation
TLPs and siRNA-TLPs were incubated with human serum for 1 hour at 37°C. To determine if siRNA exchanged to natural HDL after incubation, human HDL was separated from particles using the isolation assay described above. The albumin/human HDL mixture was directly added to plated LNCaP cells. See Supporting Figure S7 for experimental design. In addition, experiments were conducted by adding siRNA-TLPs to human serum, incubating for indicated time points at 37°C, and then directly added to cultured LNCaP cells for 48 hours. The LNCaP cells were then harvested for western blot.
Nuclease protection assay and siRNA-TLP stability
The stability of RNA in siRNA-TLPs was compared to free RNA in the presence of RNase A (Bio-Rad). siRNA-TLPs (~1 μM RNA) and free RNA sequences (1 μM) were exposed to 2.0 ng/μL RNase A for 0, 5, 15, 30, and 60 minutes at 37°C. Reactions were quenched by addition of 2X RNA loading buffer [90% formamide, 10% glycerol, 1% SDS (w/v), and bromophenol blue] and heated to 65°C for 3 minutes. Samples were transferred to a pre-run polyacrylamide gel (25% polyacrylamide with 5% stacking layer) and subjected to electrophoretic separation (400 volts for 30 minutes). The gel was stained with ethidium bromide and imaged using ChemiDoc System (Bio-Rad).
siRNA-TLP stability in human plasma
A Cy3 labeled RNA was used to measure the physiologic stability of the siRNA-TLP with comparison to free RNA sequences. siRNA-TLPs (400 nM siRNA-TLP, 1.6 μM RNA of each strand) and free RNA (1.6μM of each sequence) were exposed to 50% human plasma for 0, 5, 15, 30, and 60 minutes at 37°C. Reactions were quenched by the addition of 2X RNA loading buffer [90% formamide, 10% glycerol, 1% (SDS w/v), and bromophenol blue], and heated to 65°C for 3 minutes. The samples were transferred to a pre-run polyacrylamide gel and underwent electrophoresis. The gel consisted of 25% polyacrylamide with a 5% stacking layer and ran at room temperature at 400 V for 30 minutes. The Cy3-RNA was detected using a G:BOX Chemi XT4 Imager (Synoptics).
In vivo efficacy studies
All animal experiments were approved by the Institutional Animal Care and Use Committee (IACUC) of Northwestern University, and the studies were performed in accordance with institutional and national guidelines and regulations. LNCaP flank tumor xenografts were established in 6 to 8 week male athymic nude mice by subcutaneous implantation of 1 × 10⁶ cells. When tumors reached ~500 mm3, mice were randomized to three treatment groups (i.e. water, Ctrl-TLP, and AR-TLP), n = 8 mice/ group. Body weights were measured over the course of the study on a standard laboratory scale. Mice were treated every other day with Ctrl-TLPs or AR-TLPs (100 μL, 2 μM siRNA-TLP, ~0.7 mg siRNA/kg) or 100 μL of water for a total of 13 treatments. Treatments were administered via tail vein. When tumors reached ~2000 mm3 in the control groups the study was terminated. Whole blood was obtained by cardiac puncture and collected in heparinized blood collection tubes. Blood samples were separated and subjected to complete blood count and serum chemistry analysis. Tissues (liver, lung, kidney, spleen, heart, brain, adrenal, testes, small intestine, and tumor) were harvested for inductively coupled plasmon mass spectrometry (ICP-MS) and hematoxylin and eosin (H&E) analysis. Fresh tissue sections for ICP-MS were stored immediately at −80°C until prepped for ICP-MS analysis. ICP-MS analysis was conducted at the Chemistry of Life Processes Core Facility at Northwestern University after digestion of the tissues and Au NPs using strong acid. The amount of Au NPs was quantified with reference to calibrated additional standards. Tissues harvested for H&E were immediately fixed in 10% formalin in PBS. Within 48 hours the tissues were prepped for paraffin embedding and sectioning. Tissue sectioning and H&E staining was performed by the Mouse Histology and Phenotyping Laboratory (MHPL) at Northwestern University. Images of the H&E stained tissues were obtained using a Nikon Eclipse TE2000-U and SPOT imaging software. All images were obtained at 10X magnification.
Tumor volume measurements, blood analysis, and serum chemistry
Tumors were measured using digital calipers over the course of the experiment. The volume was calculated using the equation [Volume = length × width2 / 2)].[53] Whole blood collected at time of sacrifice was analyzed for complete blood cell counts using a Hemavet 950FS (Drew Scientific). Plasma was obtained from an aliquot of whole blood and a complete chemistry panel, cholesterol, and liver function analysis was preformed by Charles River.
Confocal fluorescence microscopy of tumor tissues
AR-TLP and Ctrl-TLP were synthesized with Cy3-labeled sense RNA and Cy5-labeled antisense RNA according to the protocol described above. Mice with established LNCaP xenografts (~2000 mm3) (see above) were treated with a single tail vein injection of 100 μL of 2 μM (siRNA-TLP) AR-TLP-Cy3/5 or Ctrl-TLP-Cy3/5, or 100 μL of water. Mice were sacrificed 24 hours following the injection and LNCaP xenograft tumors were harvested and then embedded in optimal cutting temperature (O.C.T) matrix and immediately frozen on a block of dry ice. Tissues were sectioned (10 μm), mounted on glass slides, and counterstained with DAPI diluted (1:50,000) in 1X PBS. Fluoromount-G (Southern Biotech) mounting media and coverslips were applied prior to imaging. Images were acquired using a Nikon C2+ laser scanning confocal microscope (Northwestern University Center for Advanced Microscopy) and analyzed by Nikon Elements software and ImageJ. Images were taken at 60X magnification. Laser settings were consistent across samples.
Statistical analysis
Data are expressed as means ± standard deviation. Blood cell count comparison analyses were performed using unpaired two-tailed t-test with Welch’s correction using GraphPad Prism software. An effects model was used to compare changes in tumor volume over time within groups and changes between groups. Group and time were fixed effects and animal was a random effect. The model took into account the repeated measures across animals. Post-hoc comparisons were done using Tukey’s method. Statistical significance was considered significant for P ≤ 0.05; * denotes P ≤ 0.05, ** P ≤ 0.01, ** P ≤ 0.001, **** P ≤ 0.0001.
Supplementary Material
Acknowledgments
C.S.T. would like to thank the Department of Defense/Air Force Office of Scientific Research (FA95501310192) for grant funding, and grant funding from the National Institutes of Health/National Cancer Institute (U54CA151880 and R01CA167041). K.M.M acknowledges the Ryan Family, the Malkin Family, the Driskill Family, and Chicago Baseball Charities Cancer Fellowship for financial and fellowship support. K.M.M acknowledges fellowship support from the T32 Carcinogenesis training grant (T32CA09560). The authors acknowledge Dr. Fred W. Rademaker for assistance with statistics. Imaging work was performed at the Northwestern University Center for Advanced Microscopy generously supported by NCI CCSG P30 CA060553 awarded to the Robert H. Lurie Comprehensive Cancer Center.
Footnotes
The supporting information is available from Wiley Online Library or from the author.
Contributor Information
Dr. Kaylin M. McMahon, Department of Urology, Feinberg School of Medicine, Northwestern University, 303 East Chicago Avenue, Chicago, IL 60611, USA
Michael P. Plebanek, Department of Urology, Feinberg School of Medicine, Northwestern University, 303 East Chicago Avenue, Chicago, IL 60611, USA. Walter S. and Lucienne Driskill Graduate Training Program in Life Sciences, Northwestern University, 303 E. Chicago Avenue, Chicago, IL 60611, USA
Prof. C. Shad Thaxton, Department of Urology, Feinberg School of Medicine, Northwestern University, 303 East Chicago Avenue, Chicago, IL 60611, USA. Simpson Querrey Institute (SQI) for BioNanotechnology, Northwestern University, 303 East Superior, Chicago, IL 60611, USA. Robert H. Lurie Comprehensive Cancer Center, Northwestern University, 303 East Superior, Chicago, IL 60611, USA. International Institute for Nanotechnology, Northwestern University, 2145 Sheridan Road, Evanston, IL 60208, USA
References
- 1.Wu SY, Lopez-Berestein G, Calin GA, Sood AK. Science translational medicine. 2014;6:240ps7. doi: 10.1126/scitranslmed.3008362. [DOI] [PMC free article] [PubMed] [Google Scholar]
- 2.Whitehead KA, Langer R, Anderson DG. Nature reviews Drug discovery. 2009;8:129. doi: 10.1038/nrd2742. [DOI] [PMC free article] [PubMed] [Google Scholar]
- 3.Zuckerman JE, Davis ME. Nature reviews Drug discovery. 2015;14:843. doi: 10.1038/nrd4685. [DOI] [PubMed] [Google Scholar]
- 4.Choi YS, Lee MY, David AE, Park YS. Mol Cell Toxicol. 2014;10:1. [Google Scholar]
- 5.Nguyen T, Menocal EM, Harborth J, Fruehauf JH. Curr Opin Mol Ther. 2008;10:158. [PubMed] [Google Scholar]
- 6.Singh MS, Peer D. Curr Opin Biotechnol. 2016;39:28. doi: 10.1016/j.copbio.2015.12.011. [DOI] [PubMed] [Google Scholar]
- 7.Cheng Z, Al Zaki A, Hui JZ, Muzykantov VR, Tsourkas A. Science. 2012;338:903. doi: 10.1126/science.1226338. [DOI] [PMC free article] [PubMed] [Google Scholar]
- 8.McMahon KM, Thaxton CS. Expert opinion on drug delivery. 2014;11:231. doi: 10.1517/17425247.2014.866089. [DOI] [PMC free article] [PubMed] [Google Scholar]
- 9.Zhang S, Zhao B, Jiang H, Wang B, Ma B. Journal of controlled release : official journal of the Controlled Release Society. 2007;123:1. doi: 10.1016/j.jconrel.2007.07.016. [DOI] [PubMed] [Google Scholar]
- 10.Dong Y, Love KT, Dorkin JR, Sirirungruang S, Zhang Y, Chen D, Bogorad RL, Yin H, Chen Y, Vegas AJ, Alabi CA, Sahay G, Olejnik KT, Wang W, Schroeder A, Lytton-Jean AK, Siegwart DJ, Akinc A, Barnes C, Barros SA, Carioto M, Fitzgerald K, Hettinger J, Kumar V, Novobrantseva TI, Qin J, Querbes W, Koteliansky V, Langer R, Anderson DG. Proceedings of the National Academy of Sciences of the United States of America. 2014;111:3955. doi: 10.1073/pnas.1322937111. [DOI] [PMC free article] [PubMed] [Google Scholar]
- 11.Lv H, Zhang S, Wang B, Cui S, Yan J. Journal of controlled release : official journal of the Controlled Release Society. 2006;114:100. doi: 10.1016/j.jconrel.2006.04.014. [DOI] [PubMed] [Google Scholar]
- 12.Yang JP, Huang L. Gene Ther. 1997;4:950. doi: 10.1038/sj.gt.3300485. [DOI] [PubMed] [Google Scholar]
- 13.Vickers KC, Palmisano BT, Shoucri BM, Shamburek RD, Remaley AT. Nat Cell Biol. 2011;13:423. doi: 10.1038/ncb2210. [DOI] [PMC free article] [PubMed] [Google Scholar]
- 14.Tabet F, Vickers KC, Cuesta Torres LF, Wiese CB, Shoucri BM, Lambert G, Catherinet C, Prado-Lourenco L, Levin MG, Thacker S, Sethupathy P, Barter PJ, Remaley AT, Rye KA. Nature communications. 2014;5:3292. doi: 10.1038/ncomms4292. [DOI] [PMC free article] [PubMed] [Google Scholar]
- 15.Acton S, Rigotti A, Landschulz KT, Xu S, Hobbs HH, Krieger M. Science. 1996;271:518. doi: 10.1126/science.271.5248.518. [DOI] [PubMed] [Google Scholar]
- 16.Wolfrum C, Shi S, Jayaprakash KN, Jayaraman M, Wang G, Pandey RK, Rajeev KG, Nakayama T, Charrise K, Ndungo EM, Zimmermann T, Koteliansky V, Manoharan M, Stoffel M. Nature biotechnology. 2007;25:1149. doi: 10.1038/nbt1339. [DOI] [PubMed] [Google Scholar]
- 17.Douam F, Lavillette D, Cosset FL. Prog Mol Biol Transl Sci. 2015;129:63. doi: 10.1016/bs.pmbts.2014.10.003. [DOI] [PubMed] [Google Scholar]
- 18.Plebanek MP, Mutharasan RK, Volpert O, Matov A, Gatlin JC, Thaxton CS. Sci Rep. 2015;5:15724. doi: 10.1038/srep15724. [DOI] [PMC free article] [PubMed] [Google Scholar]
- 19.Van Eck M, Hoekstra M, Out R, Bos IS, Kruijt JK, Hildebrand RB, Van Berkel TJ. Journal of lipid research. 2008;49:136. doi: 10.1194/jlr.M700355-JLR200. [DOI] [PubMed] [Google Scholar]
- 20.Thaxton CS, Daniel WL, Giljohann DA, Thomas AD, Mirkin CA. Journal of the American Chemical Society. 2009;131:1384. doi: 10.1021/ja808856z. [DOI] [PMC free article] [PubMed] [Google Scholar]
- 21.Luthi AJ, Lyssenko NN, Quach D, McMahon KM, Millar JS, Vickers KC, Rader DJ, Phillips MC, Mirkin CA, Thaxton CS. Journal of lipid research. 2015;56:972. doi: 10.1194/jlr.M054635. [DOI] [PMC free article] [PubMed] [Google Scholar]
- 22.McMahon KM, Mutharasan RK, Tripathy S, Veliceasa D, Bobeica M, Shumaker DK, Luthi AJ, Helfand BT, Ardehali H, Mirkin CA, Volpert O, Thaxton CS. Nano letters. 2011;11:1208. doi: 10.1021/nl1041947. [DOI] [PMC free article] [PubMed] [Google Scholar]
- 23.Zhang Z, Chen J, Ding L, Jin H, Lovell JF, Corbin IR, Cao W, Lo PC, Yang M, Tsao MS, Luo Q, Zheng G. Small. 2010;6:430. doi: 10.1002/smll.200901515. [DOI] [PubMed] [Google Scholar]
- 24.Shahzad MM, Mangala LS, Han HD, Lu C, Bottsford-Miller J, Nishimura M, Mora EM, Lee JW, Stone RL, Pecot CV, Thanapprapasr D, Roh JW, Gaur P, Nair MP, Park YY, Sabnis N, Deavers MT, Lee JS, Ellis LM, Lopez-Berestein G, McConathy WJ, Prokai L, Lacko AG, Sood AK. Neoplasia. 2011;13:309. doi: 10.1593/neo.101372. [DOI] [PMC free article] [PubMed] [Google Scholar]
- 25.Ding Y, Wang W, Feng M, Wang Y, Zhou J, Ding X, Zhou X, Liu C, Wang R, Zhang Q. Biomaterials. 2012;33:8893. doi: 10.1016/j.biomaterials.2012.08.057. [DOI] [PubMed] [Google Scholar]
- 26.Nakayama T, Butler JS, Sehgal A, Severgnini M, Racie T, Sharman J, Ding F, Morskaya SS, Brodsky J, Tchangov L, Kosovrasti V, Meys M, Nechev L, Wang G, Peng CG, Fang Y, Maier M, Rajeev KG, Li R, Hettinger J, Barros S, Clausen V, Zhang X, Wang Q, Hutabarat R, Dokholyan NV, Wolfrum C, Manoharan M, Kotelianski V, Stoffel M, Sah DW. Molecular therapy : the journal of the American Society of Gene Therapy. 2012;20:1582. doi: 10.1038/mt.2012.33. [DOI] [PMC free article] [PubMed] [Google Scholar]
- 27.Ghosh M, Ren G, Simonsen JB, Ryan RO. Biochem Cell Biol. 2014;92:200. doi: 10.1139/bcb-2014-0027. [DOI] [PMC free article] [PubMed] [Google Scholar]
- 28.Tripathy S, Vinokour E, McMahon KM, Volpert OV, Thaxton CS. Particle & Particle Systems Characterization. 2014. [DOI] [PMC free article] [PubMed] [Google Scholar]
- 29.Mei X, Atkinson D. Arch Med Res. 2015;46:351. doi: 10.1016/j.arcmed.2015.05.012. [DOI] [PMC free article] [PubMed] [Google Scholar]
- 30.Maksymovych P, Sorescu DC, Yates JT., Jr Phys Rev Lett. 2006;97:146103. doi: 10.1103/PhysRevLett.97.146103. [DOI] [PubMed] [Google Scholar]
- 31.Sun W, Kewalramani S, Hujsak K, Zhang H, Bedzyk MJ, Dravid VP, Thaxton CS. Langmuir : the ACS journal of surfaces and colloids. 2015;31:3232. doi: 10.1021/la504822q. [DOI] [PubMed] [Google Scholar]
- 32.Cheng X, Lee RJ. Advanced drug delivery reviews. 2016;99:129. doi: 10.1016/j.addr.2016.01.022. [DOI] [PubMed] [Google Scholar]
- 33.Bergerat JP, Ceraline J. Hum Mutat. 2009;30:145. doi: 10.1002/humu.20848. [DOI] [PubMed] [Google Scholar]
- 34.Green SM, Mostaghel EA, Nelson PS. Mol Cell Endocrinol. 2012;360:3. doi: 10.1016/j.mce.2011.09.046. [DOI] [PMC free article] [PubMed] [Google Scholar]
- 35.Suga K, Tanabe T, Tomita H, Shimanouchi T, Umakoshi H. Nucleic Acids Res. 2011;39:8891. doi: 10.1093/nar/gkr568. [DOI] [PMC free article] [PubMed] [Google Scholar]
- 36.Daniel MC, Astruc D. Chemical reviews. 2004;104:293. doi: 10.1021/cr030698+. [DOI] [PubMed] [Google Scholar]
- 37.Sioud M, Sorensen DR. Biochem Biophys Res Commun. 2003;312:1220. doi: 10.1016/j.bbrc.2003.11.057. [DOI] [PubMed] [Google Scholar]
- 38.Sorensen DR, Leirdal M, Sioud M. J Mol Biol. 2003;327:761. doi: 10.1016/s0022-2836(03)00181-5. [DOI] [PubMed] [Google Scholar]
- 39.Fire AZ. Angewandte Chemie. 2007;46:6966. doi: 10.1002/anie.200701979. [DOI] [PubMed] [Google Scholar]
- 40.Fire A, Xu S, Montgomery MK, Kostas SA, Driver SE, Mello CC. Nature. 1998;391:806. doi: 10.1038/35888. [DOI] [PubMed] [Google Scholar]
- 41.Schalken J, Fitzpatrick JM. BJU Int. 2016;117:215. doi: 10.1111/bju.13123. [DOI] [PMC free article] [PubMed] [Google Scholar]
- 42.Chatterjee B. Mol Cell Biochem. 2003;253:89. doi: 10.1023/a:1026057402945. [DOI] [PubMed] [Google Scholar]
- 43.Rao ZY, Cai MY, Yang GF, He LR, Mai SJ, Hua WF, Liao YJ, Deng HX, Chen YC, Guan XY, Zeng YX, Kung HF, Xie D. Carcinogenesis. 2010;31:1576. doi: 10.1093/carcin/bgq150. [DOI] [PubMed] [Google Scholar]
- 44.Yang YA, Yu J. Protein Cell. 2013;4:331. doi: 10.1007/s13238-013-2093-2. [DOI] [PMC free article] [PubMed] [Google Scholar]
- 45.Wang Y, Chen Y, Geng H, Qi C, Liu Y, Yue D. Tumour Biol. 2015;36:7159. doi: 10.1007/s13277-015-3417-z. [DOI] [PubMed] [Google Scholar]
- 46.Yoo KH, Hennighausen L. Int J Biol Sci. 2012;8:59. doi: 10.7150/ijbs.8.59. [DOI] [PMC free article] [PubMed] [Google Scholar]
- 47.Purdue MP, Johansson M, Zelenika D, Toro JR, Scelo G, Moore LE, Prokhortchouk E, Wu X, Kiemeney LA, Gaborieau V, Jacobs KB, Chow WH, Zaridze D, Matveev V, Lubinski J, Trubicka J, Szeszenia-Dabrowska N, Lissowska J, Rudnai P, Fabianova E, Bucur A, Bencko V, Foretova L, Janout V, Boffetta P, Colt JS, Davis FG, Schwartz KL, Banks RE, Selby PJ, Harnden P, Berg CD, Hsing AW, Grubb RL, 3rd, Boeing H, Vineis P, Clavel-Chapelon F, Palli D, Tumino R, Krogh V, Panico S, Duell EJ, Quiros JR, Sanchez MJ, Navarro C, Ardanaz E, Dorronsoro M, Khaw KT, Allen NE, Bueno-de-Mesquita HB, Peeters PH, Trichopoulos D, Linseisen J, Ljungberg B, Overvad K, Tjonneland A, Romieu I, Riboli E, Mukeria A, Shangina O, Stevens VL, Thun MJ, Diver WR, Gapstur SM, Pharoah PD, Easton DF, Albanes D, Weinstein SJ, Virtamo J, Vatten L, Hveem K, Njolstad I, Tell GS, Stoltenberg C, Kumar R, Koppova K, Cussenot O, Benhamou S, Oosterwijk E, Vermeulen SH, Aben KK, van der Marel SL, Ye Y, Wood CG, Pu X, Mazur AM, Boulygina ES, Chekanov NN, Foglio M, Lechner D, Gut I, Heath S, Blanche H, Hutchinson A, Thomas G, Wang Z, Yeager M, Fraumeni JF, Jr, Skryabin KG, McKay JD, Rothman N, Chanock SJ, Lathrop M, Brennan P. Nat Genet. 2011;43:60. doi: 10.1038/ng.723. [DOI] [PMC free article] [PubMed] [Google Scholar]
- 48.de Gonzalo-Calvo D, Lopez-Vilaro L, Nasarre L, Perez-Olabarria M, Vazquez T, Escuin D, Badimon L, Barnadas A, Lerma E, Llorente-Cortes V. BMC Cancer. 2015;15:460. doi: 10.1186/s12885-015-1469-5. [DOI] [PMC free article] [PubMed] [Google Scholar]
- 49.Schorghofer D, Kinslechner K, Preitschopf A, Schutz B, Rohrl C, Hengstschlager M, Stangl H, Mikula M. Reprod Biol Endocrinol. 2015;13:88. doi: 10.1186/s12958-015-0087-z. [DOI] [PMC free article] [PubMed] [Google Scholar]
- 50.Twiddy AL, Cox ME, Wasan KM. Prostate. 2012;72:955. doi: 10.1002/pros.21499. [DOI] [PubMed] [Google Scholar]
- 51.Krycer JR, Brown AJ. PLoS One. 2013;8:e54007. doi: 10.1371/journal.pone.0054007. [DOI] [PMC free article] [PubMed] [Google Scholar]
- 52.Chuang KH, Altuwaijri S, Li G, Lai JJ, Chu CY, Lai KP, Lin HY, Hsu JW, Keng P, Wu MC, Chang C. J Exp Med. 2009;206:1181. doi: 10.1084/jem.20082521. [DOI] [PMC free article] [PubMed] [Google Scholar]
- 53.Brodin NP, Tang J, Skalina K, Quinn TJ, Basu I, Guha C, Tome WA. Br J Radiol. 2015;88:20140776. doi: 10.1259/bjr.20140776. [DOI] [PMC free article] [PubMed] [Google Scholar]
Associated Data
This section collects any data citations, data availability statements, or supplementary materials included in this article.