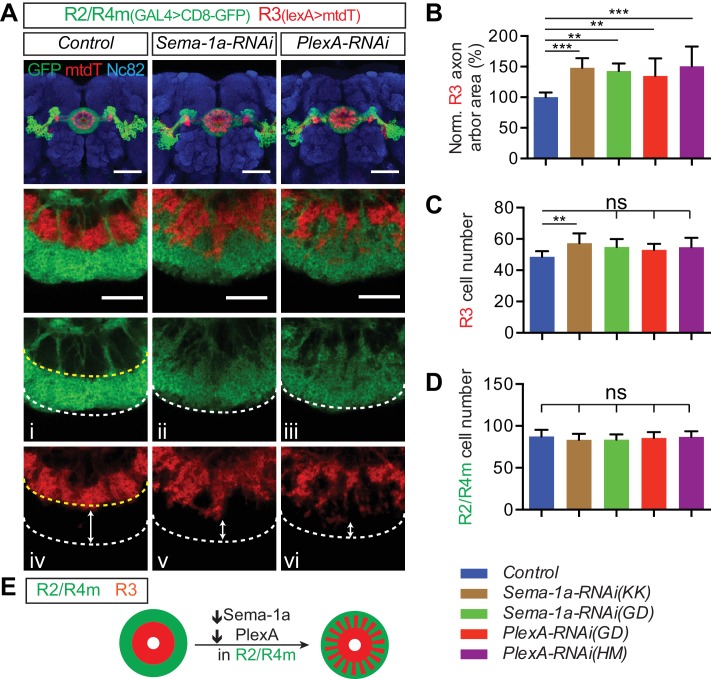
Figure 5. Sema-1a and PlexA are required in R2/R4m neurons to constrain R axon growth within the ellipsoid body.
(A–D) R2/R4m neurons were labeled by R32H08-GAL4-driving CD8-GFP, while R3 axons were labeled using R54B05-lexA-driving mtdTomato (mtdT) in adult fly brains. Knocking down Sema-1a or PlexA in R2/R4m neurons did not change axon trajectory or cell numbers of either R3 or R2/R4m (panels C and D), but resulted in non-cell autonomous R3 axon arbor expansion in the EB (panel B). Seven to eight brains for each genotype were used for quantification. ‘ns’ p>0.1234; *p<0.0332; **p<0.0021; ***p<0.0002. See Figure 5—source data 1 for detailed statistical analyses. (E) Schematics showing that both R3 (red) and R2/R4m (green) axons expand when Sema-1a or PlexA is down-regulated in R2/R4m, leading to intermingled R3 and R2/R4m axons. Scale bars are 50 μm in low-magnification images in top panels and 20 μm in high-magnification images in other panels.
DOI: http://dx.doi.org/10.7554/eLife.25328.015


