

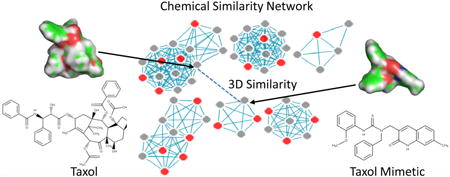
Abstract
Target identification remains a major challenge for modern drug discovery programs aimed at understanding the molecular mechanisms of drugs. Computational target prediction approaches like 2D chemical similarity searches have been widely used but are limited to structures sharing high chemical similarity. Here, we present a new computational approach called chemical similarity network analysis pull-down 3D (CSNAP3D) that combines 3D chemical similarity metrics and network algorithms for structure-based drug target profiling, ligand deorphanization, and automated identification of scaffold hopping compounds. In conjunction with 2D chemical similarity fingerprints, CSNAP3D achieved a >95% success rate in correctly predicting the drug targets of 206 known drugs. Significant improvement in target prediction was observed for HIV reverse transcriptase (HIVRT) compounds, which consist of diverse scaffold hopping compounds targeting the nucleotidyltransferase binding site. CSNAP3D was further applied to a set of antimitotic compounds identified in a cell-based chemical screen and identified novel small molecules that share a pharmacophore with Taxol and display a Taxol-like mechanism of action, which were validated experimentally using in vitro microtubule polymerization assays and cell-based assays.
Graphical abstract
Modern drug discovery often involves screening large compound libraries to identify hits that induce desired phenotypic effects in cell culture or animal models.1,2 In contrast to reverse target screening, which often necessitates a well-defined molecular target, the phenotype-based or cell-based chemical screen has no such restriction.3 Forward chemical screens can often be used to identify small molecules that modulate a wide range of intractable diseases like cancer and diabetes as well as aging, where modulating multiple targets in a complex disease network is required.2,4,5 However, the binding mechanisms of the identified molecules are often unknown, and determining their underlying molecular targets has become an integral part of the drug discovery process. Current experimental target identification approaches like chemical proteomics or haploinsufficiency assays can rarely achieve large-scale drug target profiling, mainly due to disproportionate protein abundances, weak target binding affinities, and low phenotypic penetrance.6,7 As a result, the development of in silico drug target profiling approaches that can effectively prioritize putative on and off targets for experimental validation will be critical for the success of current and future drug discovery programs.
In silico target fishing methods can be classified as profile-based, structure-based, or ligand-based approaches.1 Currently, ligand-based approaches remain the de facto standard for computational target prediction, as this approach does not depend on the availability of protein structures, prior experimental measurements, or computational training requirements. The rationale behind ligand-based approaches is the chemical similarity principle, which asserts that structurally similar compounds often share similar bioactivities.8 To compare chemical similarity between compounds, each molecule is encoded as a substructure fingerprint, and the degree of similarity is quantified by shared bits using a Tanimoto index.8 To predict the drug targets for the query ligands, the compounds are used to search the bioactivity databases, and putative drug targets are inferred from annotated ligands in the database that share the highest chemical similarity to the query ligand. One widely used ligand-based approach is SEA (Similarity Ensemble Approach), which applies a BLASTlike statistical score to identify targets from annotated ligands relative to a random background.9
We recently developed a new computational approach termed CSNAP (chemical similarity network analysis pulldown) for drug target profiling using chemical similarity networks.10 In contrast to traditional ligand-based approaches, CSNAP classified query and annotated ligands from the ChEMBL database into subnetworks of compounds sharing common chemical scaffolds known as chemotypes. A network-based scoring function, similar to that used for protein function prediction in protein–protein interaction (PPI) networks, was used to predict the drug targets for query compounds within the network based on its network environment and connectivity.11 Specifically, we applied a consensus statistic (S-score) to identify the most common drug targets in the first-order neighbor of each query compound in the CSNAP network. Our validation study showed that network-based target prediction was potentially more effective and could circumvent the limitations of on- and off-target profiling found in conventional ligand-based target prediction approaches. We further highlighted the utility of the CSNAP approach by using it to profile the drug targets of compounds identified in a cell-based screen and identified several novel mitotic targets not previously associated with mitotic progression.2,10
However, one of the major challenges in ligand-based drug target prediction is to deorphanize novel compounds, particularly those ligands with unknown binding partners that normally share low chemical similarity to existing small molecules in bioactivity databases. Consequently, these orphan compounds do not conform to an existing structure–activity relationship (SAR), and their targets cannot be predicted by simple similarity comparisons. Although several approaches including 2D/3D pharmacophore and shape- and property-based target predictions have been proposed to address this limitation, many of these methods cannot fully capture the essential structural features of protein-ligand interactions and are not suitable for large-scale target predictions (Supporting Information Text S1).
Here, we describe a new shape-based similarity network approach for large-scale drug target inference called CSNAP3D. Although orphan ligands can potentially interact with novel receptor pockets and their targets are difficult to predict computationally, recent studies indicate that structurally distinct compounds are capable of interacting with the receptors of known ligands with which they share a similar 3D environment, known as “scaffold hopping.”12,13 This concept has been widely applied in lead generation and drug discovery but can similarly be used to improve target prediction based on the 3D structural similarity of compounds. First, we performed an unbiased computational screen of 28 3D chemical similarity metrics to identify the optimal chemical descriptors for 3D similarity comparison. We showed that 3D similarity metrics based on a combination of shape and pharmacophore scoring provided the strongest improvement in target prediction compared to those based on shape or pharmacophore scoring alone. To this end, we developed the ShapeAlign protocol, which can be used to identify scaffold hopping compounds using shape alignment followed by a combination of shape, pharmacophore, and 2D similarity scoring. In our validation study, CSNAP3D achieved a high true positive prediction rate of up to 95% for six labeled targets using a benchmark set of 206 compounds. Significant improvement in target prediction was observed for HIV reverse transcriptase (HIVRT) inhibitors, a challenging drug class consisting of diverse chemical structures that are scaffold hopping compounds targeting the nucleotidyltransferase binding site. To test the utility of this approach, we performed CSNAP3D analyses of novel antimitotic compounds and identified several low molecular weight microtubule-stabilizing agents that mimic the Taxol binding mode and exhibit anticancer activity. The Taxol-like mechanism of these compounds was validated experimentally using in vitro microtubule polymerization assays and cell-based assays.
Results and Discussion
Unbiased Computational Screen of 3D Similarity Metrics
To identify the optimal 3D similarity metrics for ligand structure comparison, we performed an unbiased screen of 28 3D similarity scoring functions generated by three popular 3D similarity comparison programs (Shape-it, Align-it, and ROCS).14-16 These programs aligned molecules based on either molecular shape (Shape-it and ROCS) or pharmacophore (Align-it) features using a Gaussian-like function, and the ligand alignments were scored using 28 diverse 3D similarity metrics. The 28 3D similarity metrics were selected based on molecular shape, pharmacophore, or a combination of shape and pharmacophore as well as how these 3D properties compared between two aligned ligands. 3D shape similarity metrics were determined by the percentage of overlapped molecular volume between two aligned molecules using 3D Tanimoto index, Tversky index, or maximum overlapped volume. On the other hand, pharmacophore similarity metrics were defined by chemical matching of atomic pairs including hydrogen donors, hydrogen receptors, lipophilic and aromatic centers, as well as atomic charges.16 The aligned pharmacophore features were scored using the percentage of overlapped pharmacophore volumes or the number of overlapped pharmacophore points (np). Scoring functions based on a combination of shape and pharmacophore similarity such as ComboScore and ScaledCombo were also provided by the ROCS program. In addition, we devised a new ligand alignment and scoring procedure called “ShapeAlign.” Similar to ROCS combo scoring, ShapeAlign performed an initial shape alignment between query and reference compounds using the Shape-it program. The aligned conformations were used as input to the Align-it program, which generated consensus pharmacophore features, and the optimal ligand alignment was identified using ComboScore and ScaledCombo based on a combination of shape Tanimoto index and the number of matching pharmacophore points (np). The main difference in the combo score between ROCS and ShapeAlign was how chemical features were scored. In the ROCS program, the matching chemical features were scored using a color potential, while in ShapeAlign the chemical features were evaluated by the number of overlapping Gaussian volumes with similar chemical properties.17 Although it is feasible to devise an algorithm that simultaneously maximizes the alignment score based on both shape and pharmacophore, ligand superposition is computationally intensive. Therefore, discarding any ligand that does not conform to the shape requirement as the first step improves the computational efficiency of the 3D ligand comparison algorithm.
To identify the optimal 3D similarity metrics for scaffold hopping, we retrieved six drug classes from the DUD (Directory of Useful Decoy) consisting of 46 angiotensin-converting enzyme (ACE) inhibitors, 47 cyclin-dependent kinase 2 (CDK2) inhibitors, 25 HMG-CoA reductase (HMGA) inhibitors, 23 heat shock protein 90 (HSP90) inhibitors, 31 poly-[ADP-ribose]-polymerase (PARP) inhibitors, and 34 HIV reverse transcriptase (HIVRT) inhibitors, and one active conformation for each compound was generated using the MOE program, whose structure generation accuracy has been validated using ligand crystal structures (Text S2 and Figure S1).18 Notably, these six DUD compound sets were known actives for the assigned drug class and were validated binders to the same respective receptor binding sites.19 One representative compound from each of the six target categories was randomly selected as the query and used to test the ability of each 3D similarity metric to enrich class-specific chemical scaffolds to the top rank by structure-based similarity searches (Figure 1A and B). The heatmap and enrichment curves indicated that several 3D metrics were indeed able to enrich each target specific conformer to the top rank (Figure 1B,C and Figure S2 and Table S1). To quantitatively assess the 3D similarity metrics, the performance of each metric was estimated by the area-under-curve (AUC) of hit rates at different rank orders (%), where 1 indicates a high target specific enrichment, while 0.5 indicates a random selection (Figure 2A and Table S1). Overall, ROCS and ShapeAlign similarity metrics based on a combination of shape and pharmacophore scoring gave the highest average AUC values (AUCShapeAlign:ComboScore = 0.6, AUCShapeAlign:ScaledCombo = 0.6, AUCROCS:TanimotoCombo = 0.64, AUCROCS:Comboscore = 0.67) compared to Shape-it or ROCS metrics that relied on simple molecular shape scoring (AUCShape-it:Tanimoto = 0.52, AUCROCS:ShapeTanimoto = 0.54; Figure 2B). While the Align-it program also produced high overall AUC values (AUCAlign-it:Tanimoto = 0.68, AUCROCS:ColorTanimoto = 0.7, AUCROCS:ScaledColor = 0.7), visual inspection of the aligned conformations revealed that many class-specific compounds did not yield the correct superposition perhaps due to the difficulty in resolving multiple alignments from redundant pharmacophore arrangements (Figure 2B).
Figure 1.
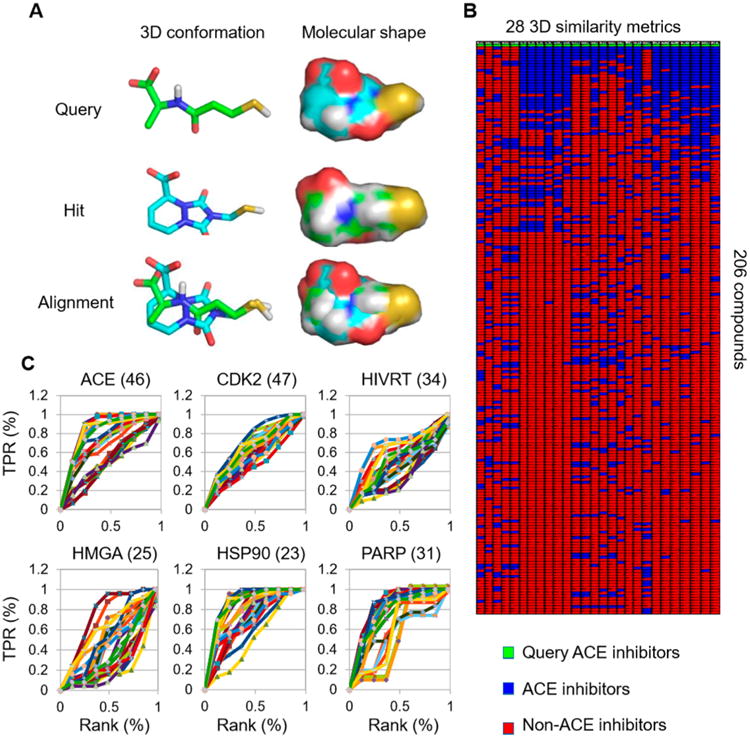
Computational screen of 3D similarity metrics. (A) Example of a structural alignment between a query ACE inhibitor and a hit ACE compound with a distinct chemical scaffold generated by the structural superposition algorithm. 3D chemical similarity metrics were used to measure the molecular shape and overlapping chemical features. (B) Unbiased screen of 28 3D chemical similarity metrics from Shape-it, Align-it, and ROCS programs. Representative ACE inhibitors were used as a query to test the ability of each 3D chemical similarity metric to enrich for class-specific scaffolds to the top rank from a combined set of 206 benchmark compounds consisting of six drug classes. The heatmap shows that the query (green) was retrieved as the top hit for all metrics. Additionally, each metric demonstrated a different ability to enrich for ACE-specific scaffolds (blue) from other drug classes. (C) The percentage of retrieved class-specific scaffolds was plotted against the ranking by each respective similarity score. TPR denotes true positive rate. To determine the performance of each metric, the area under the curve (AUC) was used to compute an enrichment factor (EF). For a list of 3D similarity metrics used, see Figure S2.
Figure 2.
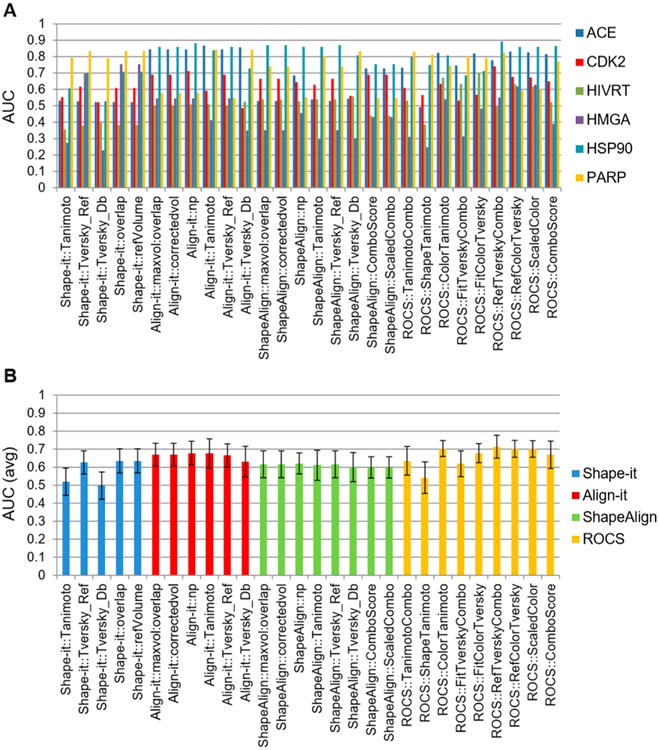
Performance assessment of 28 3D similarity metrics. (A) The performance of 28 3D similarity metrics were evaluated by the area under the curve (AUC) for six drug classes, where an AUC value of 1 indicated high selectivity and that of 0.5 indicated random selection. The results showed that ACE, CDK2, and PARP drug classes produced higher AUC values than HMGA, HSP90, and HIVRT. (B) Comparison of 28 3D chemical similarity metrics based on the average AUC values of six known drug classes. 3D chemical similarity metrics based on pharmacophore or a combination of shape and pharmacophore scoring produced higher enrichment factor (EF) values than those based on shape alone. Simple shape-based scoring produced the lowest EF values.
We subsequently selected 10 3D similarity metrics including those based on molecular shape (Shape-it:ShapeTanimoto, ROCS:ShapeTanimoto), pharmacophore (Align-it:PharmTani-moto, Align-it:NumberPharmacophore, ROCS:ColorTanimo-to), combined shape and pharmacophore (ShapeAlign:Scaled-Combo, ROCS:ComboScore), or in combination with FP2 Tanimoto scores. These were incorporated into the CSNAP3D program (Figure 3A), and their performance was evaluated in comparison to the CSNAP2D program that used FP2 fingerprints (Text S3 and Figure S3). Interestingly, 3D similarity metrics that used a combination of shape and pharmacophore scoring such as ShapeAlign:ScaledCombo or ROCS: ComboScore provided the highest overall true positive rate (TPR) and lowest false positive rate (FPR) than scorings based on either shape or pharmacophore features alone (Figure S4). The optimal performance was achieved by combining ShapeAlign: ScaledCombo with 2D FP2 Tanimoto scores, which gave a TPR > 95% at 0.85 Tanimoto coefficient (Tc), which defined the cutoff of chemical similarity between ligands (Figure 3B). On the other hand, ROCS demonstrated the highest computational efficiency among the four programs (Figure S5). A comparison of CSNAP3D and CSNAP2D chemical similarity networks showed that diverse drug chemotypes from the 2D similarity analysis were clustered into a smaller number of 3D shape-based networks with high target specificity, indicating that CSNAP3D allowed automated recognition of scaffold hopping compounds with diverse 3D structures (Figure 3C and D). CSNAP3D also improved the target predictability of orphan compounds that normally do not share high 2D similarity in bioactivity databases (Figure 3C and D). Next, we compared the performance of CSNAP3D with CSNAP2D and two other commonly used target prediction methods SEA and PASS (Text S4, Figure S6, and Table S2).9,10,20 We evaluated the ability of each approach to correctly rank the labeled targets of six drug classes. Based on the top prediction using each respective scoring function, the CSNAP3D approach achieved the highest TPR value (TPRCSNAP3D = 0.98) in comparison to the CSNAP2D (TPRCSNAP2D = 0.83), SEA (TPRSEA = 0.64), and PASS (TPRPASS = 0.11) approaches (Figure S6). We further evaluated the AUC values from the enrichment curve of TPR values against target rankings (1-1000 predictions; Text S4). Similarly, CSNAP3D yielded the highest AUC value (AUCCSNAP3D = 0.98) in comparison to CSNAP2D (AUCCSNAP2D = 0.94), SEA (AUCSEA = 0.90), and PASS (AUCPASS = 0.89; Figure S6).
Figure 3.
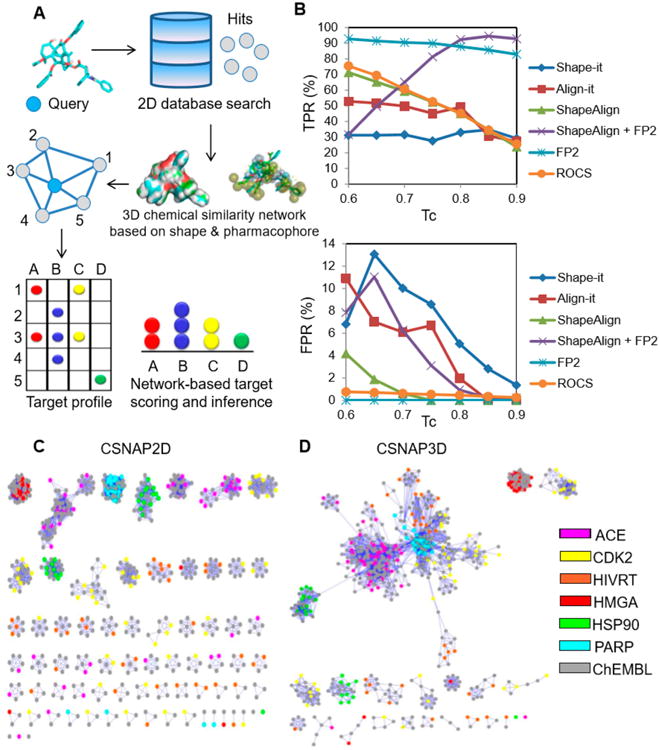
CSNAP3D analysis of benchmark compounds using 3D similarity metrics. (A) Workflow of CSNAP3D. The query compound was used to search the bioactivity database using 2D similarity fingerprints. The identified hits and query were clustered into 3D chemical similarity networks based on shape and/or pharmacophore. A network-based scoring scheme (S-score) was used to identify the most probable target from the annotated hits in the first-order neighbor of the query node. (B) Drug target prediction rate of 206 benchmark compounds were evaluated using selected 3D chemical similarity metrics. The percent true positive rate (TPR) and false positive rate (FPR) were evaluated at different chemical similarity thresholds (Tc). The results showed that the optimal 3D metrics were ShapeAlign using a combination of shape and pharmacophore scoring. In combination with 2D FP2 scoring, the ShapeAlign metric achieved a TPR > 85% and FPR ∼ 0% at a threshold of 0.85. The performance surpassed those based on 2D or 3D chemical similarity metrics alone. (C,D) Comparison between CSNAP2D and CSNAP3D target profiling of 206 benchmark compounds from six known drug classes. CSNAP2D partitioned the drugs into multiple chemotype-based similarity networks using a 0.6 Tanimoto cutoff (left). CSNAP3D linked the 2D chemotype-based networks into a smaller number of 3D shape-based networks using a threshold of 0.85 (right). The results indicate that many benchmark compounds are target-specific scaffold hopping compounds.
3D Target Profiling of HIVRT DUD Set
HIV reverse transcriptase (HIVRT) is a well-known target for antiviral therapy. Many HIVRT drugs like Non-nucleoside Reverse Transcriptase Inhibitors (NNRTIs) are known scaffold hopping compounds that target a common nucleotidyltransferase binding site, and the binding modes have been well characterized by extensive crystallography and molecular modeling studies.21 However, recent studies using alignment or nonalignment approaches based on 3D conformation or 2D similarity analysis of the HIVRT DUD set yielded low predictability.22,23 This challenge may be attributed to the structural diversity of the NNRTI chemical scaffolds and the lack of target annotations in bioactivity databases. This also suggested that current 3D target similarity inference approaches have limited capabilities for detecting scaffold hopping compounds. Therefore, we performed a CSNAP3D target profiling analysis of the 34 HIVRT inhibitors from the DUD set, and the results were compared to that from the CSNAP2D approach. Indeed, CSNAP2D analysis of the 34 HIVRT inhibitors resulted in 20 chemical similarity subnetworks corresponding to diverse chemotypes (Figure 4A and B). Further 2D target profiling by mapping the predicted S-scores of each compound on a heatmap indicated that 12 of the HIVRT inhibitors did not yield a prediction, giving a TPR of 65% (Figure 4C). In contrast, CSNAP3D analysis using ShapeAlign similarity metrics with a 2D FP2 Tanimoto score was able to cluster the 34 HIVRT inhibitors into a single shape-based chemical network that relates compounds by 3D structural similarity (Figure 4D). The network connectivity supports that many NNRTIs are in fact scaffold hopping compounds. Furthermore, 3D target profiling analysis correctly predicted HIVRT as the primary target for 33 HIVRT inhibitors, thus improving the TPR values to 97% (Figure 4E). To test if network connectivity was due to 3D scaffold hopping, the aligned ligand conformations generated by the CSNAP3D algorithm were retrieved. CSNAP3D correctly identify three FDA-approved HIVRT drugs, Efavirenz, Nevirapine, and Tivirapine, as scaffold hopping compounds and the structural alignments were in agreement with previous pharmacophore modeling and SAR studies (Figure 4F).21 In addition, CSNAP3D analysis also identified multiple novel HIVRT scaffold hopping pairs including compounds 4 and 5 that shared high 3D similarity and were not previously known (Figure 4G). These results indicated that CSNAP3D could be effectively applied to large-scale ligand deorphanization and scaffold-hopping prediction of any compound set with high structural diversity.
Figure 4.
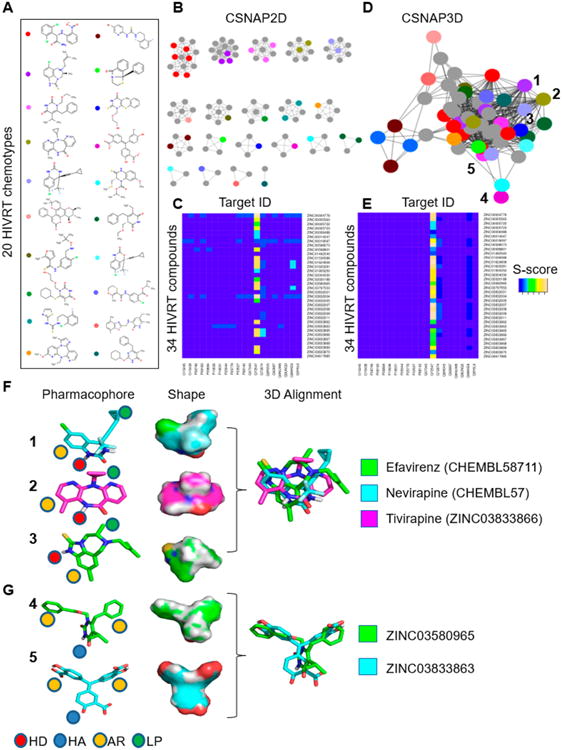
CSNAP3D target profiling of HIVRT inhibitors. (A,B) CSNAP2D analysis partitioned 34 diverse HIVRT inhibitors into 20 chemotypebased chemical similarity subnetworks. One representative chemotype from each network is shown in A. (C) Target profiling indicated that only 22 compounds were correctly predicted, giving a 65% TPR. (D) CSNAP3D analysis linked the 34 diverse HIVRT inhibitors into a single shape-based chemical similarity network, indicating that these compounds were scaffold hopping compounds. (E) Target profiling correctly predicted 33 compounds, thus improving the TPR value to 97%. (F) Selected HIVRT scaffold hopping pairs predicted by the CSNAP3D algorithm. Three FDA-approved drugs, Efavirenz, Nevirapine, and Tivirapine, were predicated to be scaffold hopping compounds, and the structure alignment agreed with crystal structures and molecular modeling studies. (G) CSNAP3D analysis identified novel HIVRT scaffold hopping pairs between compounds 4 and 5 that shared high 3D chemical similarity. (F,G) Indicated compound pharmacophores are composed of hydrogen bond donors (HD), hydrogen bond acceptors (HA), aromatic groups (AR), and lipophilic groups (LP).
Discovery of Novel Taxol Mimetics by 3D Scaffold Hopping
Taxol is a potent anticancer drug that binds and stabilizes microtubules, which leads to an M-phase cell cycle arrest and subsequently apoptosis.24 Although Taxol is widely used in the treatment of many cancers like breast and ovarian, it is plagued by issues related to its synthesis and solubility, despite a long history of attempts to circumvent these limitations by structural modifications.25,26 Furthermore, many treatment failures can be attributed to its exclusion from the central nervous system due to its large molecular weight, acquired drug resistance, and dose-limiting toxicities. Thus, the discovery of small molecular weight Taxol mimetics that bind to the taxane site with improved transport properties and resistance profiles will be particularly important.
We recently performed a high-throughput cell cycle small molecule screen and identified 212 compounds that arrested HeLa cells in the M-phase of the cell cycle.2 CSNAP target profiling and tubulin polymerization assays indicated that more than 20 compounds strongly stabilized microtubules and were potential Taxol mimetics.10 However, 2D similarity comparison suggested that these compounds were low molecular weight ligands that shared low structural similarity to Taxol. Thus, we hypothesized that many of these compounds were potential scaffold hopping compounds to the taxane site. To test this, we performed CSNAP3D target profiling of the 212 antimitotic compounds using ShapeAlign:ComboScore similarity metrics in combination with FP2 fingerprints. CSNAP3D target profiling revealed that compound predictability had increased, in comparison to CSNAP2D, and many compounds were predicted to target tubulin due to their network linkage with tubulin stabilizers or destabilizers, consistent with previous tubulin polymerization assay results.10 To identify potential Taxol mimetics, 30 Taxol structural analogs with different 3D conformations were identified from the mitotic compound network, and their first order neighbors were extracted followed by 2D similarity clustering (Figure 5A). Among the 42 predicted Taxol mimetics, seven mitotic compounds were true positives and were validated by end-point tubulin polymerization assays with >25% fold increases in microtubule mass relative to DMSO control (Figure 5B). To see if these seven tubulin-targeting molecules were predicted exclusively by the CSNAP3D method, we queried these molecules using the SEA and PASS severs to see if tubulin was a predicted target. Three molecules were predicted to target tubulin by the PASS server but with a low confidence score (Pa < 0.5), while the SEA server did not predict these molecules as tubulin-targeting agents (Table S3). We then focused on analyzing compounds 6-9, which colocalized onto a 3D similarity subnetwork (Figure 5B). Surprisingly, preliminary structural alignment with the Taxol conformation retrieved from the CSNAP3D algorithm indicated that these compounds displayed a T-shape 3D conformation similar to Taxol despite possessing much simpler molecular scaffolds (Figure 5C). Additional molecular modeling studies of the identified Taxol mimetics within the taxane site also revealed that these compounds shared a consensus pharmacophore (Text S4, Figures S7, S8, and S9). We further evaluated the anticancer effects of compounds 6-9 in cell viability and mitotic arrest assays to determine their potency in cell culture. Compounds 6, 7, and 9 showed cytotoxic and antimitotic effects with EC50s < 5 μM for either cell viability or G2/M arrest (Figure S10). Our previous study indicated that compound 6 had a >2 fold increase in microtubule polymerization in our tubulin polymerization assays and was the most potent tubulin polymerizing agent in the series.10 As further validation, we tested compound 6 in tubulin polymerization kinetic assays by monitoring the rate of drug-induced tubulin polymerization as well as the total amount of drug-induced microtubule formation by end-point readings. The results indicated that compound 6 achieved a faster polymerization kinetic at 50 μM in comparison to Taxol at 5 μM (Figure 5D). To further verify that tubulin was the main target of compound 6, we compared the mitotic arrest phenotype that was induced by the two compounds in HeLa cells. As expected, immunofluorescence microscopy showed that both compound 6 and Taxol induced the formation of similar mitotic microtubule asters, a characteristic phenotype of Taxol-like compounds (Figure 5E).
Figure 5.
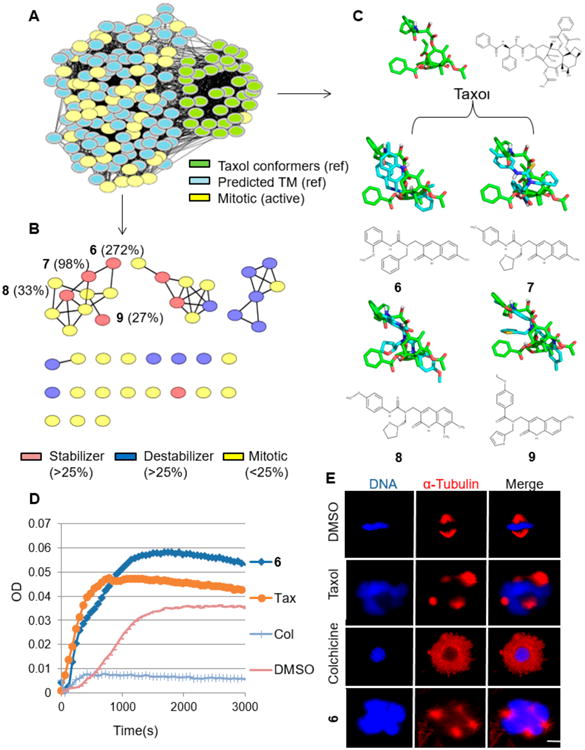
CSNAP3D identification of novel Taxol mimetics. (A) CSNAP3D analysis of 212 antimitotic compounds identified 36 Taxol structural analogs (green). A total of 60 first order neighbors were retrieved, and among them 42 were predicted to be Taxol mimetics (TM). (B) CSNAP2D analysis partitioned the 42 predicted Taxol mimetics into three major chemotype subnetworks. Seven compounds were confirmed true positives (red), validated by end-point tubulin polymerization assays, and showed a >25% fold increase in microtubule mass relative to the DMSO control. Four compounds (compounds 6-9) formed a microtubule-stabilizing network, their % fold increases in microtubule mass relative to DMSO are indicated in parentheses. (C) Structural alignment between Taxol mimetics and Taxol. Compounds 6-9 share a similar T-shape conformation to Taxol and are predicted to interact with the beta-tubulin taxane site. (D) Microtubule polymerization curves showed that compound 6 had a fast polymerization kinetic similar to Taxol and a higher end-point tubulin polymerization mass (OD = 0.55) than Taxol (OD = 0.45). (E) The drug-induced mitotic phenotype of compound 6 was compared with Taxol in HeLa cells using immunofluorescence microscopy. Both compound 6 and Taxol induced the formation of similar mitotic microtubule asters, a characteristic of Taxol-like compounds. In contrast, the negative control colchicine displayed a distinct microtubule depolymerization effect. Scale bar indicates 5 μm.
Conclusions
We developed a new structure-based target prediction approach called CSNAP3D that incorporates 3D similarity metrics for large-scale drug target profiling. Our enrichment analysis on 206 benchmark compounds showed that while pharmacophore metrics provided the highest enrichment rates and AUC values, visual inspection of the aligned structures showed that pharmacophore scoring cannot be used to identify the correct ligand alignment. Similarly, the performance of using shape-based metrics alone was sub-optimal. On the other hand, the improvement in target prediction when using a scoring function based on a combination of shape and pharmacophore features highlights the importance of shape complementarity and residue interactions, which are critical for protein-ligand interactions in three-dimensional space. Nevertheless, our analysis of HIVRT inhibitors suggests that pharmacophore features were more critical for identifying the three HIVRT inhibitor scaffold hopping compounds Efavirenz, Nevirapine, and Tivirapine, which have distinct molecular shapes. Furthermore, we found that by combining 3D metrics with 2D fingerprints, the prediction rate was improved when evaluated in the CSNAP3D algorithm. This improvement can be explained by the sensitivity of the 3D similarity metrics to subtle ligand structural variations when performing conformational searches.
We subsequently applied the CSNAP3D algorithm to identify several novel low molecular weight Taxol mimetics from a list of antimitotic compounds identified in a cell-based small molecule screen. While several small molecules that stabilize microtubules have been identified including Synstab B and GS-164, many of which were discovered by stochastic chemical screens, the binding modes of these ligands are unknown.27,28 Automated structural alignments generated by CSNAP3D showed that compound 6 displayed a T-shape conformation similar to that of Taxol. Further docking studies indicated that a similar conformation was observed in the Taxane pockets from which we were be able to identify a consensus pharmacophore for Taxol mimetics. This pharmacophore model allowed us to explain the increased tubulin polymerization effect of compound 6 that is due to the presence of phenyl moieties, which are capable of making π-π stacking interactions with residue His229 in the taxane site (Figures S7, S8, and S9). The binding mechanism of compound 6 was experimentally validated by kinetic tubulin polymerization assays, where it showed fast microtubule polymerization kinetics similar to Taxol and in end-point microtubule polymerization assays. Similarly, phenotypic comparison of drug-induced phenotypes indicated that tubulin was the main target of compound 6, which induced microtubule aster formation in HeLa cells, a characteristic of Taxol-like compounds. Despite having a lower potency than Taxol, compound 6 has a lower molecular weight and may have improved pharmacokinetic and transport properties. Furthermore, the structural information, pharmacophore, and binding mode of compound 6 are critical information that could be used in future pharmacophore-based virtual screening studies and structure-based drug design studies aimed at optimizing its antitubulin effects and anticancer properties.
Although CSNAP3D substantially improved compound target prediction, particularly for orphan ligands, there are several limitations to this approach. First, structural alignment is based on a single rigid low-energy conformation. Thus, it potentially excludes the possibility that a single ligand can interact with multiple binding sites by adopting different conformations and induce multiple on- and off-target activities. One potential approach to address this is to consider multiconformers CSNAP3D networks by structural enumeration. Alternatively, chemical descriptor similarity fingerprints capable of capturing ligand flexibility can likewise be applied. Second, while CSNAP3D is capable of detecting scaffold hopping ligands that share low 2D chemical similarity but bind in a similar 3D conformation to the same pocket environment, CSNAP3D is not able to deorphanize compounds that interact with orphan receptors that have unknown binding ligands. This challenge can potentially be addressed by considering pseudoligands, which can be extracted as a mirror image of the receptor pocket with annotated chemical features. We are currently pursuing this approach for large-scale structural polypharmacological target profiling.
In conclusion, we have developed a new computational program CSNAP3D, a 3D upgrade of the CSNAP framework for large-scale network-based drug target prediction based on ligand superposition. Specifically, we have addressed the challenges of target prediction by 2D similarity comparison by using 3D similarity metrics for automated identification of scaffold hopping ligands and ligand structural alignment for large-scale network target prediction. In addition, we have successfully applied this approach to elucidate the binding mode of small molecule Taxol mimetics and identified a consensus pharmacophore for structure-based discovery. We expect that CSNAP3D will stimulate further methodology development and applications for drug target prediction in the new paradigm of structural polypharmacology.
Methods
Compounds
Compound 6 was purchased from Astex Inc. with greater than 95% purity. For compound information, see Table S4. For 1H NMR of compound 6, see Figure S10. Cell Culture. HeLa cells were grown in F12:DMEM 50:50 medium (GIBCO) with 10% FBS, 2 mM L-glutamine, and antibiotics in 5% CO2 at 37 °C.
Cell-Based Assays
HeLa cells were treated with increasing concentrations of the indicated compounds (6-9) in triplicate, and the cell viability and percent G2/M arrest was quantified as described previously.10 Briefly, for mitotic arrest EC50’s, cells were treated with a 20 2-fold-titration (190 pM to 10 μM) of each compound for 20 h, and the percentage of G2/M arrested cells was measured using the Vybrant DyeCycle Green (Invitrogen) assay.2 For cell viability EC50’s, cells were treated with a 14 2-fold-titration (12.2 nM to 100 μM) of each compound for 72 h, and cell viability was measured using the CellTiter-Glo Assay (Promega).2,10 Assay plates were read with a Tecan M1000 microplate reader (Tecan) at 540 nm. The CDD software (www.collaborativedrug.com) was used to compute EC50 and EC90 values.
Immunofluorescence Microscopy
Immunofluorescence microscopy was performed as described previously.29 Briefly, HeLa cells were treated with indicated compounds at their respective EC90s for 20 h, fixed with 4% paraformaldehyde, permeabilized with 0.2% Triton X-100/PBS, and costained for DNA (0.5 μg/mL Hoechst 33342) and tubulin (rat antitubulin primary antibodies and antirat Cy3 secondary antibodies). Images were captured with a Leica DMI6000 microscope at 63× magnification.
In Vitro Tubulin Polymerization Assays
Tubulin polymerization assays were conducted using the HTS-Tubulin polymerization assay kit (Cytoskeleton Inc.) as described previously.10 The final concentration of test compounds was 50 μM in 0.5% DMSO. Tubulin polymerization kinetics were measured at 37 °C in a Tecan microplate reader (Tecan Group Ltd.) at 340 nm every minute for 1 h.
Molecular Modeling
The crystal structure of Taxol-bound tubulin was from the PDB database (PDB ID: 1JFF), and the beta-tubulin monomer with bound Taxol (chain B) was extracted from the protein model using UCSF Chimera software.30 The model of the beta-tubulin monomer was then imported into the MOE software for docking experiments. The Taxol-binding pocket was prepared using the ligX protocol including hydrogen protonation, tether energy minimization, and removal of unbound water. The docking of compounds 6-9 into the Taxol-binding site was performed using the Dock protocol with default parameters (placement, triangle matcher; score, London dG; retained conformations, 30). The molecular modeling was performed using the 2009 MOE software.
Software
The CSNAP program is available as a web service http://services.mbi.ucla.edu/CSNAP/. The ligand alignment programs Shape-it and Align-it were from Silicos Inc. (http://silicos-it.be.s3-website-eu-west-1.amazonaws.com/index.html). The ligand alignment program ROCS was from OpenEye Scientific Software (http://www.eyesopen.com/). The molecular structures were generated using Pymol V.1.6. The chemical similarity networks were generated using Cytoscape V.3.2.0.
Structural Data
The ligand structure data of benchmark sets were retrieved from DUD LIB VS 1.0 in the Directory of Useful Decoy (DUD; http://dud.docking.org/). Ligand structure data for Taxol mimetics were provided by the UCLA molecular screening shared resource center. The beta-tubulin structure was from the PDB database (PDB ID: 1JFF).
Supplementary Material
Figure S1. Accuracy evaluation of the predicted ligand conformations. One low energy conformation was regenerated using the MOE program for each ligand in the Bostrom set (36), the Astex set (331) and the PDB set (5000). Both Bostrom and Astex contained ligands with crystal structures while the PDB set contained co-crystalized structures of protein-ligand complexes. To test the accuracy of computationally generated ligand conformations, the predicted ligand conformers were structurally aligned with their crystal structures and the root-mean-square deviation (RMSD) were evaluated using the Confab program. On average, 80% of ligand conformations could be correctly predicted within 2.5 A of the crystal structure. Furthermore, there was no significant difference in prediction accuracy for either crystallized structures from the Bostrom and Astex sets or co-crystallized structures from the PDB set.
Figure S2. Scaffold enrichment of known drugs using 3D chemical similarity metrics. 28 diverse 3D chemical similarity metrics from Piramid, Pharao, ShapeAlign and ROCS programs were used to test the enrichment rate of class-specific chemical scaffolds from a benchmark set of six known drug classes. To evaluate the performance of each metric, the enrichment curves of percentage active against rank order were generated and the enrichment factor (EF) were computed by the area under the curve (AUC).
Figure S3. CSNAP3D algorithm workflow. 206 benchmark compounds were used as query to search the ChEMBL database using 2D FP2 fingerprints. Annotated compounds sharing 2D similarity >0.6 were retrieved. Query and annotated compounds were clustered into a 3D shape-based network using different 3D chemical similarity metrics. The network-based scoring algorithm was applied to identify the most common targets in the first order neighbor of each query compound in the network.
Figure S4. Prediction rates of selected 3D chemical similarity metrics using CSNAP3D. 10 representative 3D chemical similarity metrics from Shape-it (Piramid), Align-it (Pharao), and ROCS programs were incorporated into the CSNAP algorithm and the prediction rate, including TPR and FPR were evaluated at different similarity thresholds using 206 benchmark compounds from the DUD set. ShapeAlign: ScaledCombo in combination with 2D FP2 Tanimoto index produced the highest TPR (> 85%) and lowest FPR (∼0%) at threshold of 0.85.
Figure S5. Computing rates of selected 3D chemical similarity metrics using CSNAP3D. 10 representative 3D chemical similarity metrics from Shape-it (Piramid), Align-it (Pharao), and ROCS programs were incorporated into the CSNAP algorithm and the processing rates, measured by the processing time per ligand, were measured.
Figure S6. Performance comparison of target prediction approaches. 6 benchmark drug classes with known targets (ACE, CDK2, HIVRT, HSP90, and PARP) were predicted by CSNAP3D, CSNAP2D, SEA, and PASS target prediction methods. The TPR values, determined by the number of correct predictions within the top 1 or top 10 of the ranked targets were determined. The enrichment curves plotting TPR values of the top 1 (0.1%), top 10 (1%), top 100 (10%), and top 1000 (100%) target ranked lists were generated and the AUC values were determined for each method.
Figure S7. Molecular docking of Taxol mimetics into the taxane site. Compounds 6-9 were docked into the taxane binding site of beta tubulin (PDB: 1JFF) using the MOE program. The top three binding poses of each ligand ranked by London G scores were identified. The taxane receptor surfaces are colored based on hydrophobicity (red: hydrophilic, white: neutral, green: hydrophobic). The docking poses showed that each ligand positioned in the taxane site in a combinatorial fashion where the fused double rings methyl dihydroquinolinone, alkyl phenyl rings and either a thiopene, oxolane, or phenyl ring make intermolecular contacts with the northern, western, and eastern parts of the taxane binding pocket (see direction arrows).
Figure S8. Intermolecular interactions between Taxol mimetics and the taxane site. The intermolecular interactions of compounds 6-9 with the critical residues of the taxane binding site were visualized using the interaction map in the MOE program. The map showed that Taxol mimetics made multiple intermolecular contacts with critical residues Thr276, Pro274 and His229 through hydrogen bonding and pi-pi stacking interactions.
Figure S9. Consensus pharmacophore between Taxol and Taxol mimetics. (A-B) Molecular docking followed by structural alignment identified the consensus pharmacophore between compounds 6-9 and Taxol. The classic Taxol SAR indicates that the oxetane ring (position 3) and the phenyl moieties (position 1 and 2) are critical for Taxol binding and anticancer effects. The consensus pharmacophore includes the methyl dihydroquinolinone in the eastern region (position 3) that makes a hydrogen bond with residues Thr276 and Pro274 while the ring moieties on the western side (position 2) engage in hydrophobic and pi-pi stacking interactions with residue His229. Additionally, the methoxyl or ethoxyl group of the alkyl phenyl ring (position 1) also play a role in stabilizing the hydrophobic region in the northern part of the taxane site. The identified pharmacophore is consistent between Taxol and Taxol mimetics.
Figure S10. Compound potency of Taxol mimetics in cell-based assays. The potency of the 4 predicted Taxol mimetics was evaluated and compared to Taxol in cell-based assays to determine their anticancer effects. For cell cycle arrest assays, HeLa cells were treated with increasing concentrations (20-point titration 0–100 μM) of indicated compounds for 20 hours and the percentage of cells arrested in G2/M was quantified. For cell viability assays, cells were treated with compounds for 72 hours and the extent of cell death was quantified. The EC50s were calculated using the CDD (Collaborative Drug Discovery) software.
Figure S11. 1H NMR characterization of compound 6. 1H NMR (DMSO-d6, 300 MHz): δ 2.40 (s, 3H), 3.72 (s, 3H), 4.66-4.78 (m, 2H), 5.18-5.28 (m, 2H), 6.92 (br dd, 8.0, 8.0 Hz, 1H), 7.01 (br d, J = 8.0 Hz, 1H), 7.06 (br d, J = 8.0 Hz, 1H), 7.12-7.31 (m, 2H), 7.23-7.31 (m, 1H), 7.31-7.40 (m, 5H), 7.55 (d, J = 8.0 Hz, 1H), 7.72 (br s, 1H), 9.55 (br s, 1H), 11.90 (br s, 1H).
Table S1. Raw data of the computational 3D similarity metrics screen. Contains hit enrichment curves of the six known drug classes evaluated by 28 3D similarity metrics at different rank orders (%). One representative compound from each of the six target categories was randomly selected as query and was used to test the ability of each 3D similarity metric to enrich class-specific chemical scaffolds to the top rank by structure-based similarity searches. The performances of each 3D similarity metric were quantified by the area-under-curve (AUC).
Table S2. Raw data of the benchmark drug target prediction performance comparison. Contains benchmark drug structure data in SMILES notation and their target prediction results analyzed by CSNAP3D, CSNAP2D, SEA, and PASS approaches respectively. The top hits ranked by each respective scoring function (S-score, E-value and Pa-value) were recorded. If the labeled target did not match the top hit, the rank of labeled targets were identified from the target rank list and the corresponding scores were recorded.
Table S3. Raw data of the tubulin compound target prediction performance comparison. Contains tubulin-targeting compound structure data in SMILES notation and their target prediction results analyzed by CSNAP3D, SEA, and PASS approaches respectively. The top hits ranked by each respective scoring function (S-score, E-value and Pa-value) were recorded. If the top prediction was not tubulin, the rank of the predicted tubulin targets were identified from the target rank list and the corresponding scores were recorded.
Table S4. Taxol mimetic compound information.
Acknowledgments
We thank OpenEye scientific software for providing ROCS software for evaluation and T. Rose for interpreting the 1H NMR spectrum. This work was supported by a JCCC seed grant, a UC-CRCC grant, and an NSF grant MCB1243645 to J.Z.T.
Footnotes
Supporting Information: The Supporting Information is available free of charge on the ACS Publications website at DOI: 10.1021/acschem-bio.6b00253. Experimental results and text, 1H NMR spectra for compound 6, raw data from computational 3D similarity metrics screens and program comparisons, and Taxolmimetic compound information (PDF) Raw data of the computational 3D similarity metrics screen (XLSX), Raw data of the benchmark drug target prediction performance comparison (XLS), Raw data of the tubulin compound target prediction performance comparison (XLS)
Author Contributions: Y.-C.L. designed and validated CSNAP3D. Y.-C.L. and J.Z.T initiated the project, designed experiments, and analyzed results with input from all authors. Y.-C.L. and S.S. performed biochemical and cellular assays. Y.-C.L. performed molecular modeling. R.D. provided compound procurement and compound structure preparation
Notes: The authors declare no competing financial interest.
References
- 1.Schenone M, Dancik V, Wagner BK, Clemons PA. Target identification and mechanism of action in chemical biology and drug discovery. Nat Chem Biol. 2013;9:232–240. doi: 10.1038/nchembio.1199. [DOI] [PMC free article] [PubMed] [Google Scholar]
- 2.Senese S, Lo YC, Huang D, Zangle TA, Gholkar AA, Robert L, Homet B, Ribas A, Summers MK, Teitell MA, Damoiseaux R, Torres JZ. Chemical dissection of the cell cycle: probes for cell biology and anti-cancer drug development. Cell Death Dis. 2014;5:e1462. doi: 10.1038/cddis.2014.420. [DOI] [PMC free article] [PubMed] [Google Scholar]
- 3.Kuntz ID. Structure-based strategies for drug design and discovery. Science. 1992;257:1078–1082. doi: 10.1126/science.257.5073.1078. [DOI] [PubMed] [Google Scholar]
- 4.Fomina-Yadlin D, Kubicek S, Walpita D, Dancik V, Hecksher-Sorensen J, Bittker JA, Sharifnia T, Shamji A, Clemons PA, Wagner BK, Schreiber SL. Small-molecule inducers of insulin expression in pancreatic alpha-cells. Proc Natl Acad Sci U S A. 2010;107:15099–15104. doi: 10.1073/pnas.1010018107. [DOI] [PMC free article] [PubMed] [Google Scholar]
- 5.Chin RM, Fu X, Pai MY, Vergnes L, Hwang H, Deng G, Diep S, Lomenick B, Meli VS, Monsalve GC, Hu E, Whelan SA, Wang JX, Jung G, Solis GM, Fazlollahi F, Kaweeteerawat C, Quach A, Nili M, Krall AS, Godwin HA, Chang HR, Faull KF, Guo F, Jiang M, Trauger SA, Saghatelian A, Braas D, Christofk HR, Clarke CF, Teitell MA, Petrascheck M, Reue K, Jung ME, Frand AR, Huang J. The metabolite alpha-ketoglutarate extends lifespan by inhibiting ATP synthase and TOR. Nature. 2014;510:397–401. doi: 10.1038/nature13264. [DOI] [PMC free article] [PubMed] [Google Scholar]
- 6.Verhelst SH, Bogyo M. Chemical proteomics applied to target identification and drug discovery. BioTechniques. 2005;38:175–177. doi: 10.2144/05382TE01. [DOI] [PubMed] [Google Scholar]
- 7.Giaever G, Shoemaker DD, Jones TW, Liang H, Winzeler EA, Astromoff A, Davis RW. Genomic profiling of drug sensitivities via induced haploinsufficiency. Nat Genet. 1999;21:278–283. doi: 10.1038/6791. [DOI] [PubMed] [Google Scholar]
- 8.Maggiora G, Vogt M, Stumpfe D, Bajorath J. Molecular similarity in medicinal chemistry. J Med Chem. 2014;57:3186–3204. doi: 10.1021/jm401411z. [DOI] [PubMed] [Google Scholar]
- 9.Keiser MJ, Roth BL, Armbruster BN, Ernsberger P, Irwin JJ, Shoichet BK. Relating protein pharmacology by ligand chemistry. Nat Biotechnol. 2007;25:197–206. doi: 10.1038/nbt1284. [DOI] [PubMed] [Google Scholar]
- 10.Lo YC, Senese S, Li CM, Hu Q, Huang Y, Damoiseaux R, Torres JZ. Large-scale chemical similarity networks for target profiling of compounds identified in cell-based chemical screens. PLoS Comput Biol. 2015;11:e1004153. doi: 10.1371/journal.pcbi.1004153. [DOI] [PMC free article] [PubMed] [Google Scholar]
- 11.Sharan R, Ulitsky I, Shamir R. Network-based prediction of protein function. Mol Syst Biol. 2007;3:88. doi: 10.1038/msb4100129. [DOI] [PMC free article] [PubMed] [Google Scholar]
- 12.Bohm HJ, Flohr A, Stahl M. Scaffold hopping. Drug Discovery Today: Technol. 2004;1:217–224. doi: 10.1016/j.ddtec.2004.10.009. [DOI] [PubMed] [Google Scholar]
- 13.Naerum L, Norskov-Lauritsen L, Olesen PH. Scaffold hopping and optimization towards libraries of glycogen synthase kinase-3 inhibitors. Bioorg Med Chem Lett. 2002;12:1525–1528. doi: 10.1016/s0960-894x(02)00169-5. [DOI] [PubMed] [Google Scholar]
- 14.Haigh JA, Pickup BT, Grant JA, Nicholls A. Small molecule shape-fingerprints. J Chem Inf Model. 2005;45:673–684. doi: 10.1021/ci049651v. [DOI] [PubMed] [Google Scholar]
- 15.Rush TS, 3rd, Grant JA, Mosyak L, Nicholls A. A shape-based 3-D scaffold hopping method and its application to a bacterial protein-protein interaction. J Med Chem. 2005;48:1489–1495. doi: 10.1021/jm040163o. [DOI] [PubMed] [Google Scholar]
- 16.Taminau J, Thijs G, De Winter H. Pharao: pharmacophore alignment and optimization. J Mol Graphics Modell. 2008;27:161–169. doi: 10.1016/j.jmgm.2008.04.003. [DOI] [PubMed] [Google Scholar]
- 17.Yan X, Li J, Liu Z, Zheng M, Ge H, Xu J. Enhancing molecular shape comparison by weighted Gaussian functions. J Chem Inf Model. 2013;53:1967–1978. doi: 10.1021/ci300601q. [DOI] [PubMed] [Google Scholar]
- 18.Jahn A, Hinselmann G, Fechner N, Zell A. Optimal assignment methods for ligand-based virtual screening. J Cheminf. 2009;1:14. doi: 10.1186/1758-2946-1-14. [DOI] [PMC free article] [PubMed] [Google Scholar]
- 19.Huang N, Shoichet BK, Irwin JJ. Benchmarking sets for molecular docking. J Med Chem. 2006;49:6789–6801. doi: 10.1021/jm0608356. [DOI] [PMC free article] [PubMed] [Google Scholar]
- 20.Lagunin A, Stepanchikova A, Filimonov D, Poroikov V. PASS: prediction of activity spectra for biologically active substances. Bioinformatics. 2000;16:747–748. doi: 10.1093/bioinformatics/16.8.747. [DOI] [PubMed] [Google Scholar]
- 21.Zhan P, Chen X, Li D, Fang Z, De Clercq E, Liu X. HIV-1 NNRTIs: structural diversity, pharmacophore similarity, and implications for drug design. Med Res Rev. 2013;33(Suppl 1):E1–72. doi: 10.1002/med.20241. [DOI] [PubMed] [Google Scholar]
- 22.Cortes-Cabrera A, Morris GM, Finn PW, Morreale A, Gago F. Comparison of ultra-fast 2D and 3D ligand and target descriptors for side effect prediction and network analysis in polypharmacology. Br J Pharmacol. 2013;170:557–567. doi: 10.1111/bph.12294. [DOI] [PMC free article] [PubMed] [Google Scholar]
- 23.AbdulHameed MD, Chaudhury S, Singh N, Sun H, Wallqvist A, Tawa GJ. Exploring polypharmacology using a ROCS-based target fishing approach. J Chem Inf Model. 2012;52:492–505. doi: 10.1021/ci2003544. [DOI] [PubMed] [Google Scholar]
- 24.Horwitz SB. Taxol (paclitaxel): mechanisms of action. Ann Oncol. 1994;5(Suppl 6):S3–6. [PubMed] [Google Scholar]
- 25.Kingston DG, Bane S, Snyder JP. The taxol pharmacophore and the T-taxol bridging principle. Cell Cycle. 2005;4:279–289. [PubMed] [Google Scholar]
- 26.Konno T, Watanabe J, Ishihara K. Enhanced solubility of paclitaxel using water-soluble and biocompatible 2-methacryloyloxyethyl phosphorylcholine polymers. J Biomed Mater Res. 2003;65:209–214. doi: 10.1002/jbm.a.10481. [DOI] [PubMed] [Google Scholar]
- 27.Haggarty SJ, Mayer TU, Miyamoto DT, Fathi R, King RW, Mitchison TJ, Schreiber SL. Dissecting cellular processes using small molecules: identification of colchicine-like, taxol-like and other small molecules that perturb mitosis. Chem Biol. 2000;7:275–286. doi: 10.1016/s1074-5521(00)00101-0. [DOI] [PubMed] [Google Scholar]
- 28.Shintani Y, Tanaka T, Nozaki Y. GS-164, a small synthetic compound, stimulates tubulin polymerization by a similar mechanism to that of Taxol. Cancer Chemother Pharmacol. 1997;40:513–520. doi: 10.1007/s002800050695. [DOI] [PubMed] [Google Scholar]
- 29.Torres JZ, Summers MK, Peterson D, Brauer MJ, Lee J, Senese S, Gholkar AA, Lo YC, Lei X, Jung K, Anderson DC, Davis DP, Belmont L, Jackson PK. The STARD9/Kif16a kinesin associates with mitotic microtubules and regulates spindle pole assembly. Cell. 2011;147:1309–1323. doi: 10.1016/j.cell.2011.11.020. [DOI] [PMC free article] [PubMed] [Google Scholar]
- 30.Lowe J, Li H, Downing KH, Nogales E. Refined structure of alpha beta-tubulin at 3.5 A resolution. J Mol Biol. 2001;313:1045–1057. doi: 10.1006/jmbi.2001.5077. [DOI] [PubMed] [Google Scholar]
Associated Data
This section collects any data citations, data availability statements, or supplementary materials included in this article.
Supplementary Materials
Figure S1. Accuracy evaluation of the predicted ligand conformations. One low energy conformation was regenerated using the MOE program for each ligand in the Bostrom set (36), the Astex set (331) and the PDB set (5000). Both Bostrom and Astex contained ligands with crystal structures while the PDB set contained co-crystalized structures of protein-ligand complexes. To test the accuracy of computationally generated ligand conformations, the predicted ligand conformers were structurally aligned with their crystal structures and the root-mean-square deviation (RMSD) were evaluated using the Confab program. On average, 80% of ligand conformations could be correctly predicted within 2.5 A of the crystal structure. Furthermore, there was no significant difference in prediction accuracy for either crystallized structures from the Bostrom and Astex sets or co-crystallized structures from the PDB set.
Figure S2. Scaffold enrichment of known drugs using 3D chemical similarity metrics. 28 diverse 3D chemical similarity metrics from Piramid, Pharao, ShapeAlign and ROCS programs were used to test the enrichment rate of class-specific chemical scaffolds from a benchmark set of six known drug classes. To evaluate the performance of each metric, the enrichment curves of percentage active against rank order were generated and the enrichment factor (EF) were computed by the area under the curve (AUC).
Figure S3. CSNAP3D algorithm workflow. 206 benchmark compounds were used as query to search the ChEMBL database using 2D FP2 fingerprints. Annotated compounds sharing 2D similarity >0.6 were retrieved. Query and annotated compounds were clustered into a 3D shape-based network using different 3D chemical similarity metrics. The network-based scoring algorithm was applied to identify the most common targets in the first order neighbor of each query compound in the network.
Figure S4. Prediction rates of selected 3D chemical similarity metrics using CSNAP3D. 10 representative 3D chemical similarity metrics from Shape-it (Piramid), Align-it (Pharao), and ROCS programs were incorporated into the CSNAP algorithm and the prediction rate, including TPR and FPR were evaluated at different similarity thresholds using 206 benchmark compounds from the DUD set. ShapeAlign: ScaledCombo in combination with 2D FP2 Tanimoto index produced the highest TPR (> 85%) and lowest FPR (∼0%) at threshold of 0.85.
Figure S5. Computing rates of selected 3D chemical similarity metrics using CSNAP3D. 10 representative 3D chemical similarity metrics from Shape-it (Piramid), Align-it (Pharao), and ROCS programs were incorporated into the CSNAP algorithm and the processing rates, measured by the processing time per ligand, were measured.
Figure S6. Performance comparison of target prediction approaches. 6 benchmark drug classes with known targets (ACE, CDK2, HIVRT, HSP90, and PARP) were predicted by CSNAP3D, CSNAP2D, SEA, and PASS target prediction methods. The TPR values, determined by the number of correct predictions within the top 1 or top 10 of the ranked targets were determined. The enrichment curves plotting TPR values of the top 1 (0.1%), top 10 (1%), top 100 (10%), and top 1000 (100%) target ranked lists were generated and the AUC values were determined for each method.
Figure S7. Molecular docking of Taxol mimetics into the taxane site. Compounds 6-9 were docked into the taxane binding site of beta tubulin (PDB: 1JFF) using the MOE program. The top three binding poses of each ligand ranked by London G scores were identified. The taxane receptor surfaces are colored based on hydrophobicity (red: hydrophilic, white: neutral, green: hydrophobic). The docking poses showed that each ligand positioned in the taxane site in a combinatorial fashion where the fused double rings methyl dihydroquinolinone, alkyl phenyl rings and either a thiopene, oxolane, or phenyl ring make intermolecular contacts with the northern, western, and eastern parts of the taxane binding pocket (see direction arrows).
Figure S8. Intermolecular interactions between Taxol mimetics and the taxane site. The intermolecular interactions of compounds 6-9 with the critical residues of the taxane binding site were visualized using the interaction map in the MOE program. The map showed that Taxol mimetics made multiple intermolecular contacts with critical residues Thr276, Pro274 and His229 through hydrogen bonding and pi-pi stacking interactions.
Figure S9. Consensus pharmacophore between Taxol and Taxol mimetics. (A-B) Molecular docking followed by structural alignment identified the consensus pharmacophore between compounds 6-9 and Taxol. The classic Taxol SAR indicates that the oxetane ring (position 3) and the phenyl moieties (position 1 and 2) are critical for Taxol binding and anticancer effects. The consensus pharmacophore includes the methyl dihydroquinolinone in the eastern region (position 3) that makes a hydrogen bond with residues Thr276 and Pro274 while the ring moieties on the western side (position 2) engage in hydrophobic and pi-pi stacking interactions with residue His229. Additionally, the methoxyl or ethoxyl group of the alkyl phenyl ring (position 1) also play a role in stabilizing the hydrophobic region in the northern part of the taxane site. The identified pharmacophore is consistent between Taxol and Taxol mimetics.
Figure S10. Compound potency of Taxol mimetics in cell-based assays. The potency of the 4 predicted Taxol mimetics was evaluated and compared to Taxol in cell-based assays to determine their anticancer effects. For cell cycle arrest assays, HeLa cells were treated with increasing concentrations (20-point titration 0–100 μM) of indicated compounds for 20 hours and the percentage of cells arrested in G2/M was quantified. For cell viability assays, cells were treated with compounds for 72 hours and the extent of cell death was quantified. The EC50s were calculated using the CDD (Collaborative Drug Discovery) software.
Figure S11. 1H NMR characterization of compound 6. 1H NMR (DMSO-d6, 300 MHz): δ 2.40 (s, 3H), 3.72 (s, 3H), 4.66-4.78 (m, 2H), 5.18-5.28 (m, 2H), 6.92 (br dd, 8.0, 8.0 Hz, 1H), 7.01 (br d, J = 8.0 Hz, 1H), 7.06 (br d, J = 8.0 Hz, 1H), 7.12-7.31 (m, 2H), 7.23-7.31 (m, 1H), 7.31-7.40 (m, 5H), 7.55 (d, J = 8.0 Hz, 1H), 7.72 (br s, 1H), 9.55 (br s, 1H), 11.90 (br s, 1H).
Table S1. Raw data of the computational 3D similarity metrics screen. Contains hit enrichment curves of the six known drug classes evaluated by 28 3D similarity metrics at different rank orders (%). One representative compound from each of the six target categories was randomly selected as query and was used to test the ability of each 3D similarity metric to enrich class-specific chemical scaffolds to the top rank by structure-based similarity searches. The performances of each 3D similarity metric were quantified by the area-under-curve (AUC).
Table S2. Raw data of the benchmark drug target prediction performance comparison. Contains benchmark drug structure data in SMILES notation and their target prediction results analyzed by CSNAP3D, CSNAP2D, SEA, and PASS approaches respectively. The top hits ranked by each respective scoring function (S-score, E-value and Pa-value) were recorded. If the labeled target did not match the top hit, the rank of labeled targets were identified from the target rank list and the corresponding scores were recorded.
Table S3. Raw data of the tubulin compound target prediction performance comparison. Contains tubulin-targeting compound structure data in SMILES notation and their target prediction results analyzed by CSNAP3D, SEA, and PASS approaches respectively. The top hits ranked by each respective scoring function (S-score, E-value and Pa-value) were recorded. If the top prediction was not tubulin, the rank of the predicted tubulin targets were identified from the target rank list and the corresponding scores were recorded.
Table S4. Taxol mimetic compound information.