Graphical Abstract
Frequency drifts during a long spectral editing experiment change the frequency of the editing pulse relative to that of metabolites, leading to errors in quantification. In this article we describe a retrospective method to correct for frequency drifts in spectral editing. Our results demonstrate the effectiveness of the correction method and aslo the remarkable robustness of a GABA editing technique with a top hat editing profile in the presence of frequency drifts.

Keywords: Magnetic resonance spectroscopy, GABA editing, drift, retrospective correction
Introduction
GABA is the major inhibitory neurotransmitter in the mammalian central nervous system (1). In the cerebral cortex of healthy human brain, the concentration of GABA is approximately 1 mM (2). GABA editing by in vivo magnetic resonance spectroscopy has become an established method for measuring GABA levels in human brain in various brain disorders (3). Because GABA levels are intrinsically low and many clinical manifestations of GABAergic abnormalities are subtle (e.g., 4, 5) GABA editing often requires an acquisition of 20 to 30 minutes to obtain a usable signal to noise ratio (SNR). This long acquisition time however renders the data sensitive to frequency drift, as the location of the editing pulse in the frequency domain changes relative to the shifting metabolite spectrum the editing efficiency will change as well. Several sources contribute to frequency shifts in clinical studies including imprecise pre-scan frequency calibration, gradient-coil cooling after a gradient-intensive scan, and patient motion. Patient motion may introduce bias when normal volunteers are compared to patients, who are more likely to move during the scan. Furthermore the GABA signal is obtained using a two-step GABA J-editing technique (2,6,7). Taking the difference between an edit-on and an edit-off acquisition may lead to additional errors in the GABA measurement while frequency is drifting.
Although phase and frequency variations during long MRS scans are generally corrected based on information obtained from the water signal, the presence of a frequency-selective pulse in an editing experiment such as GABA editing adds new complexities to frequency and phase corrections. In the case of GABA editing, the editing uses the J coupling between the observed protons at 3.01 ppm on the GABA C4 carbon and the edited protons around 1.89 ppm on the C3 carbon. The gap between observed and edited groups is also influenced by the coupling between the groups, the edited C3 protons are spread out by the J coupling from the C4 and the C2 protons. The separation between the edited and observed proton groups of around 1 ppm requires an editing pulse with a steep transition, making the editing effect very sensitive to frequency drift for the metabolites in this transition area. The sensitivity to frequency drift is further complicated by the co-edited macromolecule group M7 at 3.01 ppm that couples to the group M4 around 1.72 ppm (15). The separation of about 22 Hz at 3 Tesla between the GABA C3 protons and the M7 group is too small to avoid co-editing. The exact composition of the macromolecules in the M4 and M7 group is unknown and may have a wide range of shifts and J couplings. The unavoidable location of the M4 group in the effective area of the editing pulse will increase the instability with an unknown amount with frequency drift whether the sequence is set up to avoid editing or to suppress the edited M7 contribution (8). This phenomenon explains the large variations in GABA when measured using an editing pulse with a pointed frequency profile (e.g., a Gaussian pulse). The sensitivity in GABA editing efficiency to frequency drift can be mitigated by adopting an editing pulse with a top hat frequency profile (6) that covers both the edited GABA C3 location at 1.89 ppm and the macromolecular M4 group around 1.72 ppm. However, other metabolites such as NAA and Glx are still affected by frequency drift, compromising the overall information content of the data. The optimal way to address this problem is to monitor and compensate frequency drift during the scan by updating scanner B0 during scanning (9,10). These techniques will also correct for the varying contribution of the macromolecular contribution to the total GABA signal. However for large amount of data, in literature and at our site, the technical part of these methods have not been implemented in the sequence and only a retrospective method can be used
Here we present a novel retrospective method to correct frequency drift during spectral editing experiments. Theoretically, the effect of the editing pulse on each individual metabolite can be simulated to generate an array of basis sets for each small frequency shift of the metabolite. Then, before signal averaging, one may fit each individual spectrum based on its individual frequency shift. Unfortunately, such an approach is problematic because each individual spectrum is of very low SNR. Unlike global phase and frequency correction, correction of changes in editing efficiency by spectral fitting requires sufficiently high SNR. The dilemma is that the history of frequency and phase shift during the long scan is lost once signal averaging takes place to gain high SNR necessary for spectral fitting.
In this work we generated an array of basis sets as a function of frequency offset of the metabolite chemical shifts. We obtained the history of frequency drift during a long scan from the residual water signal in each individual spectrum. Then we generated a new basis set from the histogram of offsets for the averaged spectrum by taking into account its history of frequency drift retrospectively. In this way the problem of low SNR of each individual spectrum was solved. Evaluating GABA editing data acquired from 135 healthy subjects using an editing pulse with a top hat frequency profile showed that the NAA signal at 2.04 ppm in the transition region of the GABA editing pulse (6) and the creatine signal at 3.91 ppm in the transition region of the water suppression pulses are most affected by frequency drift. The proposed retrospective frequency drift correction method can effectively correct signal distortion due to frequency drift over long data acquisition. In addition, our results experimentally validated that GABA editing using an editing pulse with a top hat frequency profile is highly robust with respect to the magnitude of frequency drift encountered in a typical clinical setting.
Methods
Scanning
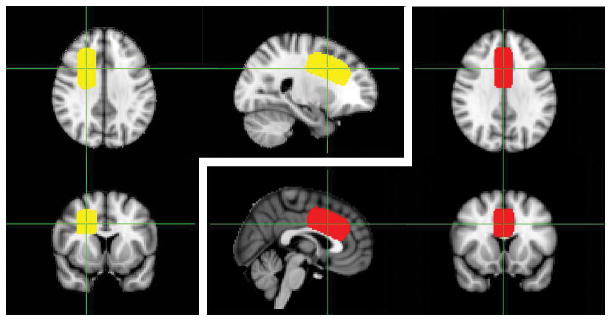
135 healthy volunteers participated in IRB approved protocols 95-M-0150 and 00-M-0085 between February 2008 and January 2015 (11). The volunteers were scanned on a 3 Tesla whole body scanner (GE, Milwaukee, WI, 14M4 platform) with a quadrature single channel transmit / receive RF coil (IGC Medical Advances, Milwaukee, WI, USA). Scan sessions began with a T1-weighted anatomical scan by a three dimensional spoiled gradient echo sequence (SPGR: Repetition time (TR) = 24 ms, echo time (TE) = 3.2 ms, flip angle = 17 degrees; in plane resolution = 0.9 mm × 0.9 mm; matrix size = 192 × 256; field of view = 240 mm × 240 mm; slice thickness = 2 mm; total scan time = 2 min 32 s). A second anatomical image with the same sequence parallel to the anterior portion of the corpus callosum was made to prescribe the spectroscopy voxels on. Spectra were acquired from two voxels of 2 * 2 * 4.5 cm3 with the long dimension in the anterior – posterior direction. One voxel was placed immediately superior to the ventricles, straddling the midline in order to contain the largest proportion of gray matter possible, with the anterior edge of the voxel never exceeding the anterior portion of the genu of the corpus callosum. This resulted in inclusion of the corpus callosum, medial prefrontal cortex and anterior cingulate cortex. Another voxel was placed directly adjacent to the first one, in the right frontal white matter. It was positioned to minimize gray matter and cerebrospinal fluid (CSF) contribution and always to remain dorsal to the caudate nucleus (Figure 1). The GABA editing sequence is a standard GE PRESS sequence (6,12) with an additional pair of editing pulses, TE = 68 ms; TR = 1.5 s. The flip angle of refocus pulses in the PRESS sequence in the standard GE sequence was reduced to 167 degrees to reduce the maximum B1 and maintain a bandwidth of 1384 Hz. The water suppression consists of a cascade of three pulses for chemical-shift selective water suppression (CHESS) (13) with a bandwidth of 150 Hz at 3 Tesla. The standard calibration of the water suppression deliberately leaves a residual water signal of about 1%. The wide bandwidth of the water suppression and the relative high amplitude of the residual water relative to the metabolites (about a factor of 100) guarantee a stable reference for frequency and amplitude correction. The creatine signal at 3.03 ppm could be used as a reference as well (14) but its amplitude is comparable to the other metabolites so the standard deviation of the fit will propagate to the parameters of the other metabolites. The editing pulse (14.4 ms, γB1max = 243.29 Hz) has a top-hat profile with an inversion range from 1.9 ppm to 0.6 ppm that covers both the GABA protons on C3 at 1.89 ppm, the M4 group of the macromolecules at 1.72 ppm that couple with group M7 at 3 ppm (15), and partially covers the glutamate and glutamine protons on their C3 and C4 carbons (12). The transition band in the metabolite spectrum ranges from 2.42 (10% of maximum) to 1.88 (90% of maximum) ppm. The editing pulse was switched on (edit-on) and off (edit-off) during even- and odd numbered saved scans. The number of repetitions was 768 plus 16 acquisition of unsuppressed water at the end. The total scan duration was 20 minutes. The phase cycling of the standard GE PRESS sequence is constrained to a minimum of two steps (NEX=2), alternating the sign of the 90 excitation pulse, and the acquisitions are averaged in-scanner and then saved for post processing.
Figure 1.
The averaged locations of the FWM voxel (yellow) and the MPFC voxel (red) over the 135 normal volunteer scans after registration to standard space. The green lines through the center of the voxels show the location of the three image planes.
Data averaging
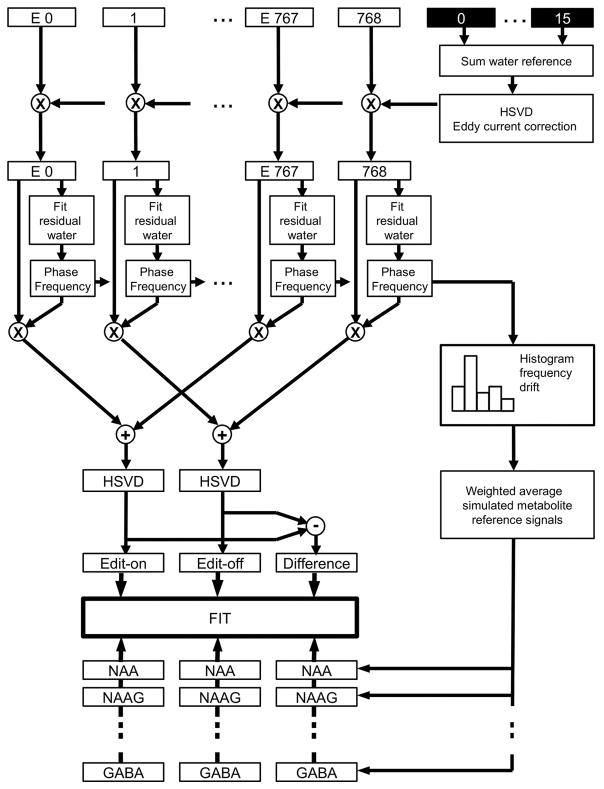
An array of basis sets as a function of frequency offset of the metabolites were generated. The history of frequency drift during the scan was obtained from the residual water signal in each individual spectrum and a histogram was created with the fractional distribution of offsets in intervals of one hertz. The frequency drift histogram was then used to generate a new averaged basis set by using basis sets matching the history of frequency drift. Specifically, the spectroscopy data were processed in the time domain as shown in the flow chart in figure 2: eight (16/NEX) saved unsuppressed water acquisitions made at the end of the scan were phase- and frequency- corrected, and summed to obtain a water reference signal. The water reference signal was fitted using the Hankel Singular Value Decomposition (HSVD) (16) (nroots=64). The singular value components with an amplitude greater than 1/5000 of the maximum water amplitude were selected to construct a noise-free water reference signal with a smooth phase. The phase of this signal was used to correct all the water-suppressed acquisitions individually for eddy currents and residual water sidebands (17) by multiplying each acquisition with a phase and frequency correction function, exp(−i*phase(t)). To correct for subject motion, the spectroscopy data were evaluated by comparing the amplitude of the residual water signal of each of the 384 (768/NEX) scans. A pair of edit-on and edit-off acquisitions were rejected if their respective residual water amplitude deviated more than 10%. To further correct for subject motion the phase of each residual water signal was used to phase- and frequency- correct each scan as described previously (12,18,19). The scans were then averaged to one edit-off signal, one edit-on signal, and one difference signal to reveal the GABA C4 signal. The same HSVD algorithm (nroots=64) was then used to remove the residual water from these three spectra (17).
Figure 2.
Flow chart of data processing. On top are the 768 edit-off and edit-on (E prefix) interleaved acquisitions with the 16 water reference scans at the end of the scan. The processing steps consist of eddy current correction with the phase obtained from the HSVD fit on the phase and frequency corrected sum of the 16 water reference scans, similar phase and frequency drift correction for each individual acquisition prior to data summation, final residual water removal in the edit-off and edit-on signal by the HSVD, frequency drift histogram for reference signal averaging, and the final spectral fitting of the edit-on, edit-off and difference signals.
Simulation
The updated quantum mechanical simulation C++ library GAMMA (20) was obtained from http://scion.duhs.duke.edu/vespa/gamma and used to simulate the effects of the GABA editing sequence. The effects of RF shapes, water suppression, crusher gradients, and the various coherence pathways were fully simulated (21, 22) for 21 editing frequency offsets (from −10 Hz to 10Hz at 1 Hz steps with respect to the water signal at 4.65 ppm) were calculated using the NIH Biowulf system (23). Simulations consisted of 64 by 64 locations in the transverse plane selected by the 167 degree refocusing pulses over an area of 8 cm by 8 cm to fully cover the spectroscopy voxel and its surrounding volume. In a sub loop in the simulation an additional averaging step encompassed an average of 8 × 8 × 8 spatial micro steps in the three voxel dimensions to simulate the phase averaging effects of the gradient crushers (21). The simulated signals were normalized according to the number of proton spins in the metabolites. Chemical shifts and J couplings for the metabolites were obtained from the literature as described in the fitting section. Metabolite signals were simulated for both the edit-on and edit-off scans to obtain the difference signals. For each metabolite the results for each spin was saved separately to allow to construct a reference signal for different moieties of a metabolite. This was done to accommodate a difference in offsets from the literature values and to allow to freely fit amplitudes and frequency offsets of singlets and coupled spin systems.
Fitting
Spectral fitting was performed using a Levenberg- Marquardt non-linear fitting program MPFIT (24) written in IDL (Harris Geospatial Solutions, Boulder Colorado, USA). The MPFIT program fitted the simulated metabolite reference signals to the three time domain signals: the edit-off, the edit-on, and the difference signal simultaneously using only one parameter set. For each simulated metabolite reference signal five parameters were fitted: two amplitude parameters (absolute amplitude and phase), two line width parameters for a Voigt type line, and a frequency offset parameter. The phase, line shape and frequency offset parameters were shared by all metabolites in the fitted spectrum.
Reference signals were simulated for NAA (NAA_ASP for the coupled spins and NAA_AC for the singlet to avoid contamination of the NAA singlet by the coupled spin group that overlaps with other metabolites) (25), NAAG (25 with couplings for the glutamate moiety from glutamate), creatine (CRE1 peaks at 3.03 ppm and CRE2 peaks at 3.91 ppm, 1/2 creatine and 1/2 phosphocreatine (26) with the sum of the two compounds to account for the broader lineshape of the compound peak at 3.91 ppm), choline (GPC_PCH 1/3 phosphorylcholine (PCH) and 2/3 glycerophosphocholine (GPC) (26) the sum was used since the coupled spin groups are too weak to be fitted separately), myo-inositol (MIO) (26), glutamate (GLU1 peaks at 3.75 ppm and GLU2 peaks between 2.4 ppm and 1.9 ppm to allow a separate fit of the isolated doublet at 3.75 ppm in the difference signal) (26), glutamine (GLN1 peaks at 3.77 ppm and GLN2 peaks between 2.5 ppm and 2 ppm to allow a separate fit of the isolated doublet at 3.75 ppm in the difference spectrum) (26), scyllo-inositol (SCI) (25), glutathione (GSH) (27), and GABA (28). The GABA reference signal consists of two GABA moieties, GABA1 for spins between 1.7 and 2.4 ppm, GABA2 for spins at 3.01 ppm, and a macromolecular contribution (MM). The macromolecular signal M7 (15) that is J coupled to group M4 at 1.7 ppm was represented by a Gaussian shaped line in the frequency domain at the location of the GABA C4 proton (3.01 ppm). The ratio of the GABA to macromolecular contribution was fixed to 0.39:0.61, optimized for the best fit of the shape of the total GABA signal in the difference signal (21).
For visual presentation the processed time domain data was multiplied by a 5.9 Hz positive exponential function and by a 6.6 Hz Blackman-Harris window before transforming to the frequency domain.
Segmentation
Tissue composition of the spectroscopy voxels was determined from the segmented SPGR anatomical scan with the SPM5 program (29). With an in-house developed IDL program the fractions of gray matter (GM), white matter (WM), and cerebrospinal fluid (CSF) were determined from the spectroscopy voxel coordinates in the segmented images (12).
Results
The frequency variation found over the 135 healthy volunteers contained an initial inaccuracy due to prescan calibration and subsequent drift over the entire scan. The average initial calibration error was −1.2 Hz with a standard deviation of 1.6 Hz. The magnitude of the drift over the scan was on average 2.6 Hz with a standard deviation of 1.7 Hz. The maximum drift measured in the cohort was 10.1 Hz.
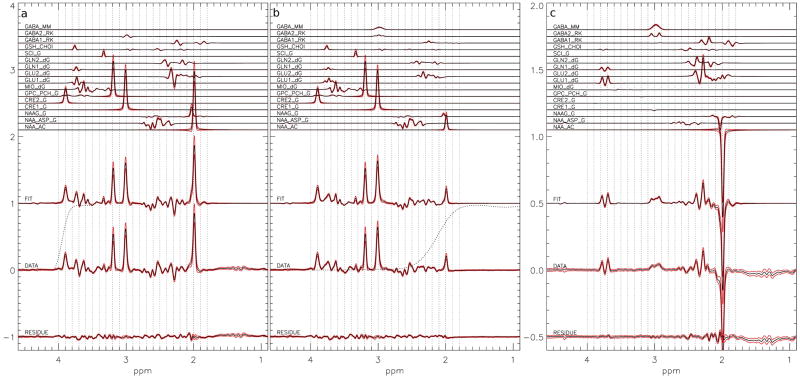
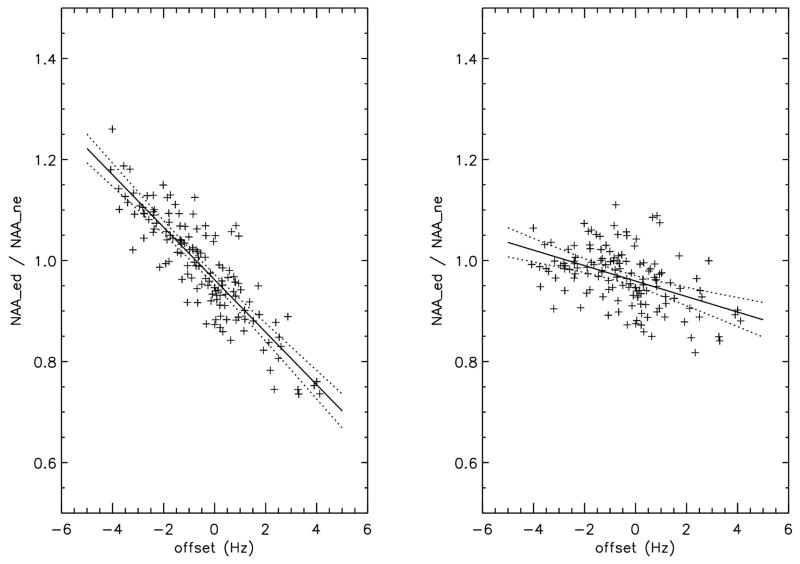
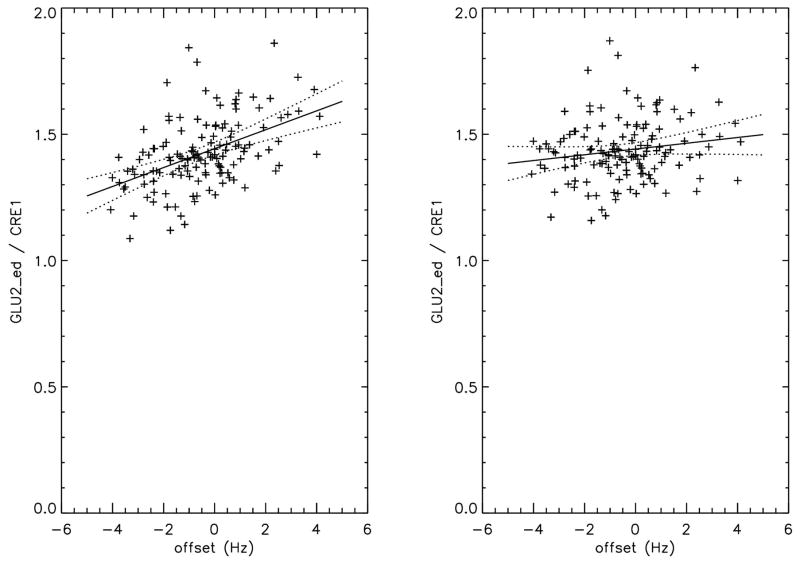
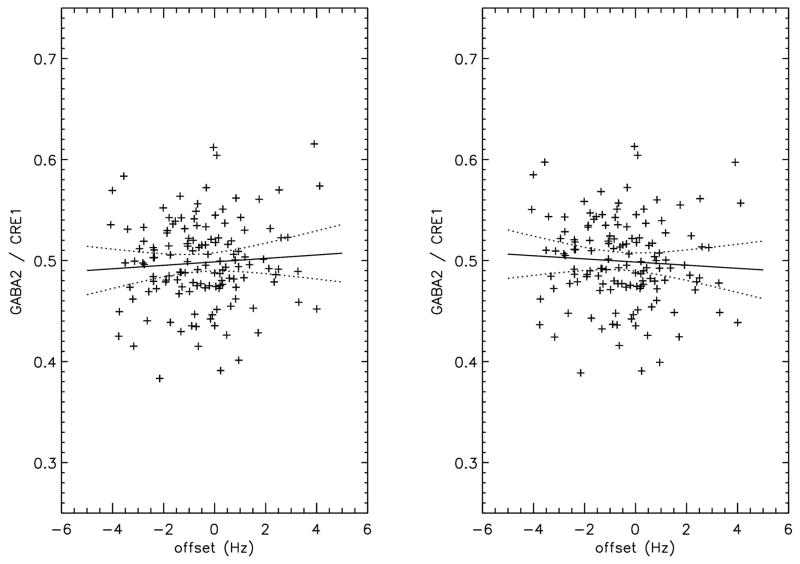
The fit to the 135 healthy volunteers was shown in figure 3 for the edit-off a), edit-on b), and difference c) spectrum. The red lines show the standard deviation over the 135 volunteers. In the edit-on spectrum the frequency profile of the higher frequency transition area of the editing pulse is shown as a dotted line with the NAA peak at 2.01 ppm in the transition region. To test the effect of the frequency drift correction the fit was performed using separate metabolite amplitude parameters for each of the edit-off, edit-on, and difference spectra. The fitted metabolite amplitudes for the creatine peak at 3 ppm (CRE1), the NAA peak at 2 ppm (NAA_AC), the glutamate peaks around 2.3 ppm (GLU2), and the GABA peak at 3 ppm (GABA2) were plotted as a function of the average offset of the scan for the 135 volunteers, with and without offset correction. The amplitudes from CRE2, GLU2, and GABA2 were normalized by the CRE1 amplitude and the amplitude for the edit-on NAA amplitude (NAA_ed) was normalized by the edit-off NAA amplitude (NAA_ne). A linear regression analysis was performed to reveal changes in standard deviation (SD) of the normalized metabolite amplitudes after frequency drift correction. The results are tabulated in table 1. The large reduction in both slope and R2 after correction indicates successful de-correlation of metabolite signals with frequency drift by the proposed method.
Figure 3.
The average of the 135 simultaneous fits to in vivo a) edit-off, b) edit-on, and c) difference spectra. Starting from the top: the simulated metabolite reference spectra, the sum of the fitted metabolite spectrum, the original data, and the residual of the fit. The simulated metabolite spectra are labeled with the metabolite abbreviation and the source of chemical shifts and coupling constants: RK, dG and G stand for R. Kreis (28), R. de Graaf (26), and V. Govindaraju (25) respectively. NAA_AC is the reference signal of the Acetyl moiety, NAA_ASP is the reference signal for the aspartate moiety. GLU1 and GLN1 are the reference signals for the 2C proton groups and GLU2 and GLN2 are the reference signals for the 3C and 4C proton groups of glutamate and glutamine respectively. GABA1 are the reference signals for the 2C and 3C proton groups and GABA2 the 4C proton group of GABA. The dotted line in a) shows the frequency response of lower frequency transition area of the water suppression pulse from 4.1 ppm to 3.5 ppm and in b) shows the higher frequency transition area of the GABA editing pulse. The red lines show the standard deviation over the 135 volunteers.
Table 1.
Statistics of metabolite amplitude ratios before and after frequency drift correction (n = 135)
| uncorrected | corrected | ||||||||
|---|---|---|---|---|---|---|---|---|---|
| ratio | voxel | avg | sd(%) | slope | R2 | avg | sd(%) | slope | R2 |
| CRE2/CRE1 | MPFC | 0.938 | 9.09 | 0.043 | 0.804 | 0.963 | 4.11 | −0.002 | 0.009 |
| CRE2/CRE1 | FWM | 0.888 | 10.6 | 0.046 | 0.846 | 0.954 | 4.38 | −0.006 | 0.074 |
| NAA_ed/NAA_ne | MPFC | 0.987 | 10.7 | −0.052 | 0.766 | 0.967 | 6.04 | −0.015 | 0.216 |
| NAA_ed/NAA_ne | FWM | 1.068 | 11.3 | −0.057 | 0.792 | 1.011 | 5.91 | −0.013 | 0.166 |
| GLU2/CRE1 | MPFC | 1.425 | 9.73 | 0.037 | 0.229 | 1.436 | 8.53 | 0.011 | 0.027 |
| GLU2/CRE1 | FWM | 1.216 | 10.9 | 0.036 | 0.260 | 1.255 | 9.13 | 0.006 | 0.009 |
| GABA2/CRE1 | MPFC | 0.498 | 8.64 | 0.002 | 0.005 | 0.499 | 8.62 | −0.002 | 0.004 |
| GABA2/CRE1 | FWM | 0.510 | 11.8 | −0.001 | 0.000 | 0.514 | 12.0 | −0.004 | 0.015 |
NAA_ed and NAA_ne stand for NAA of the edit-on and edit-off spectrum, respectively.
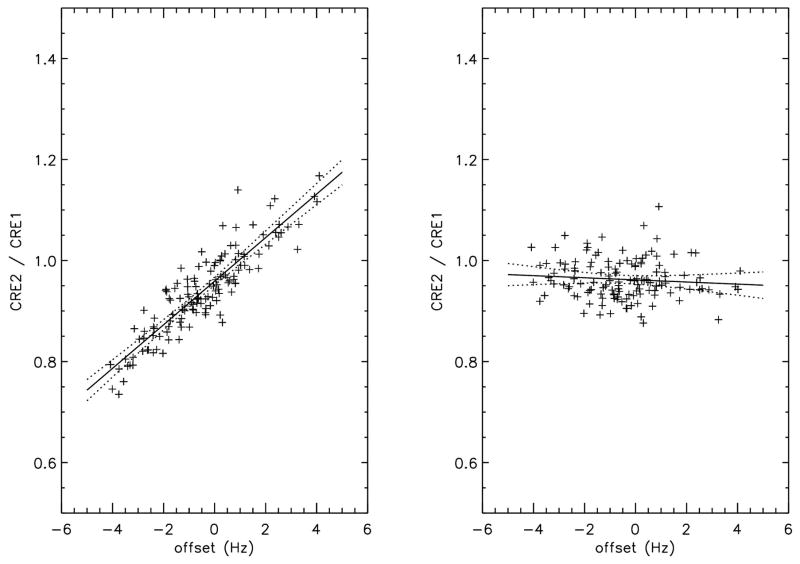
The effect of the offset of the water suppression pulse on the CRE2/CRE1 ratio of the MPFC voxel was plotted in figure 4. The creatine peak at 3.9 ppm lies in the transition region of the water suppression pulse (see figure 3a). A strong correlation between the average frequency offset and CRE2/CRE1 amplitude exists for the uncorrected data with an R2 of 0.80 (MPFC) and 0.85 (FWM), respectively. After correction the R2 is reduced to below 0.1 and the standard deviation is reduced from 9.09 % (MPFC) and 10.6 % (FWM) before correction to 4.11% (MPFC) and 4.38 % (FWM) after correction. The frequency drift effect of the editing pulse on the NAA amplitude of the MPFC voxel of the edit-on data normalized by the NAA amplitude of the edit-off data was plotted in figure 5. The NAA peak at 2.01 ppm lies in the transition region of the editing pulse (see figure 3b). The correlation between the ratio of NAA of the edit-on to that of the edit-off spectrum and the offset of the editing pulse is also highly significant, indicating frequency drift has a severe impact on NAA measurement. This undesirable effect was significantly reduced after our correction scheme as shown by Table 1 and Fig. 5.
Figure 4.
The ratio of the creatine peak at 3.9 ppm (CRE2) to the creatine peak at 3.03 ppm (CRE1) of the 135 subjects as a function of the average frequency offset over the entire scan. The left panel is the amplitude ratio without frequency drift correction and right panel is with correction. The creatine peak at 3.9 ppm is in the transition region of the water suppression pulses, making it sensitive to frequency drift during the scan. The solid lines are the best linear fit to the data and the dotted lines are the P=0.01 confidence range. The line fit statistics were listed in table 1.
Figure 5.
The ratio of the edit-on NAA peak at 2.01 ppm (NAA_ed) to the edited-off NAA peak (NAA_ne) of the 135 subjects as a function of the frequency offset averaged over the entire scan. The left panel is the amplitude without frequency drift correction and right panel is with correction. The NAA peak is in the transition region of the editing pulse, making it sensitive to frequency drift during the scan. The solid lines are the best linear fit to the data and the dotted lines are the P=0.01 confidence range. The line fit statistics were listed in table 1.
The main spectral line of the glutamate group at 2.28 ppm is coupled to the protons at its C3 carbon around 1.89 ppm, which is located at the top of the transition region of the GABA editing pulse profile. This makes the glutamate signal less sensitive to frequency drift than the NAA peak. The effect of the frequency shift on the co-edited GLU2/CRE1 amplitude is plotted in figure 6. Its standard deviation changed from 9.7 % (MPFC) and 10.9 % (FWM) before frequency drift correction to 8.5 % and 9.1 % after correction. The corresponding R2 changed from 0.229 (MPFC) and 0.26 (FWM) before frequency drift correction to 0.027 and 0.009 after correction. The effect of frequency drift correction on the GABA peak at 3.01 ppm in the difference spectrum was shown in figure 7. The GABA peak at 3.01 ppm is coupled to the GABA group at 1.89 ppm which is mainly located at the edge of the flat region of the editing pulse and the macromolecular group M4 at 1.72 ppm in the flat region of the editing pulse frequency response by pulse design (see figure 3b). As expected, frequency drift correction had no significant effects on its statistics, therefore, experimentally validating the robustness of GABA editing using an editing pulse with a top hat frequency profile.
Figure 6.
The ratio of the edited glutamate peaks between 2.4 ppm and 1.8 ppm (GLU2_ed) and the creatine peak at 3.03 ppm (CRE1) of the 135 subjects as a function of the frequency offset averaged over the entire scan. The left panel is the amplitude without offset correction and right panel is with offset correction. The glutamate peaks that are coupled to the GLU2 peaks are located around 1.89 and in the top of the transition region of the editing pulse profile, making them less sensitive to frequency drift than NAA. The solid lines are the best linear fit to the data and the dotted lines the P=0.01 confidence range. The line fit statistics are given in table 1.
Figure 7.
The ratio of the GABA peak in the difference spectrum at 3.01 ppm (GABA2) to the creatine peak at 3.03 ppm (CRE1) of the 135 subjects as a function of the frequency offset averaged over the entire scan. The left panel is the ratio without frequency drift correction and right panel is with correction. The GABA peak that is coupled to the GABA peak at 3.01 ppm is located at 1.89 ppm and in the flat region of the editing pulse profile, making it insensitive to offset drift during the scan. The solid lines are the best linear fit to the data and the dotted lines the P=0.01 confidence range. The line fit statistics are given in table 1.
Discussion
Changes in GABA concentrations in many mental illnesses can be very subtle (4,11). This puts stringent requirements on the reproducibility of the GABA editing sequence. To compound the difficulties, it is often more difficult to prevent slight head motions of patients with mental illnesses during the relatively long GABA scans. If uncorrected, the difference in head motion between patients and healthy controls can bias the results. A prospective correction method (9,10) will control for this sensitivity but in situation where scans have been made for years without these techniques only a post acquisition method can be used. We have developed the retrospective frequency drift correction method that requires only additional post acquisition data processing. Our results using the largest cohort of healthy volunteers undergoing GABA measurements to date unequivocally demonstrated the robustness of our approach. In comparison, metabolites, such as NAA, lying in the transition region of a frequency-selective pulse are found to be more prone to errors caused by frequency drift, confirming that an editing pulse profile with a sharp tip requires high cooperation from patients and high system stability.
A method to limit the change in GABA amplitude is to test for drift and threshold the data to tolerate a maximum amount of drift (30) but this results in loss of valuable patient data and the remaining data are still biased since the effect is not eliminated but reduced. When a greater number of scans are required to reach a statistically significant difference between normal volunteers and patients the bias can be highly detrimental to the integrity of the study.
Although GABA is not affected by frequency drift in our study, NAA, the creatine methylene group and glutamate are still affected. Without correction the overall information content of the data would be degraded as both NAA and glutamate are highly relevant for many brain studies. The effects of frequency drift on NAA, glutamate and creatine methylene protons (and on GABA if an editing pulse with a sharp tip is used) are largely due to the presence of the editing pulse per se. Conventional phase correction techniques cannot restore altered editing yield. The technique presented here uses basis sets that have taken the altered editing yield into account. Our results using a very large number of subjects showed that this approach is highly effective. We speculate that GABA data that are acquired using a highly selective editing pulse with a sharp frequency response can be corrected in a similar fashion.
In conventional data fitting a single set of basis functions is used. In the case of spectral editing experiment the editing pulse is assumed to be on-resonance. The proposed technique requires creating an array of basis function sets instead of a single set. Fitting each individual spectrum of low SNR without sufficient signal averaging is problematic while signal averaging itself erases the history of frequency drift, which is the key for frequency drift correction. The proposed technique solved this problem by creating a set of basis functions for each scan session based on its unique frequency drift history. The downside is increased computational load. Luckily, the array of basis functions corresponding a particular frequency drift value needs to be calculated only once. We have found that, with our data rejection criterion, a +/− 10 Hz range with a step of 1 Hz was sufficient to cover all 135 normal volunteers. A wider range may be needed to cover the frequency drift range of a patient population.
The simulation of the macromolecules under editing is still problematic. Literature values for shifts and couplings are fragmented. In our case the M4 group at 1.72 ppm are well in the flat area of the editing pulse and the editing efficiency is not affected by large drift in frequency. For other editing pulses it should be possible to approximately simulate the effect of editing using the GABA parameters with the C3 proton chemical shift at 1.89 ppm replaced with the chemical shift of 1.72 ppm of the M4 macromolecular group (15) and use the amplitude of the observed C4 protons at 3.01 ppm. COSY experiments in rat brain show the separate signals of GABA and the M4 and M7 macromolecular groups and demonstrate the feasibility of such an approach (31). This simple approximation of the macromolecule contribution could be tried to to compensate frequency drift post acquisition in data from editing sequences with sharp frequency profiles over the GABA and M7 edited locations.
Although the current study is limited to correcting signal intensity distortions associated with GABA editing the general idea of synthesizing a set of basis function based on history of frequency drift to fit experimental data should be broadly useful even in the absence of frequency selective editing pulses.
Abbreviations
- GABA
γ-Aminobutyric acid.
- SNR
Signal to Noise Ratio.
- GM
Gray matter.
- WM
White Matter.
- CSF
Cerebrospinal Fluid
- MPFC
Medial Prefrontal Cortex.
- FWM
Frontal White Matter.
- SPGR
Spoiled Gradient Echo.
- PRESS
Point Resolved Spectroscopy.
- CHESS
Chemical-Shift Selective water suppression.
- NEX
Number of averages in-scanner.
- MM
Macromolecules.
- M7
Macromolecule group M7 at 3 ppm.
- M4
Macromolecule group M4 at 1.72 ppm.
- HSVD
Hankel Singular Value Decomposition.
- nroots
number of roots in HSVD.
- NAA
N-acetylaspartate.
- NAA_ne
Edit-off signal of NAA.
- NAA_ed
Edit-on signal of NAA.
- NAA_ASP
N-acetylaspartate aspartate moiety only.
- NAA_AC
N-acetylaspartate acetyl moiety only.
- NAAG
N-acetylaspartylglutamate.
- CRE1
creatine peaks at 3.03 ppm.
- CRE2
creatine peaks at 3.91 ppm.
- GPC
glycerophosphocholine.
- PCH
phosphorylcholine
- MIO
myo-inositol
- GLU1
glutamate peaks at 3.75 ppm
- GLU2
glutamate peaks between 2.4 ppm and 1.9 ppm.
- GLN1
glutamine peaks at 3.77 ppm
- GLN2
glutamine peaks between 2.5 ppm and 2 ppm.
- SCI
scyllo-inositol.
- GSH
glutathione.
- GABA1
γ-aminobutyric acid peaks between 1.7 and 2.4 ppm.
- GABA2
γ-aminobutyric acid peaks at 3.01 ppm.
Footnotes
Financial disclosures: This study was supported by the Intramural Research Program of the National Institute of Mental Health, National Institutes of Health (IRP-NIMH-NIH). The authors report no conflict of interest, financial or otherwise.
References
- 1.Watanabe M, Maemura K, Kanbara K, Tamayama T, Hayasaki H. GABA and GABA receptors in the central nervous system and other organs. Int Rev Cytol. 2002;213:1–47. doi: 10.1016/s0074-7696(02)13011-7. [DOI] [PubMed] [Google Scholar]
- 2.Rothman DL, Petroff OA, Behar KL, Mattson RH. Localized 1H NMR measurements of gamma-aminobutyric acid in human brain in vivo. Proc Natl Acad Sci USA. 1993;90:5662–5666. doi: 10.1073/pnas.90.12.5662. [DOI] [PMC free article] [PubMed] [Google Scholar]
- 3.Puts NAJ, Edden RAE. In vivo magnetic resonance spectroscopy of GABA: A methodological review. Prog Nucl Magn Reson Spectrosc. 2012;60:29–41. doi: 10.1016/j.pnmrs.2011.06.001. [DOI] [PMC free article] [PubMed] [Google Scholar]
- 4.Hasler G, van der Veen JW, Tumonis T, Meyers N, Shen J, Drevets WC. Reduced prefrontal glutamate/glutamine and gamma-aminobutyric acid levels in major depression determined using proton magnetic resonance spectroscopy. Arch Gen Psychiatry. 2007;64:193–200. doi: 10.1001/archpsyc.64.2.193. [DOI] [PubMed] [Google Scholar]
- 5.Dharmadhikari S, Ma R, Yeh CL, Stock AK, Snyder S, Zauber SE, Dydak U, Beste C. Striatal and thalamic GABA level concentrations play differential roles for the modulation of response selection processes by proprioceptive information. Neuroimage. 2015;120:36–42. doi: 10.1016/j.neuroimage.2015.06.066. [DOI] [PMC free article] [PubMed] [Google Scholar]
- 6.Sailasuta N, LeRoux P, Hurd R, Wang P, Sachs N, Ketter T. Detection of cerebral gamma aminobutyric acid (GABA) in bipolar disorder patients and healthy volunteers at 3T. Proceedings of the 9th Annual Meeting ISMRM, Glasgow; Scotland, UK. 2001. p. 1011. [Google Scholar]
- 7.Mescher M, Merkle H, Kirsch J, Garwood M, Gruetter R. Simultaneous in vivo spectral editing and water suppression. NMR Biomed. 1998;11:266–272. doi: 10.1002/(sici)1099-1492(199810)11:6<266::aid-nbm530>3.0.co;2-j. [DOI] [PubMed] [Google Scholar]
- 8.Edden RA, Harris AD, Puts NA, Chan KL, Schär M, Barker PB. MM-suppressed GABA measurements are highly susceptible to B0 field instability. Proceedings of the 24th Annual Meeting ISMRM; Singapore. 2016; p. 2392. [Google Scholar]
- 9.Zaitsev M, Speck O, Hennig J, Büchert M. Single-voxel MRS with prospective motion correction and retrospective frequency correction. NMR Biomed. 2010;23:325–332. doi: 10.1002/nbm.1469. [DOI] [PubMed] [Google Scholar]
- 10.Edden RA, Oeltzschner G, Harris AD, Puts NA, Chan KL, Boer VO, Schär M, Barker PB. Prospective frequency correction for macromolecule-suppressed GABA editing at 3T. J Magn Reson Imaging. 2016 May 30; doi: 10.1002/jmri.25304. [DOI] [PMC free article] [PubMed] [Google Scholar]
- 11.Marenco S, Meyer C, Kuo S, van der Veen JW, Shen J, DeJong K, Barnett AS, Apud JA, Dickinson D, Weinberger DR, Berman KF. Prefrontal GABA Levels Measured With Magnetic Resonance Spectroscopy in Patients With Psychosis and Unaffected Siblings. Am J Psychiatry. 2016;173:527–534. doi: 10.1176/appi.ajp.2015.15020190. [DOI] [PubMed] [Google Scholar]
- 12.Geramita M, van der Veen JW, Barnett AS, Savostyanova AA, Shen J, Weinberger DR, Marenco S. Reproducibility of prefrontal γ-aminobutyric acid measurements with J-edited spectroscopy. NMR in Biomed. 2011;24:1089–1098. doi: 10.1002/nbm.1662. [DOI] [PubMed] [Google Scholar]
- 13.Webb PG, Sailasuta N, Kohler SJ, Raidy T, Moats RA, Hurd RE. Automated single-voxel proton MRS: Technical development and multisite verification. Mag Reson Med. 1994;31:365–373. doi: 10.1002/mrm.1910310404. [DOI] [PubMed] [Google Scholar]
- 14.Near J, Edden R, Evans CJ, Paquin R, Harris A, Jezzard P. Frequency and Phase Drift Correction of Magnetic Resonance Spectroscopy Data by Spectral Registration in the Time Domain. MRM. 2015;73:44–50. doi: 10.1002/mrm.25094. [DOI] [PMC free article] [PubMed] [Google Scholar]
- 15.Behar KL, Ogino T. Characterization of Macromolecule Resonances in the 1H NMR Spectrum of Rat Brain. Magn Reson Med. 1993;30:38–44. doi: 10.1002/mrm.1910300107. [DOI] [PubMed] [Google Scholar]
- 16.Barkhuijsen H, van de Beer R, Ormondt D. Improved algorithm for noniterative time-domain model fitting to exponentially damped magnetic resonance signals. Journal of Magnetic Resonance. 1987;73:553–557. [Google Scholar]
- 17.van der Veen JW, Marenco S, Shen J. Water sidebands removal in spectral fitting. Proceedings of the 23th Annual Meeting ISMRM; Toronto, Ontario, Canada. 2015; p. 1970. [Google Scholar]
- 18.van der Veen JW, Shen J. Residual water as a navigator in GABA editing spectroscopy. Proceedings of the 14th Annual Meeting ISMRM; Seattle, Washington, USA. 2006; p. 490. [Google Scholar]
- 19.van der Veen JW, Shen J. Regional difference in GABA levels between medial prefrontal and occipital cortices. J Magn Reson Imaging. 2013;38:745–750. doi: 10.1002/jmri.24009. [DOI] [PMC free article] [PubMed] [Google Scholar]
- 20.Smith SA, Levante TO, Meier BH, Ernst RR. Computer Simulations in Magnetic Resonance. An Object Oriented Programming Approach, J Magn Reson. 1994;106a:75–105. [Google Scholar]
- 21.van der Veen JW, Marenco S, Shen J. Improvements on extraction of glutamate and glutamine from GABA editing spectra at 3 Tesla. Proceedings of the Annual Joint Meeting ISMRM 2014; Milan, Italy. p. 2889. [Google Scholar]
- 22.van der Veen JW, van Ormondt D, de Beer Simulating metabolite basis sets for in vivo MRS quantitation, incorporating details of the PRESS pulse sequence by means of the GAMMA C++ library. proceedings ICT OPEN 2012; Rotterdam, The Netherlands. 2012; pp. 40–45. [Google Scholar]
- 23.This work utilized the computational resources of the NIH HPC Biowulf cluster. (http://hpc.nih.gov)
- 24.Markwardt CB. Non-Linear Least Squares Fitting in IDL with MPFIT. In: Bohlender D, Dowler P, Durand D, editors. Proc Astronomical Data Analysis Software and Systems XVIII, Quebec, Canada, ASP Conference Series; 2008. pp. 251–254. http://arxiv.org/abs/0902.2850. [Google Scholar]
- 25.Govindaraju V, Young K, Maudsley AA. Proton NMR chemical shifts and coupling constants for brain metabolites. NMR in Biomed. 2000;13:129–153. doi: 10.1002/1099-1492(200005)13:3<129::aid-nbm619>3.0.co;2-v. [DOI] [PubMed] [Google Scholar]
- 26.de Graaf RA. In vivo NMR Spectroscopy, Principles and Techniques. 2. Wiley; Chichester, West Sussex, England: 2007. pp. 45–78. [Google Scholar]
- 27.Choi C, Dimitrov IE, Douglas D, Patela A, Kaiser LG, Amezcuad CA, Mahere EA. Improvement of resolution for brain coupled metabolites by optimized 1H MRS at 7T. NMR Biomed. 2010;23:1044–1052. doi: 10.1002/nbm.1529. [DOI] [PubMed] [Google Scholar]
- 28.Kreis R, Bolliger CS. The need for updates of spin system parameters, illustrated for the case of γ-aminobutyric acid. Letter to the editor, NMR Biomed. 2012;25:1401–1403. doi: 10.1002/nbm.2810. [DOI] [PubMed] [Google Scholar]
- 29.Ashburner J, Friston KJ. Multimodal image coregistration and partitioning - a unified framework. Neuroimage. 1997;6:209–217. doi: 10.1006/nimg.1997.0290. [DOI] [PubMed] [Google Scholar]
- 30.Tsai S-Y, Fang C-H, Wu T-Y, Lin Y-R. Effects of Frequency Drift on the Quantification of Gamma-Aminobutyric Acid Using MEGA-PRESS. Scientific Reports. 6:24564. doi: 10.1038/srep24564. [DOI] [PMC free article] [PubMed] [Google Scholar]
- 31.Welch JWR, Bhakoo K, Dixon RM, Styles P, Sibson NR, Blamire AM. In vivo monitoring of rat brain metabolites during vigabatrin treatment using localized 2D-COSY. NMR in Biomed. 2003;16:47–54. doi: 10.1002/nbm.809. [DOI] [PubMed] [Google Scholar]


