Abstract
Radiofrequency ablation (RFA) is a widely used treatment for atrial fibrillation, the most common cardiac arrhythmia. Here, we explore autofluorescence hyperspectral imaging (aHSI) as a method to visualize RFA lesions and interlesional gaps in the highly collagenous left atrium. RFA lesions made on the endocardial surface of freshly excised porcine left atrial tissue were illuminated by UV light (365 nm), and hyperspectral datacubes were acquired over the visible range (420–720 nm). Linear unmixing was used to delineate RFA lesions from surrounding tissue, and lesion diameters derived from unmixed component images were quantitatively compared to gross pathology. RFA caused two consistent changes in the autofluorescence emission profile: a decrease at wavelengths below 490 nm (ascribed to a loss of endogenous NADH) and an increase at wavelengths above 490 nm (ascribed to increased scattering). These spectral changes enabled high resolution, in situ delineation of RFA lesion boundaries without the need for additional staining or exogenous markers. Our results confirm the feasibility of using aHSI to visualize RFA lesions at clinically relevant locations. If integrated into a percutaneous visualization catheter, aHSI would enable widefield optical surgical guidance during RFA procedures and could improve patient outcome by reducing atrial fibrillation recurrence.
Keywords: hyperspectral imaging, radiofrequency ablation, cardiac arrhythmia, surgical guidance
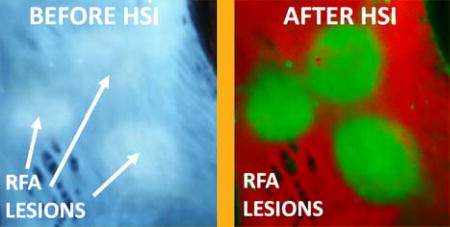
Graphical Abstract
1. Introduction
Atrial fibrillation (AF), the most common cardiac arrhythmia, is projected to affect as many as 12 million people in the United States by 2050 [1]. AF is typically caused by abnormal electrical activity originating in the muscle sleeves of the pulmonary veins or from ectopic foci in other parts of the left atrium [2]. AF can be effectively treated by radiofrequency ablation (RFA), which creates scar tissue that electrically isolates the pulmonary veins from the left atrium or directly eliminates the ectopic foci [3, 4]. Currently, success of the AF ablation procedure is determined by testing for a lack of electrical conduction through the ablated region [5]. However, reversible tissue injury and temporary edema can also stop electrical activity [6]. When the tissue recovers, electrical reconnections can lead to AF recurrence. The recurrence rate of AF after an ablation procedure can be as high as 50% and more than 90% of these recurrent cases have been linked to gaps between ablation lesions [7–10]. A meta-analysis of 19 studies showed that a single ablation procedure led to long-term (>3 years) freedom from atrial arrhythmia in only 53% of patients with paroxysmal AF and 42% of patients with non-paryxysmal AF [11]. Advances in electroanatomical mapping have improved RFA therapy success rates, yet it would be greatly advantageous if the ablated tissue could be directly visualized during the procedure. While some success has been made with intraoperative MRI and preoperative CT with advanced three-dimensional reconstruction, these approaches are expensive, have significant equipment and space requirements, and are not always suitable for continuous live monitoring [12, 13].
We have recently demonstrated that thermal ablation lesions placed on rat cardiac ventricles can be visualized via loss of nicotinamide adenine dinucleotide (NADH) autofluorescence [14, 15]. NADH is an endogenous metabolic co-enzyme, present in all viable cells. RFA results in a disruption of normal cellular metabolism and an acute loss of NADH autofluorescence. This approach works exceptionally well in ventricular muscle that is primarily composed of cardiomyocytes, which are rich in NADH-producing mitochondria. However, the endocardial surface of the left atria, where most of RFA procedures are performed, is covered by layers of collagen and elastin. Autofluorescence of these proteins can therefore potentially mask the loss of NADH from the ablated muscle beneath.
Here, we explored autofluorescence hyperspectral imaging (aHSI), an optical imaging modality that captures and analyzes the complete spectrum of each pixel in an image, for its ability to visualize RFA lesions. in the left atria, the most clinically relevant anatomical location. To the best of our knowledge, no other methods are capable of revealing the contours of RFA lesions in the left atrium of large mammals at the spatial resolution of aHSI.
2. Materials and methods
2.1 Ablation protocol
Ablations were performed on freshly excised porcine tissues. Hearts were obtained from a local abattoir or after completion of surgical training at the Washington Institute of Surgical Endoscopy. Tissue was kept on ice during the experiments to prevent loss of chromophores and fluorophores. Radiofrequency energy was delivered using a 4 mm blazer catheter placed perpendicular to the endocardial surface. Lesions made by both irradiated and non-irradiated catheters were examined. Tip temperatures ranged between 50 to 70 °C. RFA durations varied from 5 to 30 seconds with a maximum power of 8 watts. A total of 40 RFA lesions made in 7 different animals were used to derive the quantitative and qualitative conclusions presented in this paper.
2.2 Hyperspectral imaging hardware
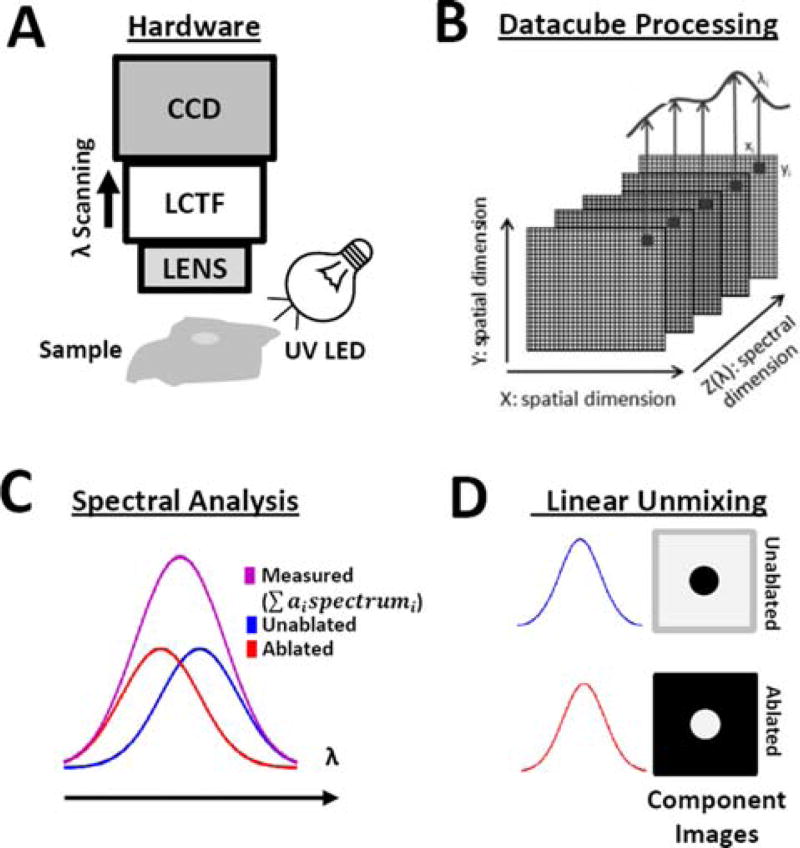
Figure 1 shows the diagram of the Nuance FX HSI system (PerkinElmer/Cri, Waltham, MA), which is comprised of a camera lens (Nikon AF Micro-Nikkor 60 mm f/2.8D Lens), liquid crystal tunable filter (CRi LCTF), and monochromatic charged-coupled device (Sony ICX285 CCD). The sample was illuminated with a 365 nm LED spotlight (Mightex, Pleasanton, CA) placed 5–8 cm away from the sample surface and angled to reduce specular reflection. The lens projected a 4 cm × 3 cm field-of-view onto a CCD composed of 1392 × 1040 pixels, yielding a spatial resolution of ∼30 µm/pixel. To acquire each hyperspectral datacube, the LCTF was sequentially tuned to wavelengths between 420–720 nm at a spectral resolution of 10 nm.
Figure 1.
HSI acquisition and processing steps. (A) Schematic showing the HSI imaging system, UV (365 nm) LED light source, and sample placement. CCD, coupled charged device; LCTF, liquid crystal tunable filter. (B) Acquired datacubes are processed on a pixel-by-pixel basis using linear unmixing. (C) Each pixel is assumed to be a linear combination of spectra from unablated and ablated tissue. (D) Linear unmixing results in component images showing unablated and ablated tissue, where the grayscale value of each pixel represents the relative abundance of each spectrum.
2.3 Hyperspectral imaging analysis
Datacubes were analyzed using linear unmixing, which assumes that each spectrum acquired by the HSI system is a linear combination of spectra from different types/states of tissue. Linear unmixing is typically formulated as a linear least squares problem: , where sdetected is a Mx1 column vector with the detected spectrum of each mixed pixel, s is a MxL matrix with the pure spectra of each tissue type, a is an Lx1 column vector of the abundance of each tissue type within the measured pixel, ε is a Mx1 column vector accounting for noise, and L is the number of tissue types. Solving this least squares problem finds the abundance of each tissue type within a pixel, a. For meaningful results, the linear unmixing process must reflect the physical process that occurs when a spectrum contains a mixture of multiple pure tissue spectra. Therefore, the least squares problem must be constrained so that all abundances are non-negative (ai ≥ 0) and that the abundances of each pixel sum to . For linear unmixing to be applied to a datacube, the user must first acquire spectra corresponding to ablated and unablated tissue. We tested three different methods to provide spectra to the linear unmixing algorithm:
-
a)
Supervised or Region-of-Interest based: This method works when the area of ablated tissue is known a priori, but the spectra are unknown. To briefly summarize: a user places regions-of-interest within areas of ablated and unablated tissue and the mean spectrum for each tissue type is calculated. These spectra can then be fed into the linear unmixing algorithm to identify the remaining lesions in the field-of-view.
-
b)
Real Component Analysis (RCA): RCA is a proprietary principal component analysis-based algorithm developed by PerkinElmer, Inc., to extract spectra from Nuance FX data-cube without a priori knowledge of the tissue composition [16]. This algorithm relies on a combination of unsupervised and supervised steps. First, the algorithm displays a set of images corresponding to main spectral signatures present in the data-cube. The user then selects the images that best correspond to lesions and unablated tissue.
-
c)
Library-based: Once the ablated and unablated spectra are computed by one of the two methods described above, their spectral library can be saved to be later applied to new datasets to classify pixels according to their spectra.
When provided with unablated and ablated spectra, the output of the linear unmixing algorithm are two component images. Each component image is a two-dimensional map of the relative abundance of that spectrum within a pixel. These component images are then combined into a pseudocolor composite image. In this manuscript we arbitrarily assigned red color to show unablated and green color to ablated tissue.
2.4 Spectral calibration
To quantify spectral changes caused by RFA ablation the following steps were taken:
An aHSI datacube was acquired with two spatial dimensions and one spectral dimension (x, y, λ).
Raw spectra from neighboring unablated and ablated regions of interest were extracted from the aHSI datacube: sunablated(λ) and sablated(λ).
Each raw spectrum was normalized between its minimum and maximum values to produce values between 0 and 1, yielding snunablated(λ) and snablated(λ).
Normalized spectra were divided by the product of CCD and LCTF spectral sensitivity curves provided by the manufacturer, yielding correctedsnunablated(λ) and correctedsnablated(λ).
The difference between ablated and unablated spectra was calculated: Δs(λ) = correctedsnunablated(λ) – correctedsnablated(λ).
Lastly, Δs(λ) was divided by the peak intensity value of correctedsnunablated(λ) to obtain a percentage change.
2.5 Gross pathology
2,3,5-Triphenyl-2H–tetrazolium chloride (TTC) staining was used to assess tissue necrosis. TTC staining relies on the ability of dehydrogenase enzymes and NADH present in viable tissue to react with tetrazolium salts to form a formazan pigment, which turns viable tissue crimson red while ablated tissue appears white. Immediately after the imaging studies were completed, tissue was placed in Tyrode’s solution containing 40 mM TTC. Overnight TTC staining enabled the dye to permeate the excised tissue which was then cross-sectioned and imaged. Lesion diameter was measured using ImageJ software package by an independent observer who took three independent measurements for each lesion. For histopathology, samples were fixed in 10% neutral buffered formalin, embedded in paraffin, and sectioned into 4 µm slices. Verhoeff-Van Gieson and standard H&E stains were then used to identify muscle, collagen, and elastin.
3. Results
3.1 Appearance and structure of atrial endocardium
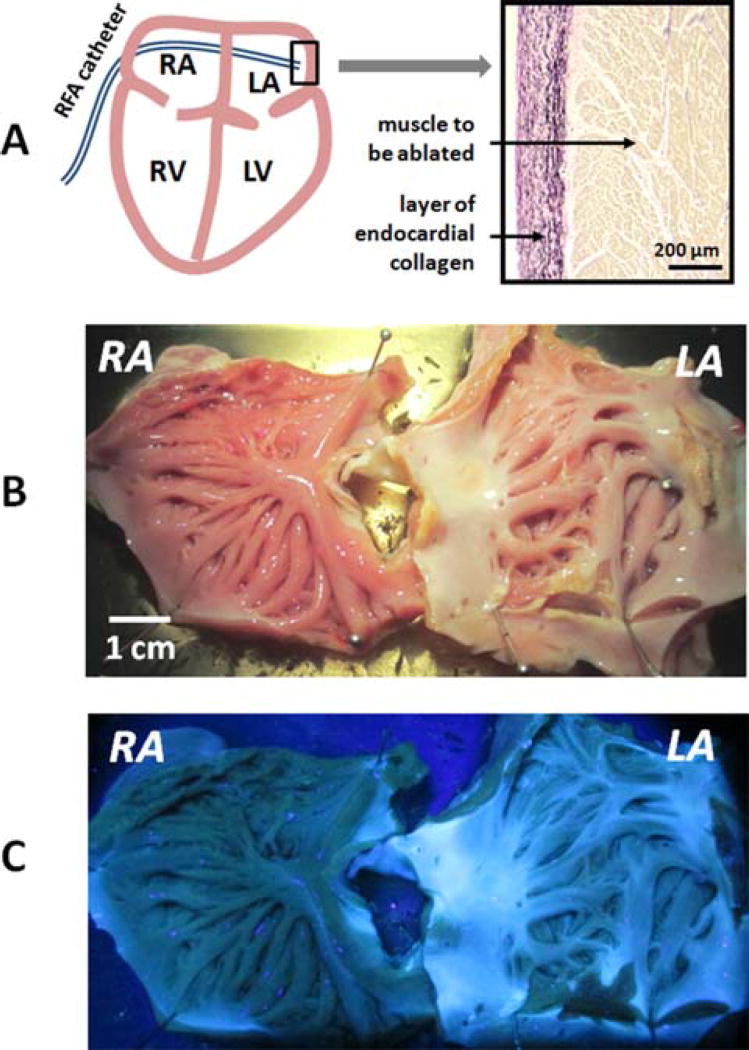
During AF ablation surgery, RFA catheter is inserted into the atrial space by a percutaneous access. It aims to destroy or isolate abnormal sources of activity that are primarily located near the orifices of the pulmonary veins located in the left atrium (Figure 2A). The endocardial surface of the right atrium has a more trabeculated morphology and is covered by a relatively thin layer of endocardial collagen. In contrast, the endocardial surface of left atrium is smooth and visibly whiter. Histology of the left atrium reveals dense, >200 micron thick endocardial layer composed of interwoven collagen and elastin fibers (Figure 2A). This layer makes RFA lesions placed on the endocardial surface of left atrium barely distinguishable under either white light or UV illumination (Figure 2B, C).
Figure 2.
Relevant anatomy and appearance of atria under white light and UV illumination. (A) A cartoon of a percutaneous RFA catheter entering the left atrial space. A small insert shows the histology of endocardial surface of left atrium with interspersed layers of collagen (pink) & elastin (black) covering the muscle (brown). (B) Excised and stretched porcine atria with multiple RFA lesions on the endocardial surface of left atrium. (C) UV illumination reveals an abundance of collagen and elastin in the left atrium and the limited visual contrast between ablated and unablated tissue.
3.2 aHSI greatly increases the contrast between ablated and unablated tissue
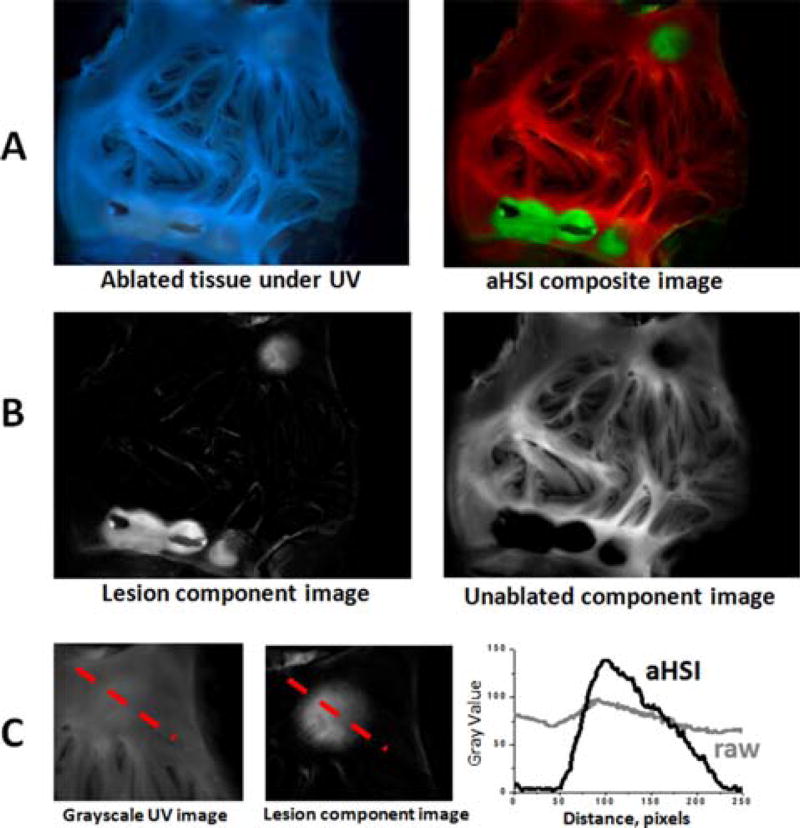
aHSI relies on subtle differences in the autofluorescence profiles of each pixel to classify them into different categories. A representative outcome of spectral unmixing is shown in Figure 3. The left panel of Figure 3A shows the visual appearance of left atrial tissue under 365 nm illumination. The five RFA lesions are barely distinguishable. The right panel of Figure 3A shows the result of aHSI unmixing where lesions contours and gaps between the lesions are clearly seen. This can be further confirmed by plotting intensity profiles as shown in Figure 3C. Images shown in Figure 3 are representative examples from a total of 40 lesions placed on freshly excised endocardium of left atrial tissue from 7 different pigs.
Figure 3.
Improved lesion visualization using aHSI. (A) Visual appearance of the ablated left atrial tissue under 365 nm illumination vs. the same tissue after a 420–720 nm aHSI datacube was acquired, processed and displayed as an aHSI composite image (green for ablated and red for unablated aHSI component images). (B) Corresponding component images. (C) Comparison of the intensity profiles across the RFA lesion from unprocessed grayscale UV image vs. aHSI lesion component image shows a significantly larger intensity change across the lesion.
3.3 Spectral changes enabling RFA visualization
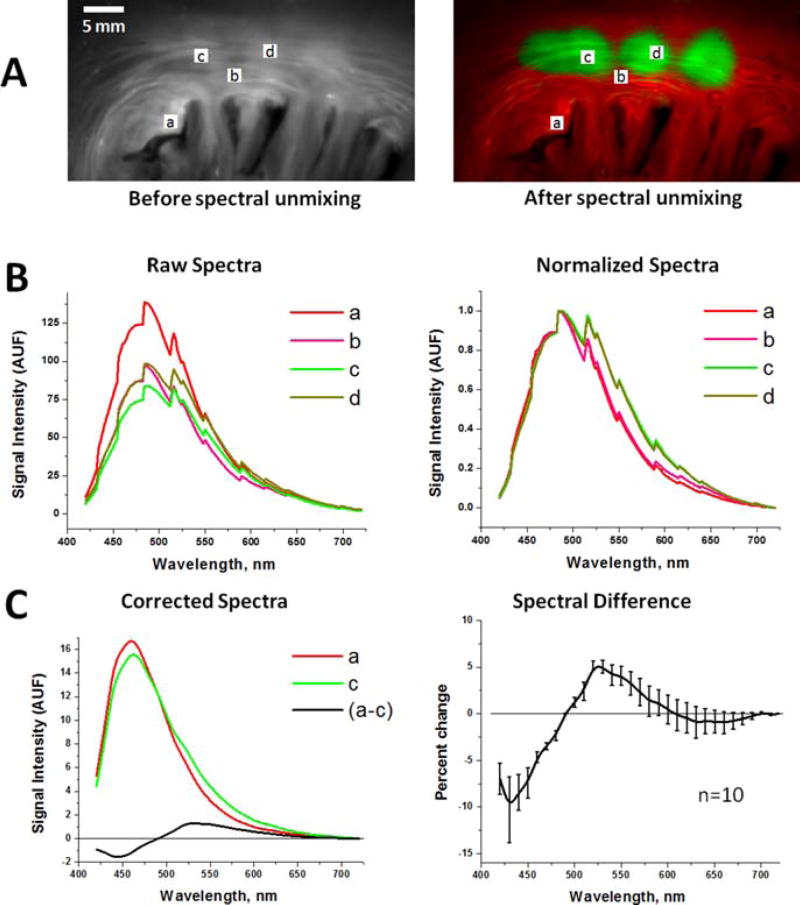
Figure 4 illustrates the spectral changes that underlie the ability of aHSI to delineate RFA lesions. Raw uncalibrated spectra sampled from various regions-of-interest show no obvious correlation with the ablation sites (Figure 4B, left panel). Yet, when the raw spectra are normalized between their minima and maxima, a consistent shift in the spectral profiles is observed (Figure 4B, right panel). Postprocessing algorithms then use such shifts to classify individual pixels. To reveal the true spectral differences, we accounted for the wavelength sensitivity of Nuance FX tunable filter and the spectral efficiency of its CCD chip (Figure 4C). RFA causes an increase in observed signal intensity above 490 nm and a decrease in observed signal intensity below 490 nm. HSI can rely on either or both of these changes to demarcate the lesions. We observed similar spectral shifts for RFA lesions of variable depths, types of catheters (i.e., irrigated vs. non-irrigated) and in different animal species, including sheep and cow (data not shown). We observed similar spectral shifts for RFA lesions of variable depths, types of catheters (i.e., irrigated vs. non-irrigated) and in different animal species, including sheep and cow (data not shown).
Figure 4.
Spectral changes used by aHSI for RFA lesion visualization. (A) Left: Endocardial surface of porcine left atrium under UV illumination. Right: An aHSI composite image of the same lesion. Four regions-of-interests (a–d) mark the areas from which the spectra shown were collected. Changing the location of the region of interest within each type of tissue had little effect on the outcomes of spectral unmixing. (B) Left: unprocessed raw spectra collected from the (a–d) regions-of-interests shown above. Right: the same spectra after normalization to their respective maximum and minimum values. (C) Left: Autofluorescence spectra from the region-of-interests (a) and the region-of-interests (c) after normalized spectra were adjusted for spectral sensitivity of the tunable filter and quantum efficiency of the CCD. Difference between the spectrum (a) and (c) is shown in black. Graph on the right shows spectral difference averaged from 10 lesions from three different animals.
3.4 Comparison of spectral unmixing algorithms
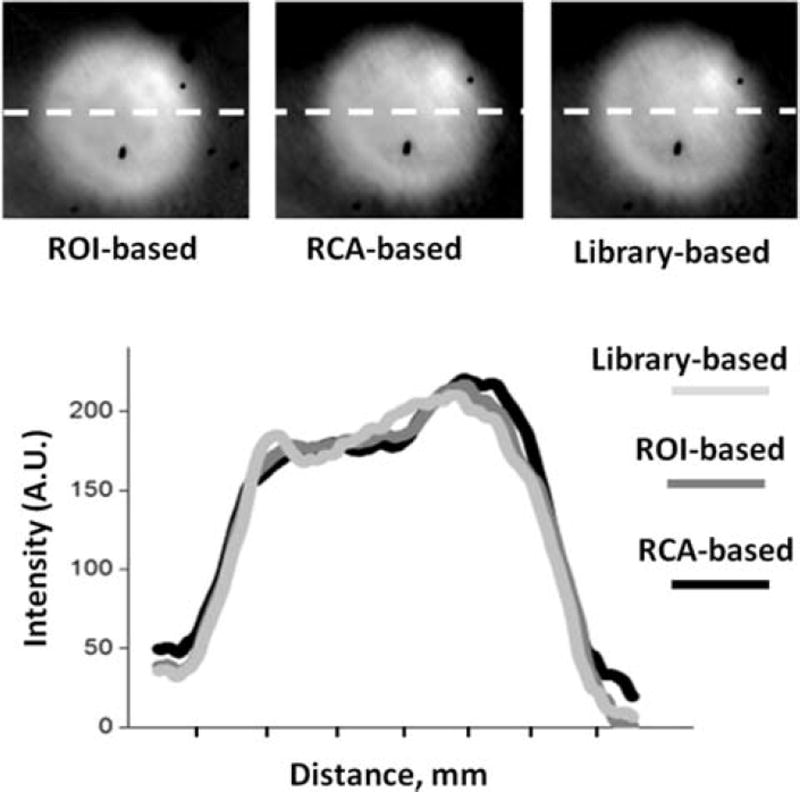
With few exceptions, different unmixing algorithms applied to the same aHSI datacube gave similar outcomes. This is illustrated by Figure 5, which shows the outcome of spectral unmixing based on i) region-of-interest, ii) real component analysis, or iii) applying a spectral library from another sample, all yielding similar visual results. This was further illustrated by plotting intensity profiles across the component images of the lesion (Figure 5, dotted white line).
Figure 5.
Outcome of different spectral unmixing algorithms. Lesion component images from the same aHSI stack were spectrally unmixed using three different postprocessing algorithms. Left: the outcome of supervised unmixing, in which the user manually places region-of-interest on ablated and unablated sites. Middle: the results from an unsupervised unmixing algorithm that uses real component analysis algorithm within the Nuance FX software. Right: a lesion component image revealed by a library or reference-based unmixing using spectra from a previously imaged sample. Intensity profiles across each image are plotted to show a close spatial concordance between the three postprocessing algorithms.
3.5 Comparison of spectral changes caused by RFA ablation in different types of cardiac tissue
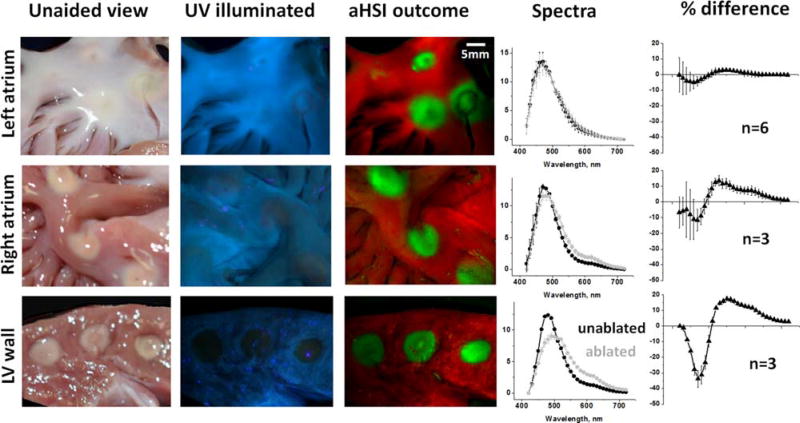
We focused primarily on visualizing ablations placed on endocardiac surface of left atrial tissue because of its clinical significance for AF treatment. Yet some ablation procedures are performed on ventricular muscle or right atrium [17, 18]. RFA lesions at these anatomical locations are more readily seen with the naked eye than those placed in the left atrium. This is because these sites have much less endocardial collagen and the thermally coagulated muscle shows up clearly as a pale yellow area (Figure 6, left). Figure 6 also illustrates that RFA causes fundamentally similar changes in the autofluorescence spectrum across all types of cardiac tissue, including ventricular muscle and both atria. Upon UV illumination, the measured intensity from ablated regions decreases within 420–490 nm range (as a result of a loss of NADH) and increases within 490– 700 nm (as a result of increased scattering of emitted photons). In the left atrium, a thick layer of highly scattering and autofluorescent endocardial collagen and elastin tends to obscure these spectral changes, reducing the difference between ablated and unablated tissue to a few percent. While subtle, these changes consistently allow aHSI to classify pixels, allowing it to significantly increase lesion contrast.
Figure 6.
Visual appearance of RFA lesions made in three different types of cardiac tissue, outcomes of aHSI unmixing and corresponding spectral changes. A typical appearance of endocardial surface of porcine left atrium under white light and UV illumination, followed by composite image derived ftom aHSI. On the right are spectra for unabalted and ablated tissue and the difference between them (expressed as % of peak autofluorence value, n indicates number of lesions). The next two rows show representative images and traces of RFA lesions made on the endocardial surface of right atrium and cross-sectioned left ventricular wall.
3.6 Validation of RFA lesion visualization by gross pathology
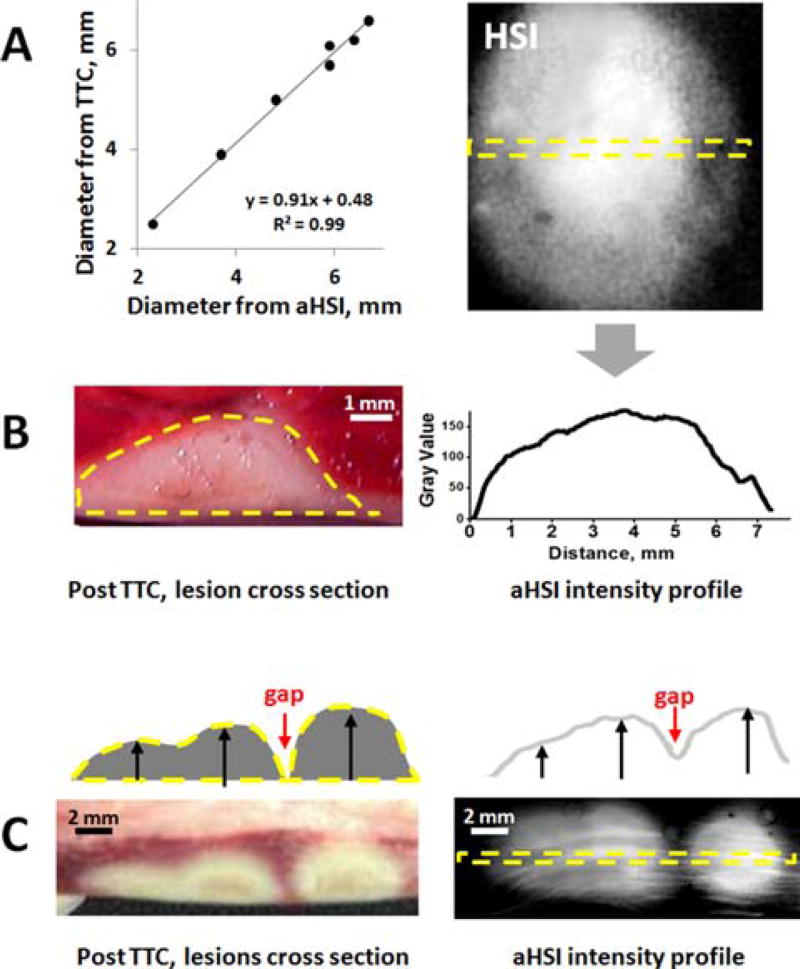
Finally, we confirmed that lesion surface dimensions derived from the aHSI component images matched gross pathology. For the latter the ablated tissue was stained overnight with TTC, cross-sectioned across the corresponding line on aHSI image, and the lesion diameter at the endocardial surface was measured (Figure 7). The data revealed a near perfect correlation between the two (R = 0.99).
Figure 7.
Correlation of aHSI findings with gross pathology. (A) Graph shows a close correlation between lesion diameter values derived from gross pathology and aHSI profle (R = 0.99, p < 0.01, n = 7 lesions). (B) Cross-section of the lesions after TTC-staining revealed a close match between their depth and intensity profile of aHSI lesion component images. (C) An example of multiple lesions with gap in between: TTC staining vs intensity profile of corresponding aHSI lesion component.
Although the main goal of this paper was to demonstrate the ability of aHSI to outline lesions contours with high spatial resolution, when lesion depth was compared with the intensity profile derived from lesion component they were strikingly similar (Figure 7B). This was true for both single and multiple lesions (Figure 7C). This intriguing observation calls for a more systematic assessment of ability of aHSI to reveal lesion depth, a direction that we are currently pursuing.
4. Discussion
Minimally invasive AF therapy is performed by threading a percutaneous catheter into the left atrium and placing thermal ablation lesions to isolate or destroy regions of abnormal electrical activity. Failure of RFA therapy is commonly ascribed to an incomplete placement of lesions that later result in AF recurrence [6, 10]. This problem can be curtailed if clinicians could directly visualize lesion formation along with the degree of tissue damage. Our group has previously shown that it is possible to visualize RFA lesions in rat cardiac tissue by the loss of NADH autofluorescence [14, 15]. However, as we moved to larger animals, our studies also suggested that NADH-based visualization can be confounded by the thick and heterogeneous collagen layer on the endocardial surface of the left atrium. Considering that the atrial collagen thickness is known to increase with age, we felt the need to explore additional methods for RFA lesion visualization [19, 20].
During RFA of atrial tissue, both the upper (collagen & elastin) and lower (primarily muscle) layers are heated to temperatures exceeding 50 °C. As the temperature increases, the autofluorescence of the collagen layer reversibly declines and, together with the NADH loss, can be used to indicate the degree of tissue damage in real time – a direction we are also exploring [21, 22]. However, once the ablation is stopped and tissue cools back to physiological temperatures, the autofluorescence of the collagen layer returns to near its original values, in contrast to the irreversible loss of NADH autofluorescence [15]. We hypothesize that this is the source of the decrease in measured autofluorescence emission profile of RFA lesions at wavelengths less than 490 nm observed in RFA lesions.
Heating also results in thermal coagulation and decreased water content within the lesion [23, 24]. Overall, these two effects combined lead to an increase in scattering and absorption due to increased density of chromophores and tissue coagulation [25, 26]. But because the scattering coefficient is an order of magnitude greater than the absorption coefficient in cardiac tissue, we and others have observed an overall increase in diffuse reflectance across the visible range [14, 26–28]. We believe that this increase in scattering is the main source of the changes in measured autofluorescence emission profile of RFA lesions at wavelengths above 490 nm. While the observed spectral changes are relatively subtle (<10% change from the peak signal intensity), they are consistent across all samples we have tested to date.
Other optical approaches have been suggested as potential means to enable RFA ablation guidance. One of such promising techniques is optical coherence tomography [29–31]. While OCT can inherently reveal lesion depth, it can only measure structural changes and does not acquire any functional information about cellular viability within the lesion. OCT ability to visualize over a wide field is also limited. Photoacoustic imaging also offers the possibility of evaluating lesion depth, however ultrasound-based detection systems typically exhibit low spatial resolution [32]. Another interesting approach is the use of Stokes-Müeller polarimetry to reveal RFA lesions by assessing changes in the scattering coefficient and anisotropy [33]. Near infrared reflectance spectroscopy (NIRS) has been also explored for atrial lesion identification [34–36]. Notably, with very few exceptions, all of the above techniques have been tested in porcine ventricles where RFA lesions can be readily identified with the naked eye. Only a handful of studies so far has been done in atrial tissue, the main anatomical site of AF ablation procedures [31, 34].
For the purpose of future clinical implementation of the aHSI it is important to briefly discuss its main strengths and limitations. The main advantage of aHSI is that lesion detection is possible without any additional dyes or contrast agents. Instead, it relies on the amalgamated changes in tissue absorption, scattering, and endogenous fluorescence. The main disadvantage of using autofluorescence is the low quantum yield of the fluorophores, which limits the amount of light returning to the detector. This is especially true when compounded with the limited collection efficiency through the fiber bundle of a potential percutaneous visualization catheter. However, there are ways to resolve this limitation. First, one can significantly optimize photon collection by binning spectral bands. Secondly, one can gate aHSI acquisition to ECG or electrocardiography [37]. This way each aHSI acquisition is coupled to a specific time point within the cardiac cycle that enables accumulating an image across multiple beats. Another foreseeable limitation is the speed of acquisition and processing. The aHSI configuration we tested was not suitable to create component images of the lesions in real-time. However, recent snapshot HSI systems are capable of collecting both the spatial and spectral information in significantly less time [38]. The most promising approach may be to first identify the key wavelengths bands for discrimination between ablated and unablated tissue and then use a multichannel splitter to image several wavelength bands simultaneously [39]. Pixel classification and mapping can also take time if lesion visualization is achieved through fitting a reference spectrum to each pixel spectrum in a least-squares sense. Newer processing methods offer the promise of faster and more computationally efficient processing methods that could be adapted for real-time pixel classification [40–42].
Clinical application of aHSI for non-invasive AF therapy guidance would require the development of a percutaneous visualization catheter. Fiber-based delivery of UV in the percutaneous catheter involves specialized optics, but it has been successfully accomplished by our group as well as others [21, 43, 44]. A potential concern is adverse effects of UV illumination on cardiac tissue. Yet 365 nm wavelength we have been using is considered UVA1 (340– 400 nm), the latter range bordering with visible light. As such, 365 nm illumination, at intensity and duration needed to acquire aHSI datasets, exerts no adverse effects on tissue viability. We used the same illumination in our previous studies on metabolic effects of arrhythmias [45, 46]. Even when it was used for much longer durations that we now use for aHSI acquisition, it did not cause any measurable adverse effects on either the mechanical, metabolic or electrical activity of the heart [45–47].
The future percutaneous aHSI catheter will have to include an inflatable balloon that displaces the blood between tip of the catheter and the tissue. Afterwards, the presence of the blood within the tissue should have minimal effects on the ability of aHSI to reveal the lesions. This is because blood within large and medium size vessels does not contribute significantly to the spectral features of returning light since virtually all visible light is absorbed by red blood cells during transit through these vessels [48]. And, since the amount of red blood cells in capillary circulation does not exceed <1% of total tissue volume, their spectral contribution to the acquired spectra is known to be minimal [48–50].
5. Conclusions
We demonstrated the feasibility of autofluorescence-based hyperspectral imaging for the assessment of cardiac tissue damage during RFA therapy. This imaging technique could be used to visualize ablated endocardial surface of the pulmonary vein area and reveal interlesional gaps with high spatial resolution. This information can improve procedural success, lower the rate of AF recurrence, and reduce the burden of repeated AF treatments on the healthcare system.
Acknowledgments
These studies were supported by the NIH R41 HL120511 award and LuxCath-GWU Research agreement. We thank Drs. Omar Amirana, Kenneth Armstrong, Terry Ransbury, Stanislav Emelianov, and Nikki Posnack for helpful discussions. Editorial assistance of Meredith Sherman and Shane Miller Swift is gratefully acknowledged.
Footnotes
Author biographies Please see Supporting Information Online.
References
- 1.Deshpande S, Catanzaro J, Wann S. Card. Electrophysiol. Clin. 2014;6:1–4. doi: 10.1016/j.ccep.2013.10.006. [DOI] [PubMed] [Google Scholar]
- 2.Chen SA, Hsieh MH, Tai CT, Tsai CF, Prakash VS, Yu WC, Hsu TL, Ding YA, Chang MS. Circulation. 1999;100:1879–1886. doi: 10.1161/01.cir.100.18.1879. [DOI] [PubMed] [Google Scholar]
- 3.Narayan SM, Krummen DE, Shivkumar K, Clopton P, Rappel WJ, Miller JM. J. Am. Coll. Cardiol. 2012;60:628–636. doi: 10.1016/j.jacc.2012.05.022. [DOI] [PMC free article] [PubMed] [Google Scholar]
- 4.Atienza F, Almendral J, Ormaetxe JM, Moya A, Martínez-Alday JD, Hernández-Madrid A, Castellanos E, Arribas F, Arias MÁ, Tercedor L, Peinado R, Arcocha MF, Ortiz M, Martínez-Alzamora N, Arenal A, Fernández-Avilés F, Jalife J. J. Am. Coll. Cardiol. 2014;64:2455–2467. doi: 10.1016/j.jacc.2014.09.053. [DOI] [PubMed] [Google Scholar]
- 5.Cappato R, Calkins H, Chen SA, Davies W, Iesaka Y, Kalman J, Kim YH, Klein G, Natale A, Packer D, Skanes A, Ambrogi F, Biganzoli E. Circ. Electrophysiol. 2010;3:32–38. doi: 10.1161/CIRCEP.109.859116. [DOI] [PubMed] [Google Scholar]
- 6.Arujuna A, Karim R, Caulfield D, Knowles B, Rhode K, Schaeffter T, Kato B, Rinaldi CA, Cooklin M, Razavi R, O’Neill MD, Gill J. Circ. Arrhythm. Electrophysiol. 2012;5:691–700. doi: 10.1161/CIRCEP.111.966523. [DOI] [PubMed] [Google Scholar]
- 7.Ouyang F, Tilz R, Chun J, Schmidt B, Wissner E, Zerm T, Neven K, Köktürk B, Konstantinidou M, Metzner A, Fuernkranz A, Kuck KH. Circulation. 2010;122:2368–2377. doi: 10.1161/CIRCULATIONAHA.110.946806. [DOI] [PubMed] [Google Scholar]
- 8.Oral H, Knight BP, Ozaydin M, Tada H, Chugh A, Hassan S, Scharf C, Lai SWK, Greenstein R, Pelosi F, Strickberger SA, Morady F. J. Am. Coll. Cardiol. 2002;40:100–104. doi: 10.1016/s0735-1097(02)01939-3. [DOI] [PubMed] [Google Scholar]
- 9.Wokhlu A, Hodge DO, Monahan KH, Asirvatham SJ, Friedman PA, Munger TM, Cha Y-M, Shen W-K, Brady PA, Bluhm CM, Haroldson JM, Hammill SC, Packer DL. J. Cardiovasc. Electrophysiol. 2010;21:1071–1078. doi: 10.1111/j.1540-8167.2010.01786.x. [DOI] [PubMed] [Google Scholar]
- 10.Badger TJ, Daccarett M, Akoum NW, Ad-jei-Poku YA, Burgon NS, Haslam TS, Kalvaitis S, Kuppahally S, Vergara G, McMullen L, Anderson PA, Kholmovski E, MacLeod RS, Mar-rouche NF. Circ. Arrhythm. Electrophysiol. 2010;3:249–259. doi: 10.1161/CIRCEP.109.868356. [DOI] [PMC free article] [PubMed] [Google Scholar]
- 11.Ganesan AN, Shipp NJ, Brooks AG, Kuklik P, Lau DH, Lim HS, Sullivan T, Roberts-Thomson KC, Sanders P. J. Am. Heart Assoc. 2013;2:e004549. doi: 10.1161/JAHA.112.004549. [DOI] [PMC free article] [PubMed] [Google Scholar]
- 12.Ranjan R, Kholmovski EG, Blauer J, Vijayakumar S, Volland NA, Salama ME, Parker DL, MacLeod R, Marrouche NF. Circ. Arrhythm. Electrophysiol. 2012;5:1130–1135. doi: 10.1161/CIRCEP.112.973164. [DOI] [PMC free article] [PubMed] [Google Scholar]
- 13.Kistler PM, Rajappan K, Jahngir M, Earley MJ, Harris S, Abrams D, Gupta D, Liew R, Ellis S, Sporton SC, Schilling RJ. J. Cardiovasc. Electrophysiol. 2006;17:1093–1101. doi: 10.1111/j.1540-8167.2006.00594.x. [DOI] [PubMed] [Google Scholar]
- 14.Swift L, Gil DAB, Jaimes R, Kay M, Mercader M, Sarvazyan N. Circ. Arrhythm. Electrophysiol. 2014 doi: 10.1161/CIRCEP.114.001750. [DOI] [PMC free article] [PubMed] [Google Scholar]
- 15.Mercader M, Swift LM, Sood S, Asfour H, Kay MW, Sarvazyan N. Am. J. Physiol. Hear. Circ. Physiol. 2012;302:H2131–H2138. doi: 10.1152/ajpheart.01141.2011. [DOI] [PMC free article] [PubMed] [Google Scholar]
- 16.Mansfield JR, Gossage KW, Hoyt CC, Levenson RM. J. Biomed. Opt. 2005;10:41207. doi: 10.1117/1.2032458. [DOI] [PubMed] [Google Scholar]
- 17.Khoury DS, Rao L, Ding C, Sun H, Youker KA, Panescu D, Nagueh SF. J. Cardiovasc. Electrophysiol. 2004;15:1078–1087. doi: 10.1046/j.1540-8167.2004.04087.x. [DOI] [PubMed] [Google Scholar]
- 18.Sánchez-Quintana D, Doblado-Calatrava M, Cabrera JA, Macías Y, Saremi F. Biomed Res. Int. 2015;2015:547364. doi: 10.1155/2015/547364. [DOI] [PMC free article] [PubMed] [Google Scholar]
- 19.Schwartzman D, Schoedel K, Stolz DB, Di Martino E. Europace. 2013;15:1557–1561. doi: 10.1093/europace/eut099. [DOI] [PubMed] [Google Scholar]
- 20.Nguyen BL, Fishbein MC, Chen LS, Chen P-S, Masroor S. Heart Rhythm. 2009;6:454–460. doi: 10.1016/j.hrthm.2009.01.010. [DOI] [PMC free article] [PubMed] [Google Scholar]
- 21.Armstrong K, Ransbury T, Reddy VY, Koruth J, Amirana O, Mercader MA, Sarvazyan N, Larson C, Bowen J. Heart Rhythm. 2015;12(5):S117. [Google Scholar]
- 22.Koruth J, Kusa S, Dukkipati S, Neuzil P, Ransbury T, Armstrong K, Larson L, Cinnamon Bowen, Omar A, Mercader M, Sarvazyan N, Kay M, Reddy VY. Heart Rhythm. 2015;12(5):S111. [Google Scholar]
- 23.Zhu Q, Shen Y, Zhang A, Xu LX. Biomed. Eng. Online. 2013;12:127. doi: 10.1186/1475-925X-12-127. [DOI] [PMC free article] [PubMed] [Google Scholar]
- 24.Thomsen S, Jacques S, Flock S. Laser-Tissue Interaction. 1990;1202:2–11. [Google Scholar]
- 25.Çilesiz IF, Welch AJ. Appl. Opt. 1993;32:477. doi: 10.1364/AO.32.000477. [DOI] [PubMed] [Google Scholar]
- 26.Agah R, Gandjbakhche AH, Motamedi M, Nos-sal R, Bonner RF. IEEE Trans. Biomed. Eng. 1996;43:839–846. doi: 10.1109/10.508546. [DOI] [PubMed] [Google Scholar]
- 27.Pickering JW, Bosman S, Posthumus P, Blokland P, Beek JF, van Gemert MJ. Appl. Opt. 1993;32:367–371. doi: 10.1364/AO.32.000367. [DOI] [PubMed] [Google Scholar]
- 28.Swartling J, Pålsson S, Platonov P, Olsson SB, Andersson-Engels S. Med. Biol. Eng. Comput. 2003;41:403–409. doi: 10.1007/BF02348082. [DOI] [PubMed] [Google Scholar]
- 29.Fleming CP, Wang H, Quan KJ, Rollins AM. J. Biomed. Opt. 2010;15:030516. doi: 10.1117/1.3459134. [DOI] [PMC free article] [PubMed] [Google Scholar]
- 30.Herranz D, Lloret J, Jiménez-Valero S, Rubio-Guivernau JL, Margallo-Balbás E. Biomed. Opt. Express. 2015;6:3268–3275. doi: 10.1364/BOE.6.003268. [DOI] [PMC free article] [PubMed] [Google Scholar]
- 31.Gan Y, Tsay D, Amir SB, Marboe CC, Hendon CP. J. Biomed. Opt. 2016;21:101407. doi: 10.1117/1.JBO.21.10.101407. [DOI] [PMC free article] [PubMed] [Google Scholar]
- 32.Dana N, Di Biase L, Natale A, Emelianov S, Bouchard R. Heart Rhythm. 2014;11:150–157. doi: 10.1016/j.hrthm.2013.09.071. [DOI] [PMC free article] [PubMed] [Google Scholar]
- 33.Ahmad I, Gribble A, Ikram M, Pop M, Vit-kin A. J. Biophotonics. 2016;9:750–759. doi: 10.1002/jbio.201500184. [DOI] [PubMed] [Google Scholar]
- 34.Singh-Moon RP, Yao X, Marboe CC, Hendon CP. Biomedical Optics. 2016;2016 JTu3A.39. [Google Scholar]
- 35.Demos SG, Sharareh S. Opt. Express. 2008;16:15286. doi: 10.1364/oe.16.015286. [DOI] [PubMed] [Google Scholar]
- 36.Singh-Moon RP, Marboe CC, Hendon CP. Biomed. Opt. Express. 2015;6:2494. doi: 10.1364/BOE.6.002494. [DOI] [PMC free article] [PubMed] [Google Scholar]
- 37.Gioux S, Ashitate Y, Hutteman M, V Frangioni J. J. Biomed. Opt. 2009;14:064038. doi: 10.1117/1.3275473. [DOI] [PMC free article] [PubMed] [Google Scholar]
- 38.Hagen N, Kudenov MW. Opt. Eng. 2013;52:090901. [Google Scholar]
- 39.Hendargo HC, Zhao Y, Allenby T, Palmer GM. Opt. Lett. 2015;40:3292–3295. doi: 10.1364/OL.40.003292. [DOI] [PMC free article] [PubMed] [Google Scholar]
- 40.Bjorgan A, Milanic M, Randeberg LL. J. Biomed. Opt. 2014;19:066003. doi: 10.1117/1.JBO.19.6.066003. [DOI] [PubMed] [Google Scholar]
- 41.Elliott AD, Gao L, Ustione A, Bedard N, Kester R, Piston DW, Tkaczyk TS. J. Cell Sci. 2012;125:4833–4840. doi: 10.1242/jcs.108258. [DOI] [PMC free article] [PubMed] [Google Scholar]
- 42.Lopez S, Moure JF, Plaza A, Callico GM, Lopez JF, Sarmiento R. IEEE Geosci. Remote Sens. Lett. 2013;10:1070–1074. [Google Scholar]
- 43.Mercader MA, Swift LM, Jaimes R, III, Armstrong KC, Ransburry T, Amirana O, Sarvazyan NA, Kay MW. 34th Annual Scientific Sessions of the Heart Rhythm Society; Denver, CO. 2013. [Google Scholar]
- 44.Nakai K, Morimoto Y, Arai T, Ito H, Kominami M, Matsuo H, Kikuchi M. Front. Med. Biol. Eng. 1999;9:241–248. [PubMed] [Google Scholar]
- 45.Swift L, Martell B, Khatri V, Arutunyan A, Sarvazyan N, Kay M. Physiol. Meas. 2008;29:269–279. doi: 10.1088/0967-3334/29/2/009. [DOI] [PMC free article] [PubMed] [Google Scholar]
- 46.Kay M, Swift L, Martell B, Arutunyan A, Sarvazyan N. Am. J. Physiol. Hear. Circ. Physiol. 2008;294:H2400–H2405. doi: 10.1152/ajpheart.01158.2007. [DOI] [PMC free article] [PubMed] [Google Scholar]
- 47.Asfour H, Wengrowski AM, Jaimes R, III, Swift LM, Kay MW. J. Vis. Exp. 2012;65:1–7. doi: 10.3791/4115. [DOI] [PMC free article] [PubMed] [Google Scholar]
- 48.Gandjbakhche AH, Bonner RF, Arai AE, Balaban RS. Am J Physiol Hear. Circ Physiol. 1999;277:H698–H704. doi: 10.1152/ajpheart.1999.277.2.H698. [DOI] [PubMed] [Google Scholar]
- 49.Silverman DA, Rakusan K. Microvasc. Res. 1996;52:143–156. doi: 10.1006/mvre.1996.0050. [DOI] [PubMed] [Google Scholar]
- 50.Pries AR, Kanzow G, Gaehtgens P. Am J Physiol Hear. Circ Physiol. 1983;245:H167–H177. doi: 10.1152/ajpheart.1983.245.1.H167. [DOI] [PubMed] [Google Scholar]


