

Abstract
Mass spectrometry (MS)-based top-down proteomics is a powerful method for the comprehensive analysis of proteoforms that arise from genetic variations and post-translational modifications (PTMs). However, top-down MS analysis of high molecular weight (MW) proteins remains challenging mainly due to the exponential decay of signal-to-noise ratio with increasing MW. Size exclusion chromatography (SEC) is a favored method for size-based separation of biomacromolecules, but typically suffers from low resolution. Herein, we developed a serial size exclusion chromatography (sSEC) strategy to enable high-resolution size-based fractionation of intact proteins (10–223 kDa) from complex protein mixtures. The sSEC fractions could be further separated by reverse phase chromatography (RPC) coupled online with high-resolution MS. We have shown that 2D sSEC-RPC allowed for the identification of 4044 more unique proteoforms and a 15-fold increase in the detection of proteins above 60 kDa, compared to 1D RPC. Notably, effective sSEC-RPC separation of proteins significantly enhanced the detection of high MW proteins up to 223 kDa, and also revealed low abundance proteoforms that are post-translationally modified. This sSEC method is MS-friendly, robust and reproducible, and thus, can be applied to both high-efficiency protein purification and large-scale proteomics analysis of cell or tissue lysate for enhanced proteome coverage, particularly for low abundance and high MW proteoforms.
INTRODUCTION
Top-down mass spectrometry (MS)-based proteomics is the method of choice for the comprehensive analysis of intact proteins to facilitate the structural and functional characterization of myriad proteoforms1 (a term encompassing all protein products of a single gene arising from genetic variation, alternative mRNA splicing, and protein post-translational modifications (PTMs)), and holds great promise for providing novel insights into cellular signal transduction and regulation, as well as disease mechanisms.2–9 However, top-down MS analysis of high molecular weight (MW) proteins remains challenging due to the high complexity and wide dynamic range of the human proteome and an exponential decay in the signal-to-noise ratio (S/N) of proteins with increasing MW,10 especially for those coeluting with low MW proteins. Thus, size-based protein separation is necessary for the detection and characterization of high MW proteins by top-down MS.
The development of multiplexed gel-eluted liquid fraction entrapment electrophoresis (GELFrEE)11–14 allowed for the separation of intact proteins based on size, and enabled a deep coverage of the human proteome when coupled with isoelectric focusing and reverse phase chromatography (RPC). In addition, significant progress has been made in the analysis of proteins in the range of 30 – 80 kDa with the use of GELFrEE coupled with capillary zone electrophoresis.15 Although GELFrEE achieves high-resolution separation, the use of the MS-incompatible surfactant, SDS, during the size-sorting step necessitates detergent removal procedures such as protein precipitation, which results in detrimental sample loss, particularly for low abundance and high MW proteins.
Size exclusion chromatography (SEC) is an appealing alternative to the gel-based methods for the fractionation and separation of proteins based on size or hydrodynamic volume.10,16,17 SEC has advantages over many other liquid chromatography (LC) methods owing to its high compatibility with various solvent systems and reduced sample loss due to minimal interaction between the analytes and the stationary phase. Therefore, SEC has been extensively employed for the analysis of antibody-drug conjugates and the assessment of drug purity.18,19 However, SEC has conventionally been considered a low-resolution chromatographic method accompanied by sample dilution,20 and therefore, has not been widely used for the fractionation of highly complex protein mixtures. Although a previous study coupling SEC with RPC for the analysis of cell lysate allowed for the identification of over 370 proteins with low MW (<40 kDa),21 top-down analysis of high MW proteins (>60 kDa) remains challenging due to the low resolution and separation power of the conventional SEC methods.
Herein, we introduce serial size exclusion chromatography (sSEC) to enable high-resolution size-based separation of intact proteins over a broad MW range. We employed sSEC for the fractionation of a complex protein mixture extracted from the cardiac sarcomeric subproteome consisting of proteins ranging from 10 to 223 kDa, and demonstrated high-resolution separation via the combination of different pore sizes in series and an increase in effective separation length. A two-dimensional (2D) platform combining sSEC with RPC surpasses 1D RPC for the analysis of the sarcomeric protein mixture with 4044 more unique proteoforms identified. Notably, there was a 15-fold increase in the number of high MW proteoforms (> 60 kDa) detected by top-down MS using the 2D method. This sSEC method is MS-friendly, robust and versatile, and therefore, can be applied to large-scale proteomics analysis of cell or tissue lysate and purification of high MW proteins.
EXPERIMENTAL PROCEDURES
Chemicals and reagents
All reagents were purchased from Sigma Aldrich Inc. (St. Louis, MO, USA) unless otherwise noted. HPLC grade H2O, acetonitrile, ethanol, and ultracentrifugal 10 kDa molecular weight cut-off (MWCO) filters (0.5 mL) were purchased from Fischer Scientific (Fair Lawn, NJ, USA). 10–20% precast Criterion Tris-HCl gels for SDS-PAGE were purchased from Bio-Rad Laboratories (Hercules, CA, USA).
Preparation of Cardiac Protein Extract
Donor heart tissue was obtained from University of Wisconsin Hospital and Clinics according to the protocol approved by the Institutional Review Board of University of Wisconsin-Madison as described previously.22 Detailed procedures and reagents regarding the extraction of cardiac sarcomeric subproteome are included in the supporting information.
Serial Size Exclusion Chromatography
SEC and sSEC experiments were performed using an ACQUITY H-class UPLC system (Waters, Milford, MA, USA) equipped with a UV detector and an automatic fraction collector. PolyHYDROXYETHYL A (PolyHEA) columns (single or in series) from PolyLC Inc. (Columbia, MD, USA) were used for all experiments. For SEC with a single column, columns (200 mm × 9.4 mm, 3 μm) with pore sizes 1000 Å, 500 Å, and 300 Å were evaluated individually. For sSEC with two columns (2sSEC), one 1000 Å column was connected in series with one 500 Å column using capillary tubing (Valco PEEK tubing, 100 um i.d., 2 cm). Similarly, sSEC with three columns (3sSEC) combined one 1000 Å and two 500 Å columns in series (1000 Å - 500 Å - 500 Å). Sarcomeric proteins were separated isocratically at a flow rate of 0.5 mL/min using 1% FA in H2O. Time-based automatic fraction collection was performed using the Waters Fraction Manager System. The detailed description of sSEC fraction collection is included in the supporting information.
Reverse Phase Chromatography and Top-down MS analysis
5 μL of the desalted sarcomeric protein extract or each sSEC fraction was injected into a PLRP column (1000 Å, 250 mm × 0.5 mm, 10 μm) and separated by RPC using an ACQUITY M-class 2D UPLC system (Waters, Milford, MA, USA) configured to bypass the first LC dimension. Sarcomeric proteins were eluted by a gradient of 20% to 95% mobile phase B (Mobile phase A: 0.1% FA in H2O, mobile phase B: 0.1% FA in 50:50 acetonitrile: ethanol) at a constant flow rate of 8 μL/min.
Proteins eluted were analyzed by a MaXis II quadrupole-time of flight (Q-TOF) mass spectrometer (Bruker Daltonics, Bremen, Germany) via electrospray ionization. The end plate offset and capillary voltage were 500 V and 4500 V, respectively. Nebulizer pressure was set to 0.5 Bar and dry gas flow rate was 4.0 L/min. Mass spectra were taken at a scan rate of 0.5 Hz over 500–2000 m/z range.
Targeted MS/MS was performed for Fraction 5 and 7 from the 3sSEC experiment based on the prevalence of high MW proteins in these fractions. The elution time and most abundant charge states of the target proteins were determined from the previous MS runs. Precursor ions of the protein of interest were isolated in the quadrupole and fragmented in the collision cell over the time segment where the protein of interest eluted. MS/MS was performed using collisionally activated dissociation (CAD, 15–20 eV). The same MS/MS runs were repeated with adjusted collisional energy to ensure optimal fragmentation for individual proteins.
Data Analysis, Protein Identification, and Proteoform Profiling
All data were processed and analyzed using the DataAnalysis software (Bruker, version 4.3) and deconvoluted using Maximum Entropy.23 Mass lists were output for protein identification using MS-Align+ algorithm and all identifications were manually validated using the MASH Suite Pro software.24,25 The detailed procedures regarding data analysis, protein identification, and proteoform profiling are included in the supporting information.
RESULTS AND DISCUSSION
High-resolution Size-based Separation of Intact Proteins by sSEC
Size-based protein separation is critical for the detection and characterization of high MW proteins by top-down MS. Conventional SEC methods suffer from low resolution due to significant band broadening primarily as a consequence of slow mass transfer in the packing pores, which limits the number of baseline-separated compounds.26,27 Consequently, SEC has been primarily used to analyze simple mixtures of biomacromolecules. Therefore, we sought to develop an SEC method for the high-resolution separation of proteins from a complex mixture. The separation efficiency was evaluated by SDS-PAGE analysis according to the number of proteins that coeluted within a defined chromatographic interval (1 min), as well as the MW range of all the proteins that coeluted in the same fraction. Specifically, a smaller number of coeluting proteins within the same chromatographic interval, and a narrower MW range of all the proteins that coeluted in a same fraction, were indicative of better separation.
To enable size-based separation of individual proteins rather than protein complexes, we employed a denaturing condition by using 1% FA (pH 1.8) as the mobile phase to facilitate protein unfolding and complex dissociation. We first evaluated the fractionation range of individual SEC columns with different pore size (1000 Å, 500 Å, or 300 Å) under the denaturing condition (Figure S1). The SEC column with 500 Å pore size provided better separation than 300 Å, with less proteins coeluted in each fraction within every 1 min chromatographic interval, and a narrower MW range for the proteins eluted in each fraction (Figure S1A, B). Moreover, an SEC column with 1000 Å pore size provided significantly better separation of the high MW proteins (> 60 kDa) from the intermediate (35–60 kDa) MW ones, with predominantly high MW proteins present in the earliest four fractions (Figure S1B, C).
To achieve efficient size-based separation over a broad MW range, we explored serial SEC (sSEC) by combining two SEC columns with 1000 Å and 500 Å pore size (termed 2sSEC). This would allow for better separation of high MW protein from intermediate MW ones, as well as the intermediate from low MW proteins. In comparison with SEC with a single column of 500 Å pore size, the addition of a column with 1000 Å pore size resulted in significant improvement in the separation of the high MW proteins (> 60 kDa) from the intermediate MW ones (35 – 60 kDa) (Figure 1A, B). In addition, the overall separation improved with 2sSEC compared to SEC, as demonstrated by the smaller number of coeluting proteins present in the Fraction 6–8 of 2sSEC versus Fraction 2–5 of SEC (Figure 1A, B). This likely resulted from the increased path length with 2 columns ( ), which offers improved resolution. The fractionation method proved to be highly reproducible, with little variation in each fraction collected in three technical replicates (Figure S2).
Figure 1. High-resolution sSEC separation of complex protein mixture.

Comparison of A) SEC (500 Å), B) sSEC 2sSEC (1000 Å – 500 Å), and C) 3sSEC (1000 Å – 500 Å – 500 Å) for the fractionation of sarcomeric protein extract. Top panel: representative UV chromatogram of each experiment with the collected fractions (1–10 for SEC and 2sSEC, 2*–12 for 3sSEC) annotated. Bottom panel: SDS-PAGE analysis of the corresponding SEC, 2sSEC or 3sSEC fractions collected and pooled from two technical replicates. Red and blue marks to the right of each gel represent molecular weight markers (250, 150, 100, 75, 50, 37, 25 kDa from top to bottom). LM, loading mixture prior to SEC/sSEC fractionation. The lane corresponding to Fraction 2* in C) represents visualization of equal volumes of both Fraction 1 and 2, which were combined for RPC-MS analysis due to their similarity in the protein contents.
To further exploit the benefit provided by increased path length, we combined an additional column of 500 Å pore size with the 1000 Å-500 Å series (3sSEC) to test the separation of complex protein mixtures. Proteins eluted later in 3sSEC with majority of the proteins eluting between 29–41 min versus 18–28 min in 2sSEC. However, the interval time required for most of the proteins to elute from the column was similar (11 min in 3sSEC vs. 9 min in 2sSEC) (Figure 1B, C). Furthermore, 3sSEC demonstrated significantly improved resolution over 2sSEC in the separation of proteins in the intermediate to low MW range (< 60 kDa) (Figure 1B, C).
In this study, we demonstrated that within a given time interval, sSEC provided significantly better separation than SEC as shown by less protein species coeluting within the same time interval and a narrower MW range of the proteins in the same fraction. This time-based evaluation method was employed because top-down MS experiments were typically performed at a fixed scan rate, for example, 1 or 2 sec per scan for the Maxis II Q-TOF instrument. Given a defined MS scan rate, the less coeluting proteins within a defined time interval usually resulted in reduced overlapping MS peaks and better mass spectra. Therefore, this sSEC method has great potential to be directly coupled with MS for online analysis of intact proteins.
Our study agrees with previous research, which demonstrated that MW range and selectivity of an SEC column are highly dependent on the pore size of the column packing materials.28 Importantly, we have achieved high-resolution separation of a complex protein mixture with a large MW range (10–220 kDa) by combining columns with different pore sizes and increasing the effective separation length (Figure 1). This method is robust, highly reproducible (Figure S2), and compatible with a wide variety of solvents, and therefore, can be generally applied for the separation and fractionation of protein mixtures.
Comparison of 2D sSEC-RPC with 1D RPC for MS Analysis of Intact Proteins in a Complex Mixture
Next, we analyzed the sarcomeric protein extract before (1D RPC-MS) and after sSEC fractionation (2D sSEC-RPC-MS) by high-resolution top-down MS. 1D RPC-MS is adequate for detecting the most abundant sarcomeric proteins and their proteoforms, nearly all of which are below 50 kDa (Figure 2A, B). Cardiac troponin T (cTnT), cardiac troponin I (cTnI), myosin light chain 1 and 2 (MLC1 and MLC2), actin, and cardiac troponin C (cTnC) are the major constituents of the cardiac sarcomere, and can be detected by 1D RPC-MS (Figure 2A) as reported previously.29 Many of these proteins are post-translationally modified as shown in Figure 2B. Using the abundant sarcomeric proteins (cTnT, cTnI, MLC1, MLC2, actin and cTnC) as references, we evaluated the efficiency of sSEC fractionation. As shown in Figure 2C, the most abundant sarcomeric proteins were separated by size into different sSEC fractions. Importantly, sSEC fractionation did not alter the abundance of the post-translationally modified proteoforms relative to the unmodified ones (Figure S3), indicating that relative quantification of proteoforms is reliable with sSEC fractionation prior to RPC-MS analysis.
Figure 2. Comparison of 1D RPC-MS and 2D 3sSEC-RPC-MS for the top-down analysis of a complex protein mixture.

A) Total ion chromatogram (TIC) of 1D RPC-MS analysis for 10 μg sarcomeric protein extract. The most abundant sarcomeric proteins are highlighted (pink, cTnT; green, cTnI; orange, MLC1; brown, MLC2; blue, actin; purple, cTnC) and their raw mass spectra are shown. The MW of each species is indicated in red font. B) High-resolution deconvoluted mass spectra of the sarcomeric proteins highlighted in 1D RPC-MS TIC. The major proteoforms of each protein species are annotated. Red italic p and pp represents mono-phosphorylation and bis-phosphorylation, respectively. C) TICs of 2D sSEC-RPC-MS analysis coupling sSEC fractionation with RPC-MS. Highlighted peaks correspond to the peaks of the abundant sarcomeric proteins highlighted in the 1D TIC. (Note: The highlights indicate the fractions in which the proteins are present most abundantly, but do not indicate that the species is exclusively present in the highlighted fractions.) D) Venn diagrams showing the numbers of total proteoforms and proteoforms with MW > 60 kDa detected in 1D versus 2D analysis.
While 1D RPC is sufficient for MS analysis of the most abundant sarcomeric proteins and their corresponding proteoforms, it failed to detect many proteins larger than 50 kDa present in the mixture (SDS-PAGE analysis in Figure 1). The 2225 proteoforms found in the 1D RPC-MS analysis were primarily low MW proteins ranging between 10 and 25 kDa in size (Table S1). The 2D sSEC-RPC-MS approach outperformed the 1D method, and detected a total of 5360 proteoforms (with 1316 proteoforms in common). More importantly, 47 proteoforms above 60 kDa were detected in the 2D platform compared to only 3 proteoforms in the 1D analysis, representing a 15-fold increase in the number of high MW proteoforms detected (Figure 2D). Overall, the 2D method surpassed 1D analysis by detecting 4044 more unique proteoforms that were not found in the 1D method (Figure 2D, Table S1).
These results are consistent with previous studies that showed orthogonal LC separation methods can expand the coverage of complex proteomes.9,30,31 2D LC strategies coupling ion-exchange chromatography (IEC), hydrophilic interaction chromatography, or hydrophobic interaction chromatography with RPC have allowed for top-down MS analysis of complex cell lysates and detection of hundreds of proteins.32–34 Furthermore, using a three-dimensional (3D) LC strategy, our group has reported the identification of 640 proteins in a single IEC fraction (out of 35), demonstrating the capability of multi-dimensional LC separation for top-down MS analysis of complex protein mixtures.35 Kelleher and co-workers utilized isoelectric focusing and GELFrEE separation, followed by RPC-MS analysis in a large-scale top-down study of human proteome, and were able to identify 1220 proteins and over 5000 proteoforms, representing the largest top-down study of the human proteome to date.36 While these studies demonstrate the power of multi-dimensional separation platforms for the deep profiling of proteomes by top-down MS, none of these works achieved top-down MS analysis of proteins larger than 80 kDa.21,37,38 Zhang et al. employed isoelectric focusing and superficially porous silica LC for the separation of mouse cardiac tissue extract, and were able to detect myosin heavy chain variants.39 However, the coverage of the cardiac proteome was limited. The sSEC method developed in this study enabled robust and high-resolution size-based separation of proteins over a broad MW range. The 2D platform coupling sSEC with significantly facilitated high-resolution top-down MS analysis of complex protein mixtures.
sSEC-RPC Enabled Top-down MS Analysis of High MW Proteins (up to 223 kDa)
With an exponential decay of S/N for proteins with an increase in MW,10 signal interference from coeluting low MW impedes the detection of large proteins. Hence, many LC-MS platforms are insufficient for detecting high MW proteins (especially those above 60 kDa) and the corresponding proteoforms in a complex protein mixture. Moreover, isolation and MS/MS fragmentation of ions from high MW proteins is challenging due to the extremely low S/N. Size-based fractionation of complex protein mixtures prior to RPC-MS analysis not only reduces the complexity of the sample, but also decreases ion suppression against high MW species, enabling top-down MS analysis of high MW proteins and their proteoforms.
As shown in Figure 3, we were able to detect high MW proteins up to 223.1 kDa in the early sSEC fractions (Fraction 1–6). sSEC Fraction 1 and 2 primarily contain a high MW protein (~ 220 kDa) as shown in the SDS polyacrylamide gel (Figure 1C), and this protein was detected in the subsequent top-down MS analysis (Figure 3). In addition, other high MW proteins, including a 140.8 kDa, 116.4 kDa, 93.3 kDa, and 80.9 kDa proteins among others, were also found in the sSEC fractions (Figure 3, Figure S4).
Figure 3. sSEC fractionation enabled detection of high MW proteins.

A) TICs of RPC-MS for sSEC Fractions 1–6. Highlighted regions of the TICs represent retention windows for the corresponding high MW proteins. B) Top-down mass spectra for a 223.1 kDa and a 140.8 kDa with zoom-in views of the charge states and the corresponding deconvoluted spectra. The deconvoluted spectrum of the 140.8 kDa protein shows multiple proteoforms. C) Top-down mass spectra and the deconvoluted spectra of proteins with MW 116.4 kDa, 80.9 kDa, 65.2 kDa, 72.3 kDa, 69.6 kDa, 62.7 kDa and 53.5 kDa.
Coeluting low MW proteins were segregated into the later sSEC fractions, permitting the detection of large proteins in the earlier fractions. For example, in the 1D RPC-MS analysis, a 116.4 kDa and a 47.6 kDa protein coeluted with very low MW proteins (e.g. 13.4 kDa and 7.8 kDa), which dominated the mass spectrum (Figure 4). By separating these by size, sSEC permitted the detection of the 116.4 and 47.6 kDa proteins in the sSEC Fraction 5 and 6, respectively (Figure 4). Deconvolution of the mass spectrum revealed 4 proteoforms of the 116.4 kDa protein, each with an 80 Da mass shift from the adjacent proteoform, suggesting that the 116.4 kDa protein is multiply-phosphorylated (Figure 4B). In addition, though the 47.6 kDa protein could be detected in the 1D RPC-MS analysis, the S/N was too low to efficiently isolate the precursor ions for MS/MS experiments. Reduction of the sample complexity enabled enrichment of the 47.6 kDa protein in Fraction 6 (Figure 4B), permitting the characterization of this proteins by MS/MS. It is worth noting that the 116.4 kDa and the 47.6 kDa protein were found in adjacent sSEC fractions, confirming that sSEC separation is necessary and effective for the separation of high MW proteins from intermediate MW ones. In addition to the separation of high MW proteins from intermediate and low MW species (Figure 4), intermediate MW proteins were also fractionated from the smaller ones (Figure S5). For example, a 47.5 kDa and 50.9 kDa proteins normally coeluted with the abundant sarcomeric protein (MLC1) in the 1D RPC-MS analysis (Figure S5). sSEC allowed for the separation of the 47.5 kDa and 50.9 kDa proteins from MLC1 to facilitate top-down MS and MS/MS analysis of these intermediate MW proteins.
Figure 4. Coeluted high MW and low MW proteins were separated by sSEC, permitting top-down MS analysis.

A) TIC of 1D RPC-MS (black trace) analysis for the whole sarcomeric protein mixture aligned with TICs of RPC-MS analysis for sSEC Fractions 5 and 6 (red and purple traces, respectively) of the same protein extract. B) The corresponding top-down mass spectra of the proteins eluted between 28.0 and 28.5 min. Protein species with MW 116.4 kDa and 47.6 kDa were revealed in sSEC Fractions 5 and 6, respectively, which regularly coeluted with smaller protein species (13.4 kDa, 7.8 kDa) in 1D RPC-MS analysis and remained undetected. To the right of the top-down mass spectra shows the corresponding deconvoluted spectra of the major proteins detected in 1D RPC-MS analysis (13.4 kDa and 7.8 kDa proteins), and RPC-MS analysis of sSEC Fractions 5 and 6 (116.4 kDa and 47.6 kDa protein, respectively). Deconvoluted mass spectrum of the 116.4 kDa proteins (resolving power 10000) revealed complex proteoforms each with 80 Da mass shifts.
sSEC-RPC Enabled Detection of Low Abundance Protein PTMs
sSEC fractionation prior to RPC-MS analysis facilitated the detection of low abundance protein PTMs (Figure 5, Figure S6). In the 1D RPC-MS analysis, a 65.2 kDa protein was found coeluted with other low MW proteins (Figure 5). Although certain charge states of the 65.2 kDa protein can be found in the zoom-in view of the mass spectrum, the S/N of this protein was extremely low (Figure 5B), and therefore, the post-translationally modified forms of the 65.2 kDa protein remained undetected in the 1D RPC-MS analysis due to their low abundance. Detection of the post-translationally modified forms of the 65.2 kDa protein was made possible with sSEC fractionation. The charge states of the 65.2 kDa proteoforms were easily recognizable in the RPC-MS analysis of sSEC Fraction 5 (Figure 5B). Protein deconvolution showed two additional proteoforms of the 65.2 kDa protein, each with 80 Da mass shifts. In addition, a 72.3 kDa protein, previously undetected in the 1D analysis, coeluted with the 65.2 kDa protein in the sSEC-RPC-MS analysis (Figure 5). Importantly, sSEC allowed for not only the detection of the 72.3 kDa protein by top-down MS, but also its post-translationally modified forms (Figure 5B). Similarly, the post-translationally modified form of a 79.0 kDa protein, which remained undetected in the 1D analysis, was revealed after sSEC fractionation (Figure S6A).
Figure 5. 3sSEC fractionation enabled top-down MS analysis of low abundance protein PTMs.
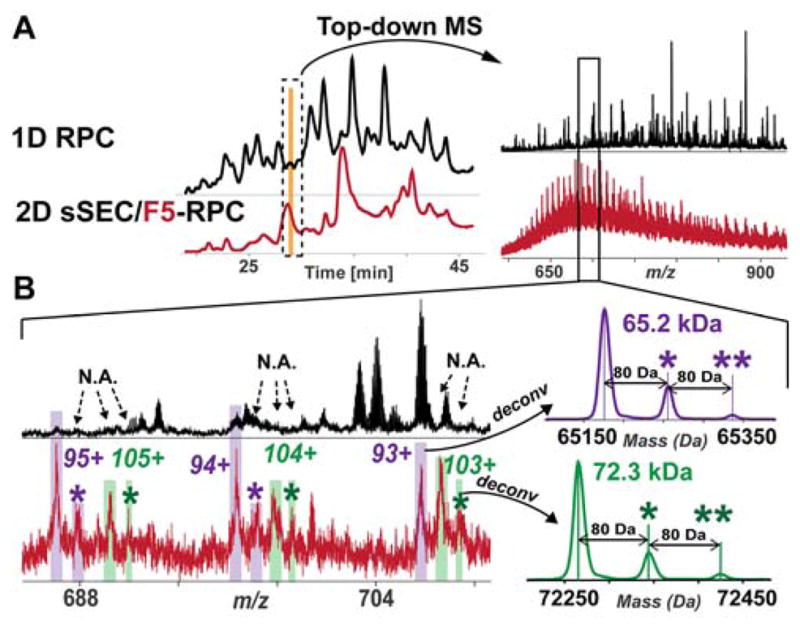
A) TIC of 1D RPC-MS (black trace) analysis for the whole sarcomeric protein mixture aligned with TICs of RPC-MS analysis for sSEC Fraction 5 of the same protein extract. The corresponding top-down mass spectra of the proteins eluted between 28.5 and 29 min are shown at the right panel. B) Zoom-in views of the top-down mass spectra and the corresponding deconvoluted spectra of the high MW proteins detected in sSEC Fraction 5. The charge states of the 65.2 kDa protein were detected in the 1D analysis. However, the low abundance PTMs of the 65.2 kDa was not revealed. sSEC allowed for the detection of the low abundance post-translationally modified form of the 65.2 kDa, as well as another protein that is 72.3 kDa. Deconvoluted mass spectrum of the 65.2 kDa and 72.3 kDa proteins (resolving power 10000) revealed low-abundant PTMs each with 80 Da shift. * denotes mono-phosphorylated proteoform; ** denotes bis-phosphorylated proteoform.
Protein PTMs represent important mechanisms in the regulation of protein activity and function, and play critical roles in signal transduction in health and diseases.2,3,40,41 Despite the prevalence of protein PTMs, the abundance of modified proteins relative to unmodified ones is usually low, hindering the detection and comprehensive characterization of post-translationally modified proteoforms. Many groups sought to develop methods for the effective enrichment of proteoforms with a particular PTM, such as phosphorylation,42–44 to facilitate the structural and functional characterization of post-translationally modified proteoforms. Here we have shown that high-resolution sSEC fractionation aids in reducing sample complexity, permitting the analysis of low abundance protein PTMs by top-down MS. More importantly, this sSEC separation method does not alter the relative abundance of the related proteoforms (Figure S3), unlike the enrichment approach, and therefore, enables reliable quantification.
Online Targeted High-resolution MS/MS for Protein Identification
Effective sSEC fractionation prior to RPC-MS enabled the detection of charge state envelopes of large proteins and permitted efficient isolation of precursor ions of the high MW proteins for fragmentation in MS/MS experiments. Targeted MS/MS experiments with online CAD fragmentation was performed on high and intermediate MW proteins in sSEC Fraction 5 and 7 (Figure 6, Figure S7 and S8, Table S2 and S3). The charge state ions, molecular weight, and retention time of each target protein were determined through the analysis of the first LC-MS run (Run 1) (Figure 6A–B). To identify target proteins, a second LC-MS run (Run 2) was performed with pre-set time segments to isolate precursor ions of the proteins of interest for fragmentation (Figure 6A). Online CAD was performed in multiple time segments, with corresponding TIC of the tandem mass spectra shown in Figure 6A (purple trace).
Figure 6. Top-down targeted MS/MS for protein identification in the sSEC fraction.
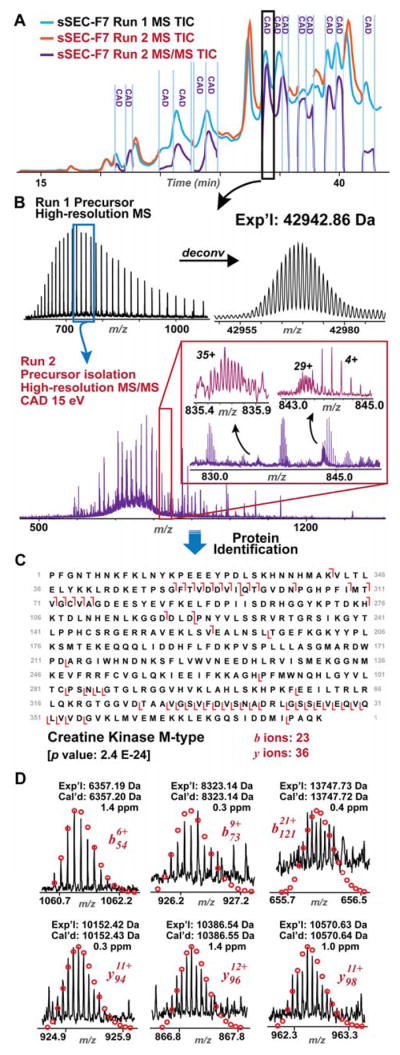
A) TIC of the first MS experiment (Run 1, blue trace) aligned with TICs of the second experiment (Run 2, purple and orange trace) for targeted MS/MS analysis (purple trace) of the proteins of interest in defined time segments. For the remaining time segments wherein no proteins of interest were found, MS data were collected (orange trace). The detailed information regarding the molecular weights and retention windows for individual proteins analyzed by MS/MS is shown in Table S3. B) High-resolution mass spectrum and the deconvoluted spectrum (80,000 resolving power) for the 42.9 kDa protein eluted between 33.5 and 34.5 min from the first MS experiment. Precursor ions of the 42.9 kDa protein were fragmented by CAD in Run 2, yielding complex high-resolution tandem mass spectrum. Insets show zoom-in view of the isotopically resolved fragment ions. C) The 42.9 kDa protein was identified as creatine kinase M-type (CKM) with high confidence (p-value: 2.4 E-24). An average of 20 tandem mass spectrum yielded 23 b ions and 36 y ions from CKM. D) Representative b and y fragment ions of CKM with high mass accuracy.
A 42.9 kDa protein was detected in the 33.5–34.5 min elution window in Run 1. The absence of coeluting proteins allowed multiple charge states of the 42.9 kDa protein from 700–800 m/z to be isolated for CAD fragmentation during Run 2. High-resolution MS/MS provided by the Maxis II Q-TOF mass spectrometer allowed for accurate determination of the charge states and monoisotopic masses of the fragment ion in the complex tandem mass spectrum, as shown in Figure 6B, with 35+ and 29+ ions resolved close to the baseline. MASH Suite Pro25 equipped with the MS-Align+ algorithm24 was employed for manual validation of the mass list and identification of the target protein. We identified the 42.9 kDa protein as creatine kinase, M-type (CKM, Uniprot Human P06732) with high confidence (Figure 6C). Importantly, in the tandem mass spectrum of only 20 averaged scans, 23 b ions and 36 y ions of CKM were identified with high resolution and high mass accuracy (Figure 6C–D). Similarly, we also identified a protein of 47.4 kDa, which is a novel proteoform of the trifunctional enzyme, β-subunit (Uniprot Human P55084) (Figure S9) with removal of the N-terminal 33 amino acids. This 33-amino acid peptide is likely a signaling peptide to aid the transportation of this protein to the mitochondria and is cleaved after transport is completed. Importantly, this proteoform is not present in the protein database, showcasing the power of top-down MS and MS/MS for the identification and characterization of novel proteoforms.
Nevertheless, proteins above 50 kDa were difficult to identify because these proteins were not isotopically resolved by the mass spectrometer. This prevented accurate monoisotopic mass determination, which is essential for protein identification using the MS-Align+ algorithm. Considerable sample dilution, resulting in reduced S/N of the intermediate to high MW proteins, also contributed to difficulties in protein identification. This sample dilution was a consequence of fraction collection using columns with large inner diameter, requiring a larger volume of solvent. In addition, individual proteins/proteoforms were spread across two or more fractions, requiring more sample to enable top-down MS and MS/MS analysis. To this end, this strategy could be improved with the implementation of online sSEC-RPC-MS. The development of automated 2D LC systems and MS-compatible chromatographic strategies45 have opened the door for the online versions of this 2D LC platform.
CONCLUSIONS
In this study, we have shown that combining SEC columns with different pore sizes in series can achieve high-resolution separation of proteins in a complex mixture over a broad MW range (10–223 kDa). Implementing sSEC with MS-compatible solvent coupled to RPC-MS analysis significantly enhanced the detection of high MW proteins above 60 kDa. This 2D system (sSEC-RPC) coupled to a high-resolution Q-TOF mass spectrometer greatly surpasses the 1D RPC-MS method by enabling the detection of 4044 more unique proteoforms and high MW proteins up to 223 kDa. Effective protein fractionation and separation allowed for the detection of low abundance protein PTMs and online targeted MS/MS analysis of intermediate to high MW proteins for protein identification and characterization. This versatile method opens up new opportunities for the large-scale top-down proteomics analysis of high MW proteins from complex protein mixtures. Moreover, sSEC can also be used in non-denaturing45 conditions coupled with other non-denaturing chromatography methods, such as hydrophobic interaction chromatography46 or IEC47, holding great promise for the analysis of native protein complexes.
Supplementary Material
Acknowledgments
Financial support was kindly provided by NIH R01GM117058 (to S.J. and Y.G.), NIH R01HL109810, R01HL096971, and S10OD018475 (to Y.G.). T.T. would like to acknowledge support of the NIH Chemical Biology Interface Training grant NIH T32GM008505. S.M. would like to acknowledge support from the Cancer Center Support Grant P30 CA014520 from the Carbone Cancer Center, and NIH National Center for Advancing Translational Sciences (NCATS) grant UL1TR000427. The authors would like to thank Lichen Xiu for helpful discussion in the sSEC development, Zhijie Wu and Ruixiang Sun for assistance in the protein identification, and John Bailey from Waters Corporation for technical support.
The MS proteomics data have been deposited to the MassIVE repository, created by NIH-funded Center for Computational Mass Spectrometry (ftp://MSV000080365@massive.ucsd.edu) with the data set identifier MSV000080365.
Footnotes
Supporting Information Available: Supplementary method details, data, and discussion are provided in the supporting information. This material is available free of charge via the Internet at http://pubs.acs.org.
References
- 1.Smith LM, Kelleher NL. Nat Methods. 2013;10:186–187. doi: 10.1038/nmeth.2369. [DOI] [PMC free article] [PubMed] [Google Scholar]
- 2.Gregorich ZR, Ge Y. Proteomics. 2014;14:1195–1210. doi: 10.1002/pmic.201300432. [DOI] [PMC free article] [PubMed] [Google Scholar]
- 3.Cai W, Tucholski TM, Gregorich ZR, Ge Y. Expert Rev Proteomics. 2016;13:717–730. doi: 10.1080/14789450.2016.1209414. [DOI] [PMC free article] [PubMed] [Google Scholar]
- 4.Siuti N, Kelleher NL. Nat Methods. 2007;4:817–821. doi: 10.1038/nmeth1097. [DOI] [PMC free article] [PubMed] [Google Scholar]
- 5.Yates JR, Ruse CI, Nakorchevsky A. Annu Rev Biomed Eng. 2009;11:49–79. doi: 10.1146/annurev-bioeng-061008-124934. [DOI] [PubMed] [Google Scholar]
- 6.Chait BT. Science. 2006;314:65–66. doi: 10.1126/science.1133987. [DOI] [PubMed] [Google Scholar]
- 7.Zhang H, Ge Y. Circ Cardiovasc Genet. 2011;4:711. doi: 10.1161/CIRCGENETICS.110.957829. [DOI] [PMC free article] [PubMed] [Google Scholar]
- 8.Sabido E, Selevsek N, Aebersold R. Curr Opin Biotechnol. 2012;23:591–597. doi: 10.1016/j.copbio.2011.11.014. [DOI] [PubMed] [Google Scholar]
- 9.Zhang Z, Wu S, Stenoien DL, Pasa-Tolic L. Annu Rev Anal Chem. 2014;7:427–454. doi: 10.1146/annurev-anchem-071213-020216. [DOI] [PubMed] [Google Scholar]
- 10.Compton PD, Zamdborg L, Thomas PM, Kelleher NL. Anal Chem. 2011;83:6868–6874. doi: 10.1021/ac2010795. [DOI] [PMC free article] [PubMed] [Google Scholar]
- 11.Tran JC, Doucette AA. Anal Chem. 2008;80:1568–1573. doi: 10.1021/ac702197w. [DOI] [PubMed] [Google Scholar]
- 12.Tran JC, Zamdborg L, Ahlf DR, Lee JE, Catherman AD, Durbin KR, Tipton JD, Vellaichamy A, Kellie JF, Li M, Wu C, Sweet SM, Early BP, Siuti N, LeDuc RD, Compton PD, Thomas PM, Kelleher NL. Nature. 2011;480:254–258. doi: 10.1038/nature10575. [DOI] [PMC free article] [PubMed] [Google Scholar]
- 13.Vellaichamy A, Tran JC, Catherman AD, Lee JE, Kellie JF, Sweet SM, Zamdborg L, Thomas PM, Ahlf DR, Durbin KR, Valaskovic GA, Kelleher NL. Anal Chem. 2010;82:1234–1244. doi: 10.1021/ac9021083. [DOI] [PMC free article] [PubMed] [Google Scholar]
- 14.Kellie JF, Catherman AD, Durbin KR, Tran JC, Tipton JD, Norris JL, Witkowski CE, 2nd, Thomas PM, Kelleher NL. Anal Chem. 2012;84:209–215. doi: 10.1021/ac202384v. [DOI] [PMC free article] [PubMed] [Google Scholar]
- 15.Li Y, Compton PD, Tran JC, Ntai I, Kelleher NL. Proteomics. 2014;14:1158–1164. doi: 10.1002/pmic.201300381. [DOI] [PMC free article] [PubMed] [Google Scholar]
- 16.Doucette AA, Tran JC, Wall MJ, Fitzsimmons S. Expert Rev Proteomics. 2011;8:787–800. doi: 10.1586/epr.11.67. [DOI] [PubMed] [Google Scholar]
- 17.Chen X, Ge Y. Proteomics. 2013;13:2563–2566. doi: 10.1002/pmic.201200594. [DOI] [PMC free article] [PubMed] [Google Scholar]
- 18.Hong P, Koza S, Bouvier ES. J Liq Chromatogr Relat Technol. 2012;35:2923–2950. doi: 10.1080/10826076.2012.743724. [DOI] [PMC free article] [PubMed] [Google Scholar]
- 19.Li Y, Gu C, Gruenhagen J, Zhang K, Yehl P, Chetwyn NP, Medley CD. J Chromatogr A. 2015;1393:81–88. doi: 10.1016/j.chroma.2015.03.027. [DOI] [PubMed] [Google Scholar]
- 20.Alpert AJ. Column Handbook for Size Exclusion Chromatography. Academic Press; San Diego: 1999. pp. 249–266. [Google Scholar]
- 21.Simpson DC, Ahn S, Pasa-Tolic L, Bogdanov B, Mottaz HM, Vilkov AN, Anderson GA, Lipton MS, Smith RD. Electrophoresis. 2006;27:2722–2733. doi: 10.1002/elps.200600037. [DOI] [PMC free article] [PubMed] [Google Scholar]
- 22.Yi-Chen C, Ayaz-Guner S, Peng Y, Lane NM, Locher MR, Kohmoto T, Larsson L, Moss RL, Ge Y. Anal Chem. 2015;87:8399–8406. doi: 10.1021/acs.analchem.5b01745. [DOI] [PMC free article] [PubMed] [Google Scholar]
- 23.Ferrige AG, Seddon MJ, Jarvis S, Skilling J, Aplin R. Rapid Comm Mass Spectrom. 1991;5:374–379. [Google Scholar]
- 24.Liu X, Sirotkin Y, Shen Y, Anderson G, Tsai YS, Ting YS, Goodlett DR, Smith RD, Bafna V, Pevzner PA. Mol Cell Proteomics. 2012;11:M111.008524. doi: 10.1074/mcp.M111.008524. [DOI] [PMC free article] [PubMed] [Google Scholar]
- 25.Cai W, Guner H, Gregorich ZR, Chen AJ, Ayaz-Guner S, Peng Y, Valeja SG, Liu X, Ge Y. Mol Cell Proteomics. 2016;15:703–714. doi: 10.1074/mcp.O115.054387. [DOI] [PMC free article] [PubMed] [Google Scholar]
- 26.Berek, D.
- 27.Van Kreveld ME, Van den Hoed N. Journal of Chromatography A. 1978;149:71–91. [Google Scholar]
- 28.Kostanski LK, Keller DM, Hamielec AE. J Biochem Biophys Methods. 2004;58:159–186. doi: 10.1016/j.jbbm.2003.10.001. [DOI] [PubMed] [Google Scholar]
- 29.Peng Y, Gregorich ZR, Valeja SG, Zhang H, Cai W, Chen Y-C, Guner H, Chen AJ, Schwahn DJ, Hacker TA, Liu X, Ge Y. Mol Cell Proteomics. 2014;13:2752–2764. doi: 10.1074/mcp.M114.040675. [DOI] [PMC free article] [PubMed] [Google Scholar]
- 30.Zhang X, Fang A, Riley CP, Wang M, Regnier FE, Buck C. Anal Chim Acta. 2010;664:101–113. doi: 10.1016/j.aca.2010.02.001. [DOI] [PMC free article] [PubMed] [Google Scholar]
- 31.Tian Z, Zhao R, Tolic N, Moore RJ, Stenoien DL, Robinson EW, Smith RD, Pasa-Tolic L. Proteomics. 2010;10:3610–3620. doi: 10.1002/pmic.201000367. [DOI] [PMC free article] [PubMed] [Google Scholar]
- 32.Sharma S, Simpson DC, Tolic N, Jaitly N, Mayampurath AM, Smith RD, Pasa-Tolic L. J Proteome Res. 2007;6:602–610. doi: 10.1021/pr060354a. [DOI] [PubMed] [Google Scholar]
- 33.Xiu L, Valeja SG, Alpert AJ, Jin S, Ge Y. Anal Chem. 2014;86:7899–7906. doi: 10.1021/ac501836k. [DOI] [PMC free article] [PubMed] [Google Scholar]
- 34.Wilson SR, Jankowski M, Pepaj M, Mihailova A, Boix F, Vivo Truyols G, Lundanes E, Greibrokk T. Chromatographia. 2007;66:469–474. [Google Scholar]
- 35.Valeja SG, Xiu L, Gregorich ZR, Guner H, Jin S, Ge Y. 2015;87:5363–5371. doi: 10.1021/acs.analchem.5b00657. [DOI] [PMC free article] [PubMed] [Google Scholar]
- 36.Catherman AD, Durbin KR, Ahlf DR, Early BP, Fellers RT, Tran JC, Thomas PM, Kelleher NL. Mol Cell Proteomics. 2013;12:3465–3473. doi: 10.1074/mcp.M113.030114. [DOI] [PMC free article] [PubMed] [Google Scholar]
- 37.Pesavento JJ, Bullock CR, LeDuc RD, Mizzen CA, Kelleher NL. J Biol Chem. 2008;283:14927–14937. doi: 10.1074/jbc.M709796200. [DOI] [PMC free article] [PubMed] [Google Scholar]
- 38.Stobaugh JT, Fague KM, Jorgenson JW. J Proteome Res. 2013;12:626–636. doi: 10.1021/pr300701x. [DOI] [PubMed] [Google Scholar]
- 39.Zhang J, Roth MJ, Chang AN, Plymire DA, Corbett JR, Greenberg BM, Patrie SM. Anal Chem. 2013;85:10377–10384. doi: 10.1021/ac402394w. [DOI] [PubMed] [Google Scholar]
- 40.Mann M, Jensen ON. Nat Biotechnol. 2003;21:255–261. doi: 10.1038/nbt0303-255. [DOI] [PubMed] [Google Scholar]
- 41.Karve TM, Cheema AK. J Amino Acids. 2011;2011:207691. doi: 10.4061/2011/207691. [DOI] [PMC free article] [PubMed] [Google Scholar]
- 42.Hwang L, Ayaz-Guner S, Gregorich ZR, Cai W, Valeja SG, Jin S, Ge Y. J Am Chem Soc. 2015;137:2432–2435. doi: 10.1021/ja511833y. [DOI] [PMC free article] [PubMed] [Google Scholar]
- 43.Porath J, Carlsson J, Olsson I, Belfrage G. Nature. 1975;258:598–599. doi: 10.1038/258598a0. [DOI] [PubMed] [Google Scholar]
- 44.Schmidt SR, Schweikart F, Andersson ME. J Chromatogr B Analyt Technol Biomed Life Sci. 2007;849:154–162. doi: 10.1016/j.jchromb.2006.09.016. [DOI] [PubMed] [Google Scholar]
- 45.Muneeruddin K, Thomas JJ, Salinas PA, Kaltashov IA. Anal Chem. 2014;86:10692–10699. doi: 10.1021/ac502590h. [DOI] [PubMed] [Google Scholar]
- 46.Chen B, Peng Y, Valeja SG, Xiu L, Alpert AJ, Ge Y. Anal Chem. 2016;88:1885–1891. doi: 10.1021/acs.analchem.5b04285. [DOI] [PMC free article] [PubMed] [Google Scholar]
- 47.Muneeruddin K, Nazzaro M, Kaltashov IA. Anal Chem. 2015;87:10138–10145. doi: 10.1021/acs.analchem.5b02982. [DOI] [PubMed] [Google Scholar]
Associated Data
This section collects any data citations, data availability statements, or supplementary materials included in this article.