Abstract
Previous studies have concluded that microparticles (MPs) can more effectively approach the microvessel wall than nanoparticles because of margination. In this study, however, we show that MPs are not marginated in capillaries where the vessel diameter is comparable to that of red blood cells (RBCs). We numerically investigated the behavior of MPs with a diameter of 1 μm in various microvessel sizes, including capillaries. In capillaries, the flow mode of RBCs shifted from multi-file flow to bolus (single-file) flow, and MPs were captured by the bolus flow of the RBCs instead of being marginated. Once MPs were captured, they rarely escaped from the vortex-like flow structures between RBCs. These capture events were enhanced when the hematocrit was decreased, and reduced when the shear rate was increased. Our results suggest that microparticles may be rather inefficient drug carriers when targeting capillaries because of capture events, but nanoparticles, which are more randomly distributed in capillaries, may be more effective carriers.
Introduction
The flow behavior of microparticles (MPs) is of paramount importance in drug delivery systems targeting capillary districts1–3. The behavior of MPs in the microcirculation, therefore, has been widely studied over decades3, 4. MPs in blood are subject to hydrodynamic interaction with red blood cells (RBCs), which exhibit axial migration, resulting in MPs appearing primarily in the peripheral layer. This is termed margination, which is the first step in the adhesion of circulating particles to the endothelium. The behavior of platelets has been investigated in in vivo experiments using rabbit mesentery, looking at arterioles5 and venules6 with vessel diameters ranging from 15 to 35 μm. The effects of physical conditions (e.g., shear rate) on margination have been systematically investigated using glass tubes7 and PDMS channels8. These studies provided insight not only into microcirculatory blood flow but also into therapeutic drug carriers. In vitro experiments were performed to determine the optimal size/shape of drug carriers to effectively adhere to the vascular wall9, 10. For example, Charoenphol et al. showed that microspheres (1–10 μm in diameter) more efficiently adhered to the endothelium in microchannels than nanoparticles (≤500 nm in diameter) in blood flow9.
Numerical simulations have been also performed to investigate the margination of MPs11–18. Müller et al.12 investigated the effect of the particle size/shape, shear rate, channel width, and volume fraction of RBCs (hematocrit, Hct) on margination. Their two-dimensional model showed that large particles (1.83 μm or 0.91 μm in diameter) more efficiently marginated than small particles (0.25 μm in diameter) for various shear rates12. Some of the experimental results of MP margination were discussed with numerical results19, 20. Lee et al.20, for example, demonstrated that nanoparticles (200 nm in diameter) randomly distributed in postcapillary venules with a diameter ranging from 15–30 μm, while microparticles (1 μm in diameter) accumulated near the wall.
The experimental and numerical studies mentioned so far have focused on relatively large microvessels. However, MPs are often required to reach capillaries, where the vessel diameter can be comparable to or smaller than RBCs. The flow of RBCs in capillaries has been widely studied by theoretical analyses21, 22, in vivo experiments23–27, and in vitro experiments28–30. Physical restriction in small capillaries makes RBCs form a single-file line with parachute-shaped deformation, resulting in “bolus flow” with vortex-like streamlines between RBCs21, 22, 31, 32. Hence, it remains unclear whether the behavior of MPs in such capillaries can be formulated in the same context as margination in relatively large microvessels.
In this study, we numerically investigated the flow of MPs with a diameter of 1 μm for various sizes of microvessels, including capillaries. Our results demonstrated that MPs were not marginated in capillaries, but captured in plasma spaces between RBCs. Once MPs were captured, they rarely escaped from the vortex-like flow between RBCs. We also examined the effect of Hct and shear rate on this capture event.
Results
Capture event in bolus flow
The flow of MPs was investigated for various vessel diameters ranging from D = 8 μm to 22 μm, where the diameter of MPs was d P = 1 μm, and the major diameter of RBCs was d R = 8 μm. First, we focused on a shear rate of = 167 s−1 and an RBC volume fraction of Hct = 0.2. The shear rate can be normalized to form the capillary number Ca = , such that = 167 s−1 corresponds to Ca = 0.2, where μ is the viscosity of plasma, is the surface shear elastic modulus of RBCs. For more details, see Methods.
Snapshots of numerical results are shown in Fig.1. In the smallest microvessel (D = 8 μm), RBCs formed a single-file line, resulting in bolus flow with vortex-like streamlines21, 22, 31, 32. Some MPs were then captured in the plasma spaces between RBCs and circulated in the vortex (Fig. 1a; see also Supplemental Movie S1). Hereafter, we call this phenomenon a “capture event”. Bolus flow in D = 8 μm was not so stable, and RBCs sometimes showed clustering. When the vessel diameter increased to D = 10 μm, RBCs underwent a more stable single-file motion, in that the size of the spaces between RBCs remained constant, and captured MPs in the bolus flow rarely escaped from the vortex (Fig. 1b; see also Supplemental Movie S2). When the vessel diameter further increased to D = 12 μm, the flow mode sifted to a transition state, where single-file and multi-file motions coexist33, 34, and most MPs were marginated in cell-depleted peripheral layer (CDPL) (Fig. 1c; see also Supplemental Movie S3). In the largest microvessel (D = 22 μm), RBCs formed complete multi-file flow35, 36. Most MPs were also marginated, but only after a longer period of time (Fig. 1d; see also Supplemental Movie S4).
Figure 1.
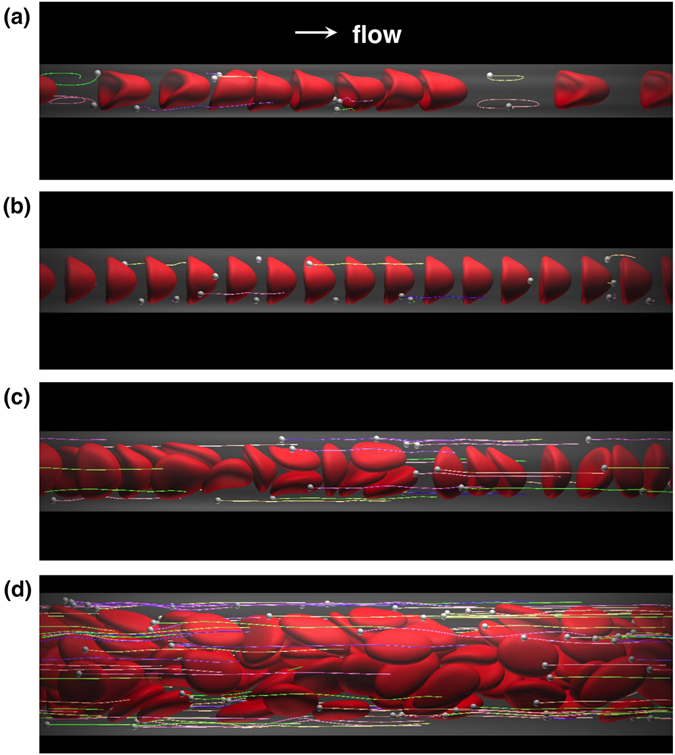
Snapshots of the flow of MPs and RBCs for Hct = 0.2 and Ca = 0.2 in microvessels with diameters (a) D = 8 μm, (b) 10 μm, (c) 12 μm, and (d) 22 μm. The flow is from left to right. Lines show particle trajectories. See also Supplemental Movies S1 to S4.
Figure 2 compares the number probability of MPs in CDPL (P N = N M/N T) with the volume fraction of CDPL (P V = V CDPL/V T), where N M is the number of MPs in CDPL, N T is the total number of MPs, V CDPL is the volume of CDPL, and V T is the total volume of the computational domain. When MPs are randomly distributed in the vessel, the number probability should be the same value as the volume fraction. However, when MPs are marginated, the number probability becomes larger than the volume fraction. The number probability was larger than the volume fraction for D ≥ 12 μm, so these cases could be defined as margination. However, because of the capture of MPs in capillary-sized microvessels, the number probability becomes lower than the volume fraction for D < 12 μm.
Figure 2.
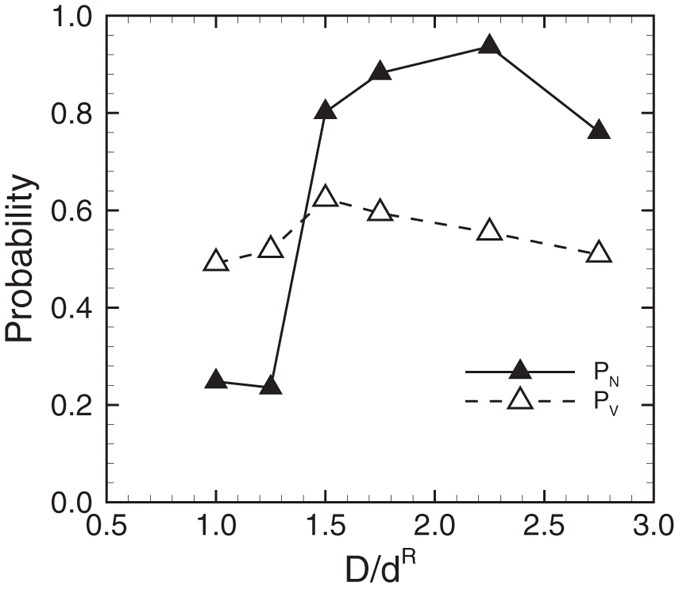
Number probability of MPs in CDPL, P N, and volume fraction of CDPL, P V, for Hct = 0.2 and Ca = 0.2. The microvessel diameter is normalized by that of RBCs, D/d R.
To quantify the capture events, a capture ratio was defined. When an MP is captured in the vortex between RBCs, the net velocity of the MP should be the same as the velocity of the RBCs, i.e., , where the subscript i represents the ith MP, is the moving average of the MP velocity, and V R is the mean velocity of the RBCs. The time histories of the relative velocity of each MP in bolus flow (D = 10 μm) and transition state (D = 12 μm) are shown in Fig. 3a,b, respectively, where the moving average was conducted for a time period of 0.2 s. In bolus flow (Fig. 3a), 13–14 particles were captured with velocities of , while 4–5 particles were marginated with velocities of , where V B is the mean velocity of blood. However, in transition state (Fig. 3b), most MPs were marginated and had velocities of . Thus, we define the capture of MPs as , and the capture ratio is then defined as N C/N T, where N C is the number of the captured MPs. The capture ratio is shown in Fig. 3c. The capture ratio was approximately 0.5 for D/d R = 1.0, increased to 0.8 for D/d R = 1.25, then suddenly decreased to values less than 0.2 for D/d R > 1.25.
Figure 3.

Time history of relative velocity ratio, for (a) D = 10 μm (18 MPs), and (b) 12 μm (24 MPs), where moving-average velocity of each particle () relative to mean RBC velocity (V R) is normalized by the whole blood velocity (V B). The moving-average was conducted for a time period of 0.2 s. Dotted line represents the capture threshold, = −0.1. (c) Capture ratio of MPs, where N C is the number of captured MPs and N T is the total number of MPs.
Effect of Hct on capture ratio
It is expected that the capture event greatly depends upon the size of plasma spaces between RBCs, and hence, the capture ratio should be affected by Hct. To clarify the effect of Hct on the capture ratio, we simulated dilute Hct conditions (Hct = 0.1 and 0.05). At Hct = 0.1, bolus flow occurred with enlarged plasma spaces for D = 10 μm and 12 μm, resulting in an enhancement in the capture ratio (Fig. 4a; see also Supplemental Movie S5). At Hct = 0.05, the size of the plasma spaces further increased, and all the MPs were stably captured (Fig. 4b; see also Supplemental Movie S6). The average distance between two RBCs (the volume centroid distance), and the capture ratio are summarized in Fig. 5a,b, respectively, as functions of Hct and the vessel diameter. The average distance increased when RBCs formed bolus flow, and the capture ratio was enhanced as Hct was decreased. Figure 5b also shows that the capture ratio peaked at D/d R = 1.25 (D = 10 μm) for all values of Hct investigated.
Figure 4.
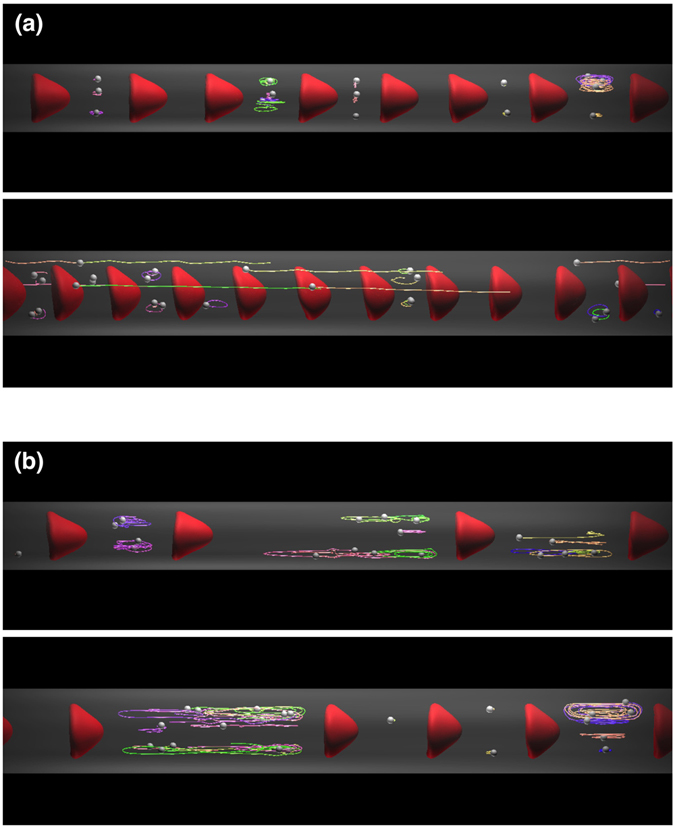
Snapshots of the flow of MPs and RBCs for Ca = 0.2 and (a) Hct = 0.1 and (b) 0.05 in capillaries with diameters (top) D = 10 μm and (bottom) 12 μm. See also Supplemental Movies S5 and S6.
Figure 5.
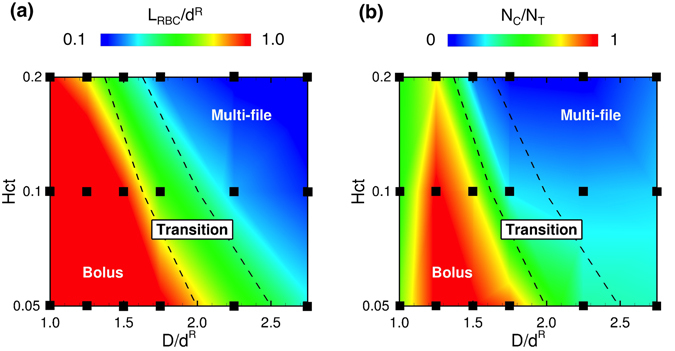
(a) Average distance between two RBCs normalized by the diameter of RBCs, L RBC/d R, and (b) capture ratio as functions of D/d R and Hct. “Transition” refers to a state that bolus flow and multi-file flow coexists in a microvessel.
Effect of shear rate on capture ratio
For a comprehensive understanding of capture events in bolus flow, we also investigated the effect of shear rate on the capture ratio for Hct = 0.2 in capillary-sized microvessels. Snapshots are shown in Fig. 6 (see also Supplemental Movie S7). For the lowest shear rate, Ca = 0.05, corresponding to the venule shear rate37, parachute-shaped RBCs underwent bolus flow at D = 8 μm (Fig. 6a). For the highest shear rate, Ca = 0.4, the RBCs deformed into bullet-like shapes, similar to the RBC shape observed both in rat mesenteric microvessels25 and glass microcapillaries28, 30. Because the elongation of RBCs at higher shear rates reduces the size of plasma spaces between RBCs, MPs were marginated as shown in Fig. 6b. The effect of shear rate on the capture ratio was summarized in Fig. 7. The capture ratio was maximized at D/d R = 1.25 (D = 10 μm) independent of shear rate, but was reduced when the shear rate increased.
Figure 6.
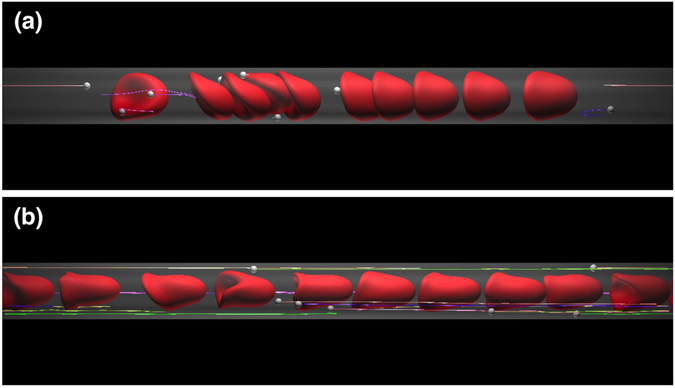
Snapshots of the flow of MPs and RBCs for (a) Ca = 0.05, and (b) 0.4 in capillary with a diameter of D = 8 μm. See also Supplemental Movie S7.
Figure 7.
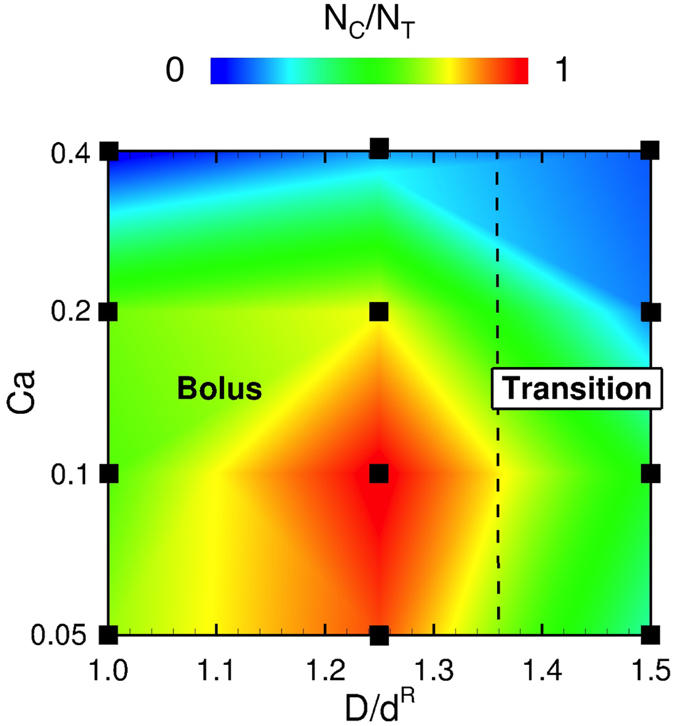
Capture ratio as functions of D/d R and Ca.
Discussion
The margination of MPs and platelets in blood has been widely investigated by in vivo 5, 6 and in vitro experiments7, 8, as well as numerical simulations11–18. These previous studies have concluded that MPs can more effectively approach the microvessel wall than nanoparticles because of margination. However, it has been unclear whether these results can be extended to capillaries, which are crucial sites for therapeutic drug transport.
We demonstrated that MPs were not marginated in the capillaries (D/d R ≤ 1.25), but captured in the bolus flow of RBCs. A few previous studies also examined capillary-sized microchannels. Müller et al.12, 13 simulated the behavior of MPs in a two-dimensional capillary with a width W = 10 μm and reported that MPs were marginated in the capillary model. However, their RBC model was also small, and the capillary width relative to the RBC diameter was W/d R = 1.64. This width likely promoted multi-file flow rather than bolus flow (Fig. 5). Krüger11 also investigated the behavior of platelets in a capillary with a diameter of 10 μm (D/d R = 1.25). The author examined a relatively higher Hct value (Hct ≈ 0.37) than physiological values in capillaries (Hct ≤ 0.237), and found that RBCs formed multi-file flow, resulting in platelet margination at a concentrated RBC condition. Thus, the previous view that MPs efficiently approach microvessel walls9, 12, 13, 20 may only apply to relatively large microvessels and not to capillaries. Our results suggest that MPs could be rather inefficient drug carriers in capillaries because of capture events, and that nanoparticles, which are more randomly distributed in the capillaries, could be more effective carriers.
In this study, MPs were modeled as capsules less deformable than RBCs. Deformable particles experience lift forces perpendicular to the wall, and these lift forces may affect capture events. Although we think that capture events are mainly dominated by particle size, it is not clear whether the present results are straightforwardly applicable to rigid microparticles. Therefore, it should be noted that the present results are most applicable to cases in which the capillary number of MPs () is larger than 10−3. MPs were also modeled as non-Brownian particles. Using the Stokes-Einstein equation, the diffusion coefficient of 1 μm particles is estimated as D P ≈ 3.8 × 10⁻¹³ m2/s. The Peclet number, , then ranges from 28 to 220. In addition, RBC flow induces stronger dispersion than Brownian diffusion38. Thus, Brownian diffusion would have a small effect on this problem.
Recently, various types of microfluidic devices have been developed for human blood samples, and microparticles have been often used for micro-PIV and micro-PTV measurements of blood flow39, 40. Because of the relatively large sizes of microfluidic devices, this capture event has not been reported even in microfluidics studies. In the case of liquid drops, Ohmura et al.41 recently reported capture events in a microfluidic device, in which small droplets were captured between successive large droplets. We hope that this capture phenomenon can be confirmed in blood flow experiments in the near future.
In summary, MPs with a diameter of 1 μm were not marginated under physiologically relevant Hct conditions in capillaries, but instead captured by the bolus flow of RBCs. Once the MPs were captured, they rarely escaped from the vortex-like flows between RBCs. These results suggest that microparticles are disadvantageous drug carriers for targeting capillary districts, so nanoparticles may be more effective carriers.
Methods
Flow and cell models
Consider a cellular flow consisting of plasma, RBCs, and MPs in microvessels ranging from 8 μm to 22 μm in diameter. Hereafter, the superscripts R and P represent parameters for RBCs and MPs, respectively. The microvessels were modeled as a cylindrical vessel of diameter D. The length of the computational domain was approximately 100 μm, and periodic boundary conditions were employed in the flow direction to observe the long-term behaviors of MPs. An RBC was modeled as a biconcave capsule, or a Newtonian fluid enclosed by a thin elastic membrane, with a major diameter d R = 8 μm, and maximum thickness t R = 2 μm.
The membrane follows the Skalak constitutive law42:
| 1 |
where w s is the strain energy density function, G s is the surface shear elastic modulus of the cell membrane, and C is a coefficient representing the area incompressibility. The surface shear elastic modulus and area incompressibility coefficient of RBCs were determined to be μN/m and C R = 102, respectively43. Bending resistance was also considered44, with a bending modulus N · m45. The viscosity of cytoplasm was taken to be μ R = 6.0 × 10⁻³ Pa · s, which is five times higher than the viscosity of plasma (μ = 1.2 × 10⁻³ Pa · s). These values successfully reproduced various behaviors of RBCs, including the deformation of RBCs in shear flow and the thickness of cell-depleted peripheral layer (CDPL)43.
An MP was modeled as a small spherical capsule with a diameter d P = 1 μm. An experiment using atomic force microscopy showed that the deformability of human platelets is generally lower than RBCs46. Here, MPs were modeled as less deformable capsules than RBCs; i.e., the membrane shear elasticity was 10 times larger than RBCs (), while the other parameters remained the same (i.e., C P = C R, μ P = μ R, and ).
Numerical simulation
Various types of numerical methods have been developed for simulating cellular flow36, 47. In this study, we used the Lattice-Boltzmann method (LBM)48, 49 coupling with the finite element method (FEM)50. The membrane mechanics was solved by FEM50, given by
| 2 |
where T is the Cauchy stress tensor, q is the load on the membrane, is the virtual displacement, and is the virtual strain. The fluid mechanics was solved by LBM48, i.e.,
| 3 |
where f i is the particle distribution function for particles with velocity c i at a position x, Δt is the time step size, is the equilibrium distribution, τ is the nondimensional relaxation time, and F i is the external force term. The LBM D3Q19 lattice model was used. FEM and LBM were coupled by the immersed boundary method51. The volume-of-fluid (VOF) method52 and front-tracking method53 are also employed to update the viscosity in the fluid mesh. All procedures were fully implemented on graphics processing unit (GPU) to accelerate the numerical simulation54. Our coupling method has been successfully applied to numerical analyses of leukocytes43, circulating tumor cells55 and cell adhesion56. The solid and fluid mesh sizes were set to be 250 nm (an unstructured mesh with 5,120 elements was used for the RBC membrane and 1,280 elements for the MP membrane). In the case of the smallest capillary (D = 8 μm), mesh sizes were set to be 125 nm for the LBM and FEM meshes (20,480 elements for RBCs and 5,120 elements for MPs).
The shear rate was defined as , where U m is the mean fluid velocity in the absence of cells under the same pressure gradient. We focused on a shear rate of s−1 (wall shear rate s−1) and an RBC volume fraction of Hct = 0.2, to simulate a physiologically relevant Hct in capillaries37. The shear rate can be normalized to form the capillary number , such that s−1 corresponds to Ca = 0.2. The volume fraction of MPs was set to 0.001, corresponding to the volume fraction of platelets in human blood57, 58. We only used data after the thickness of CDPL reached a plateau (this time is referred to as t = 0, and defined as quasi-steady state) to reduce the influence of the initial conditions. Time-averaging was performed for a time period of 1.0 s to 1.5 s. Total number of MPs and RBCs in our simulations are listed in Table 1.
Table 1.
Total number of MPs and RBCs.
| D [μm] | Total number of MPs (N T) | Total number of RBCs | ||
|---|---|---|---|---|
| Hct = 0.2 | Hct = 0.1 | Hct = 0.05 | ||
| 8 | 10 | 10 | 5 | 3 |
| 10 | 18 | 16 | 8 | 4 |
| 12 | 24 | 22 | 11 | 5 |
| 14 | 32 | 32 | 16 | 8 |
| 18 | 64 | 52 | 26 | 14 |
| 22 | 94 | 78 | 40 | 20 |
Electronic supplementary material
Acknowledgements
We thank Mr. Shunichi Ishida, Dr. Stephanie Nix, Dr. Toshihiro Omori, Prof. Takuji Ishikawa, and Prof. Takami Yamaguchi for helpful discussion. This research was supported by JSPS KAKENHI Grant Numbers 25000008 and 16J11479.
Author Contributions
N.T. performed experiments; N.T. analyzed data; N.T. and Y.I. interpreted results of experiments; N.T. prepared figures; N.T. drafted manuscript; N.T. and Y.I. edited and revised manuscript; N.T. and Y.I. approved final version of manuscript; Y.I. conceived and designed research.
Competing Interests
The authors declare that they have no competing interests.
Footnotes
Electronic supplementary material
Supplementary information accompanies this paper at doi:10.1038/s41598-017-05924-7
Publisher's note: Springer Nature remains neutral with regard to jurisdictional claims in published maps and institutional affiliations.
References
- 1.Bao G, et al. USNCTAM perspective on mehanics in medicine. J. Roy. Soc. Interface. 2014;11:20140301. doi: 10.1098/rsif.2014.0301. [DOI] [PMC free article] [PubMed] [Google Scholar]
- 2.Kobayashi H, Watanabe R, Choyke PL. Improving conventional enhanced permeability and retention (EPR) effects; what is the appropriate target? Theranostics. 2014;4:81–89. doi: 10.7150/thno.7193. [DOI] [PMC free article] [PubMed] [Google Scholar]
- 3.Li Y, et al. Cell and nanoparticle transport in tumour microvasculature: the role of size, shape and surface functionality of nanoparticles. Interface Focus. 2015;6:20150086. doi: 10.1098/rsfs.2015.0086. [DOI] [PMC free article] [PubMed] [Google Scholar]
- 4.Blanco E, Shen H, Ferrari M. Principles of nanoparticle design for overcoming biological barriers to drug delivery. Nat. Biotechnol. 2015;33:941–951. doi: 10.1038/nbt.3330. [DOI] [PMC free article] [PubMed] [Google Scholar]
- 5.Tangelder GJ, Teirlinck HC, Slaaf DW, Reneman RS. Distribution of blood platelets flowing in arterioles. Am. J. Physiol. Heart Circ. Physiol. 1985;248:H318–H323. doi: 10.1152/ajpheart.1985.248.3.H318. [DOI] [PubMed] [Google Scholar]
- 6.Woldhuis B, Tangelder GJ, Slaaf DW, Reneman RS. Concentration profile of blood platelets differs in arterioles and venules. Am. J. Physiol. Heart Circ. Physiol. 1992;262:H1217–H1223. doi: 10.1152/ajpheart.1992.262.4.H1217. [DOI] [PubMed] [Google Scholar]
- 7.Aarts PM, et al. Blood platelets are concentrated near the wall and red blood cells, in the center in flowing. Arteriosclerosis. 1988;8:819–824. doi: 10.1161/01.ATV.8.6.819. [DOI] [PubMed] [Google Scholar]
- 8.Zhao R, Kameneva MV, Antaki JF. Investigation of platelet margination phenomena at elevated shear stress. Biorheology. 2007;44:161–177. [PubMed] [Google Scholar]
- 9.Charoenphol P, Huang RB, Eniola-Adefeso O. Potential role of size and hemodynamics in the efficacy of vascular-targeted spherical drug carriers. Biomaterials. 2010;31:1392–1402. doi: 10.1016/j.biomaterials.2009.11.007. [DOI] [PubMed] [Google Scholar]
- 10.Toy R, Hayden E, Shoup C, Baskaran H, Karathanasis E. The effects of particle size, density and shape on margination of nanoparticles in microcirculation. Nanotechnology. 2011;22:115101. doi: 10.1088/0957-4484/22/11/115101. [DOI] [PMC free article] [PubMed] [Google Scholar]
- 11.Krüger T. Effect of tube diameter and capillary number on platelet margination and near-wall dynamics. Rheol. Acta. 2016;55:511–526. doi: 10.1007/s00397-015-0891-6. [DOI] [Google Scholar]
- 12.Müller K, Fedosov DA, Gompper G. Margination of micro- and nano-particles in blood flow and its effect on drug delivery. Sci. Rep. 2014;4:4871. doi: 10.1038/srep04871. [DOI] [PMC free article] [PubMed] [Google Scholar]
- 13.Müller K, Fedosov DA, Gompper G. Understanding particle margination in blood flow – a step toward optimized drug delivery systems. Med. Eng. Phys. 2016;38:2–10. doi: 10.1016/j.medengphy.2015.08.009. [DOI] [PubMed] [Google Scholar]
- 14.Reasor DA, Jr, Mehrabadi M, Ku DN, Aidun CK. Determination of critical parameters in platelet margination. Ann. Biomed. Eng. 2013;41:238–249. doi: 10.1007/s10439-012-0648-7. [DOI] [PubMed] [Google Scholar]
- 15.Vahidkhah K, Diamond SL, Bagchi P. Platelet dynamics in three-dimensional simulation of whole blood. Biophys. J. 2014;100:2529–2540. doi: 10.1016/j.bpj.2014.04.028. [DOI] [PMC free article] [PubMed] [Google Scholar]
- 16.Vahidkhah K, Bagchi P. Microparticle shape effects on margination, near-wall dynamics and adhesion in a three-dimensional simulation of red blood cell suspension. Soft Matter. 2015;11:2097–2109. doi: 10.1039/C4SM02686A. [DOI] [PubMed] [Google Scholar]
- 17.Zhao H, Shaqfeh ESG. Shear-induced platelet margination in a microchannel. Phys. Rev. E. 2011;83:061924. doi: 10.1103/PhysRevE.83.061924. [DOI] [PubMed] [Google Scholar]
- 18.Zhao H, Shaqfeh ESG, Narsimhan V. Shear-induced particle migration and margination in a cellular suspension. Phys. Fluids. 2012;24:011902. doi: 10.1063/1.3677935. [DOI] [Google Scholar]
- 19.Fitzgibbon S, Spann AP, Qi QM, Shaqfeh ESG. In vitro measurement of particle margination in the microchannel flow: effect of varying hematocrit. Biophys. J. 2015;108:2601–2608. doi: 10.1016/j.bpj.2015.04.013. [DOI] [PMC free article] [PubMed] [Google Scholar]
- 20.Lee TR, et al. On the near-wall accumulation of injectable particles in the microcirculation: smaller is not better. Sci. Rep. 2013;3:2079. doi: 10.1038/srep02079. [DOI] [PMC free article] [PubMed] [Google Scholar]
- 21.Aroesty J, Gross FJ. Convection and diffusion in the microciruculation. Microvasc. Res. 1970;2:247–267. doi: 10.1016/0026-2862(70)90016-6. [DOI] [PubMed] [Google Scholar]
- 22.Wang H, Skalak R. Viscous flow in a cylindrical tube containing a line of spherical particles. J. Fluid Mech. 1969;38:75–96. doi: 10.1017/S002211206900005X. [DOI] [Google Scholar]
- 23.Fung YC. Stochastic flow in capillary blood vessels. Microvasc. Res. 1973;5:34–48. doi: 10.1016/S0026-2862(73)80005-6. [DOI] [PubMed] [Google Scholar]
- 24.Schmid-Schönbein GW, Skalak R, Usami S, Chien S. Cell distribution in capillary networks. Microvasc. Res. 1980;19:18–44. doi: 10.1016/0026-2862(80)90082-5. [DOI] [PubMed] [Google Scholar]
- 25.Secomb TW, Styp-Rekowska B, Pries AR. Two-dimensional simulation of red blood cell deformation and lateral migration in microvessels. Ann. Biomed. Eng. 2007;35:755–765. doi: 10.1007/s10439-007-9275-0. [DOI] [PubMed] [Google Scholar]
- 26.Skalak R, Branemark PI. Deformation of red blood cells in capillaries. Science. 1969;164:717–719. doi: 10.1126/science.164.3880.717. [DOI] [PubMed] [Google Scholar]
- 27.Yen RT, Fung YC. Effect of velocity distribution on red cell distribution in capillary blood vessels. Am. J. Physiol. Heart Circ. Physiol. 1978;235:H251–H257. doi: 10.1152/ajpheart.1978.235.2.H251. [DOI] [PubMed] [Google Scholar]
- 28.Gaehtgens P, Dührssen C, Albrecht KH. Motion, deformation, and interaction of blood cells and plasma during flow through narrow capillary tubes. Blood Cells. 1980;6:799–817. [PubMed] [Google Scholar]
- 29.Guido S, Tomaiuolo G. Microconfined flow behavior of red blood cells in vitro. C. R. Physique. 2009;10:751–763. doi: 10.1016/j.crhy.2009.10.002. [DOI] [PubMed] [Google Scholar]
- 30.Tomaiuolo G, Lanotte L, Ghigliotti G, Misbah C, Guido S. Red blood cell clustering in poiseuille microcapillary flow. Phys. Fluids. 2012;24:051903. doi: 10.1063/1.4721811. [DOI] [Google Scholar]
- 31.McWhirter JL, Noguchi H, Gompper G. Flow-induced clustering and alignment of vesicles and red blood cells in microcapillaries. Proc. Natl. Acad. Sci. USA. 2009;106:6039–6043. doi: 10.1073/pnas.0811484106. [DOI] [PMC free article] [PubMed] [Google Scholar]
- 32.McWhirter JL, Noguchi H, Gompper G. Deformation and clustering of red blood cells in microcapillary flows. Soft Matter. 2011;7:10967–10967. doi: 10.1039/c1sm05794d. [DOI] [Google Scholar]
- 33.Schmid-Schönbein GW, Usami S, Skalak R, Chien S. The interaction of leukocytes and erythrocytes in capillary and postcapillary vessels. Microvasc. Res. 1980;19:45–70. doi: 10.1016/0026-2862(80)90083-7. [DOI] [PubMed] [Google Scholar]
- 34.McWhirter JL, Noguchi H, Gompper G. Ordering and arrangement of deformed red blood cells in flow through microcapillaries. New J. Phys. 2012;14:085026. doi: 10.1088/1367-2630/14/8/085026. [DOI] [Google Scholar]
- 35.Fedosov DA, Fornleitner J, Gompper G. Margination of white blood cells in microcapillary flow. Phys. Rev. Lett. 2012;108:028104. doi: 10.1103/PhysRevLett.108.028104. [DOI] [PubMed] [Google Scholar]
- 36.Freund JB. Numerical simulation of flowing blood cells. Ann. Rev. Fluid Mech. 2014;46:67–95. doi: 10.1146/annurev-fluid-010313-141349. [DOI] [Google Scholar]
- 37.Koutsiaris AG, et al. Volume flow and wall shear stress quantification in the human conjunctival capillaries and post-capillary venules in vivo. Biorheol. 2007;44:375–386. [PubMed] [Google Scholar]
- 38.Saadatmand M, et al. Fluid particle diffusion through high-hematocrit blood flow within a capillary tube. J. Biomech. 2011;44:170–175. doi: 10.1016/j.jbiomech.2010.09.004. [DOI] [PubMed] [Google Scholar]
- 39.Lima R, Wada S, Tsubota K, Yamaguchi T. Confocal micro-PIV measurements of three-dimensional profiles of cell suspension flow in a square microchannel. Meas. Sci. Technol. 2006;17:797–808. doi: 10.1088/0957-0233/17/4/026. [DOI] [Google Scholar]
- 40.Lima R, et al. Measurement of individual red blood cell motions under high hematocrit conditions using a confocal micro-PTV system. Ann. Biomed. Eng. 2009;37:1546–1559. doi: 10.1007/s10439-009-9732-z. [DOI] [PubMed] [Google Scholar]
- 41.Ohmura T, Ichikawa M, Kamei K, Maeda YT. Oscillation and collective conveyance of water-in-oil droplets by microfluidic bolus flow. Appl. Phys. Lett. 2015;107:074102. doi: 10.1063/1.4928753. [DOI] [Google Scholar]
- 42.Skalak R, Tozeren A, Zarda RP, Chien S. Strain energy function of red blood cell membranes. Biophys. J. 1973;13:245–264. doi: 10.1016/S0006-3495(73)85983-1. [DOI] [PMC free article] [PubMed] [Google Scholar]
- 43.Takeishi N, Imai Y, Nakaaki K, Yamaguchi T, Ishikawa T. Leukocyte margination at arteriole shear rate. Physiol. Rep. 2014;2:e12037. doi: 10.14814/phy2.12037. [DOI] [PMC free article] [PubMed] [Google Scholar]
- 44.Li J, Dao M, Lim CT, Suresh S. Spectrin-level modeling of the cytoskeleton and optical tweezers stretching of the erythrocyte. Biophys. J. 2005;88:3707–6719. doi: 10.1529/biophysj.104.047332. [DOI] [PMC free article] [PubMed] [Google Scholar]
- 45.Puig-de-Morales-Marinkovic M, Turner KT, Butler JP, Fredberg JJ, Suresh S. Viscoelasticity of the human red blood cell. Am. J. Physiol. Cell Physiol. 2007;293:C597–C605. doi: 10.1152/ajpcell.00562.2006. [DOI] [PubMed] [Google Scholar]
- 46.Radmacher M, Fritz M, Kacher CM, Cleveland JP, Hansma PK. Measuring the viscoelastic properties of human platelets with the atomic force microscope. Biophys. J. 1996;70:556–567. doi: 10.1016/S0006-3495(96)79602-9. [DOI] [PMC free article] [PubMed] [Google Scholar]
- 47.Fedosov DA, Noguchi H, Gompper G. Multiscale modeling of blood flow: from single cells to blood rheology. Biomech. Model. Mechanobiol. 2014;13:239–258. doi: 10.1007/s10237-013-0497-9. [DOI] [PubMed] [Google Scholar]
- 48.Chen S, Doolen GD. Lattice boltzmann method for fluid flow. Annu. Rev. Fluid Mech. 1998;30:329–364. doi: 10.1146/annurev.fluid.30.1.329. [DOI] [Google Scholar]
- 49.Dupin MM, Halliday I, Care CM, Alboul L, Munn LL. Modeling the flow of dense suspensions of deformable particles in three dimensions. Phys. Rev. E. 2007;75:066707. doi: 10.1103/PhysRevE.75.066707. [DOI] [PMC free article] [PubMed] [Google Scholar]
- 50.Walter J, Salsac AV, Barthés-Biesel D, Le Tallec P. Coupling of finite element and boundary integral methods for a capsule in a stokes flow. Int. J. Numer. Meth. Eng. 2010;83:829–850. [Google Scholar]
- 51.Peskin CS. The immersed boundary method. Acta Numer. 2002;11:479–517. doi: 10.1017/S0962492902000077. [DOI] [Google Scholar]
- 52.Yokoi K. Efficient implementation of THINC scheme: a simple and practical smoothed VOF algorithm. J. Comput. Phys. 2007;226:1985–2002. doi: 10.1016/j.jcp.2007.06.020. [DOI] [Google Scholar]
- 53.Unverdi SO, Tryggvason G. A front-tracking method for viscous, incompressible, multi-fluid flows. J. Comput. Phys. 1992;100:25–37. doi: 10.1016/0021-9991(92)90307-K. [DOI] [Google Scholar]
- 54.Miki T, et al. Patient-specific modeling of pulmonary airflow using gpu cluster for the application in medical practice. Comput. Meth. Biomech. Biomed. Eng. 2012;15:771–778. doi: 10.1080/10255842.2011.560842. [DOI] [PubMed] [Google Scholar]
- 55.Takeishi N, Imai Y, Yamaguchi T, Ishikawa T. Flow of a circulating tumor cell and red blood cells in microvessels. Phys. Rev. E. 2015;92:063011. doi: 10.1103/PhysRevE.92.063011. [DOI] [PubMed] [Google Scholar]
- 56.Takeishi N, et al. Cell adhesion during bullet motion in capillaries. Am. Am. J. Physiol. Heart Circ. Physiol. 2016;311:H395–H403. doi: 10.1152/ajpheart.00241.2016. [DOI] [PubMed] [Google Scholar]
- 57.Frojmovic MM, Milton JG. Human platelet size, shape, and related functions in health and disease. Physiol. Rev. 1982;62:185–261. doi: 10.1152/physrev.1982.62.1.185. [DOI] [PubMed] [Google Scholar]
- 58.Italiano JE, Jr, et al. Mechanisms and implications of platelet discoid shape. Blood. 2003;101:4789–4796. doi: 10.1182/blood-2002-11-3491. [DOI] [PubMed] [Google Scholar]
Associated Data
This section collects any data citations, data availability statements, or supplementary materials included in this article.


