Abstract
Chemotaxis is a classic mechanism for guiding cell migration and an important topic in both fundamental cell biology and health science. Neutrophil is a widely used model to study eukaryotic cell migration and neutrophil chemotaxis itself can lead to protective or harmful immune actions to the body. While much has been learnt from past research about how neutrophils effectively navigate through a chemoattractant gradient, many interesting questions remain unclear. For example, while it is tempting to model neutrophil chemotaxis using the well-established biased random walk theory, the experimental proof was challenged by the cell’s highly persistent migration nature. Special experimental design is required to test the key predictions from the random walk model. Another question that interests the cell migration community for decades concerns the existence of chemotactic memory and its underlying mechanism. Although chemotactic memory has been suggested in various studies, a clear quantitative experimental demonstration will improve our understanding of the migratory memory effect. Motivated by these questions, we developed a microfluidic cell migration assay (so-called dual-docking chip or D2-Chip) that can test both the biased random walk model and the memory effect for neutrophil chemotaxis on a single chip enabled by multi-region gradient generation and dual-region cell alignment. Our results provide experimental support for the biased random walk model and chemotactic memory for neutrophil chemotaxis. Quantitative data analyses generate new insights into neutrophil chemotaxis and memory by making connections to entropic disorder, cell morphology and oscillating migratory response.
Introduction
A wide range of biological cells can sense soluble chemical concentration gradient and respond by directional cell migration along the gradient, a process term chemotaxis1. Chemotaxis plays governing roles in many fundamental physiological processes, ranging from immune battling of foreign pathogen invasion to neuronal communication and to tissue regeneration2–4. Incorrectly signaled chemotaxis can lead to various cellular malfunctions such as elevated effector cell infiltration to mis-targeted host tissues and subsequent autoimmune organ damage5. Furthermore, chemotaxis can be hijacked by tumor cells as an effective mechanism to translocate to distance organs6, 7. Thus, understanding the mechanism of chemotaxis is fundamentally important for curiosity-driven basic science research and can be highly translational to solve health problems8–10. Neutrophil is the most abundant type of white blood cells, serving at the front line for the body’s host defense11–14. Neutrophil is highly motile and has been widely used as a model cell system for studying cell migration and chemotaxis15. While much has been learnt from past research for neutrophil chemotaxis, some long-standing interesting questions are increasingly attracting researchers to revisit using new technologies. Among them, here we are particularly interested in predictions from a biased random walk model for chemotaxis and the chemotactic memory effect, which can be tested using a microfluidic cell migration assay.
Neutrophil chemotaxis was traditionally modeled as a deterministic spatial gradient sensing process in combination with stochasticity16. Chemoattractant gradient sensing is implemented by specific ligand-receptor interaction and its downstream signaling cascades to define the directional signal across the cell body, which guides the subsequent biophysical locomotion17. Stochasticity is introduced as noise to modulate the external chemotactic signal and cellular gradient sensing18. A threshold approach based on gradient sensing is typically employed to define the baseline randomness and directional migration19. In the context of deterministic gradient sensing, cells are able to interpret both the gradient steepness and mean concentration for chemotaxis20. By contrast, an increasing number of recent studies modeled chemotaxis as an adaptive process, which relies on dynamic and stochastic optimization of directional decision making within cell’s local chemoattractant environment21–23. This approach offers an interesting alternative approach for understanding chemotaxis and realizing the role of migratory morphology in gradient sensing. From a physicist’s point of view, it is tempting to model chemotaxis as a biased random walk of microparticles. The random walk theory is well-established and was applied to model many biological systems such as DNA, cytoskeleton, diffusion and mixing of biological contents24–26. Particularly, biased random walk achieved great success to quantitatively describe chemotaxis of small suspension cells such as bacteria27. A similar approach was previously used to model chemotaxis of larger eukaryotic cells such as neutrophils19. However, although both modeling and experiments in this direction have been reported27–30, experimental evidence is still lacking. It is especially challenging to test the biased random walk model in commonly-used 2D in-vitro cell migration systems, due to highly persistent migration of these surface crawling cells and other external effects such as flows. Consistently, the random walk theory often comes short to effectively describe chemokinetic cell migration data in microfluidic devices31. In this context, we propose to experimentally test the dynamic change of synchronized cell migration toward a chemoattractant gradient enabled by pre-alignment of cells at identical initial positions relative to the gradient. Such a design will offer a window to observe chemotactic migration with respect to the predictions from the biased random walk model. Specifically, we expect decreased synchronization of chemotaxis among cells over time due to accumulated statistical variation of cell migration and a gradually reduced chemoattractant gradient dependent migratory bias at each time step.
Another interesting and challenging topic in neutrophil chemotaxis concerns the existence of cell migratory memory and its underlying mechanism. In the context of chemotaxis, we define the memory as the phenomenon that the cell’s chemotactic migratory behavior in its current chemoattractant environment is affected by the cell’s previous migration history. Experimental and modeling efforts in this direction go back a long way in the field of cell migration research8, 15, 32–40. Sensitive morphological, orientation and migratory response of neutrophils to temporal variations of chemoattractant fields, which depends on the cell’s previous chemoattractant exposure, were consistently reported21, 32, 37. Furthermore, retarded adjustment of chemotactic migration in response to spatial changes of chemoattractant gradients was clearly demonstrated8, 33. We recently showed that chemotactic memory can be reflected by the chemotaxis history dependent chemotaxis-to-flowtaxis transition in spatially-varying gradient fields using a microfluidic device33. Similarly, a recent study further suggested that cells can initiate and maintain chemotactic migration in response to chemoattractant waves and demonstrated the importance of localized cytoskeleton structure for preserving chemotactic memory37. However, a common drawback of these previous studies is the lack of spatial control of cell positions in their respective experimental systems, and the conclusion was often drawn based on the average of individual cell measurements with significant background variations. Effort was made to calibrate individual cell variation in the analysis but the pitfall of this approach for introducing subjectiveness remains33. In this regard, here we propose to design an experiment to better test the chemotactic memory using again the cell alignment technique and multi-region chemoattractant field generation. This approach will allow us to simultaneously monitor the memory effect of a group of pre-aligned cells as they migrate through adjacently configured gradient and gradient-free regions.
The proposed new experiments to test the biased random walk model and chemotactic memory effect require a suitable cell migration assay that permits controlled cell alignment and multi-region gradient generation. In addition, it is desirable to perform both experiments through a single assay. For these reasons, we developed a microfluidic cell migration device, so-called dual-docking chip or D2-Chip, to enable such dual experiments on a single chip and address the respective interesting questions concerning neutrophil chemotaxis. Microfluidic devices offer useful experimental tools for cell biology research owing to advantages in miniaturization and microenvironmental control. Over the last nearly two decades, various microfluidic devices and systems have been widely applied for quantitative cell migration and chemotaxis studies41, 42. The D2-Chip inherited the useful designs from previously reported devices in gradient control and cell docking43–46, and further developed new features to permit dual-region cell alignment and multi-region gradient generation, which critically enabled the proposed dual cell migration experiments in this study. Confining cells to microchannels has the added advantage of allowing for more precise measurements of chemotaxis parameters. Similar strategies to control cell position or gradient generation for microfluidic cell migration experiments have been reported previously47–49. Our results support the biased random walk as one possible model for describing neutrophil chemotaxis and demonstrate the chemotactic memory effect. Comprehensive in-depth quantitative data analysis methods were applied for interpreting the experimental data leading to new insights for neutrophil chemotaxis. Computer simulations based on the biased random walk and receptor-based gradient sensing model were performed to compare with the experiments.
Materials and Methods
Design and fabrication of microfluidic device
Microfluidic device with two-layer features was design using Solidworks (Dassault Systemes S.A., ver. 2013) and the design was printed to a transparency mask at 24,000 dpi resolution (Fineline Imaging). The mold of the design was fabricated using standard photolithographic and soft-lithographic techniques50. Briefly, a 3 μm thick layer defined the docking structures and another 70 μm thick layer defined the fluidic channels. Fabrication of the master molds was performed by patterning two layers of SU-8 photoresist (Microchem Corporation) on a silicon wafer as described previously51. The SU-8 mold was molded by polydimethylsiloxane (PDMS)(Sylgard 184, Dow Corning) to create the negative replica of the patterns. The inlets and outlets were punched out of PDMS followed by bonding the PDMS replica to a glass slide using an air plasma cleaner (Harrick Plasma, PDC-001) to complete the device assembly. The microfluidic channel was coated with fibronectin (Corning) for 1 hour followed by blocking with 0.4% BSA in RPMI-1640 for another 1 hour all at room temperature before cell migration experiments.
Gradient measurement and computer simulation
To generate the gradient, equal volumes of medium with or without chemoattractant were added to the microfluidic device from the source inlets. The pressure difference between the source inlets and the common outlet drives the fluid flows in the source channel and the sink channel. The cell inlets and outlet were sealed using adhesive tapes during image capturing progress. Diffusion of the chemoattractant solution and the medium through the thin barrier channels generates a stable linear chemoattractant gradient in the middle gradient channel at the equilibrium state. The concentration gradient was verified by measuring the intensity profile of FITC-Dextran (Sigma-Aldrich) additive to the chemoattractant solution using a fluorescence microscope (Nikon Ti-U). The fluorescence micrograph of the gradient was analyzed using ImageJ (NIH, version 1.44). The gradient profiles in the middle channel and the barrier channels were also simulated using COMSOL Multiphysics 5.2. We applied the 2D incompressible Navier-Stokes equation to simulate the flow field, and the transient convection-diffusion equation to simulate the concentration distribution in the channel. The parameters of N-Formylmethionine-leucyl-phenylalanine (fMLP, Sigma-Aldrich) were adapted from the literature44.
Cell preparation
Human blood samples were obtained by venipuncture from healthy donors under an ethics protocol approved by the Joint-Faculty Research Ethics Board at the University of Manitoba. Informed written consent form was obtained from all participants by the recruiting staff at the Victoria General Hospital in Winnipeg. Neutrophils were separated using a magnetic negative neutrophil isolation kit directly from the blood sample (EasySep Direct, STEMCELL Technologies). Isolated neutrophils were re-suspended in the migration medium (RPMI-1640 with 0.4% BSA) and kept at 37°C before experiments within 8 hours.
Cell migration experiment
Cell loading step
Before loading cells, we emptied the inlets and outlets of the microfluidic device. Then neutrophils were loaded to the middle gradient channel of the microfluidic device from the cell loading port. The pressure difference between the middle gradient channel and outer source/sink channels pushed the cells toward the channel wall and aligned the cells along the two sides of the middle gradient channel due to the thin barrier channels. After the cells settled beside the thin barrier channels, the remaining cell solution in the cell loading port was removed.
Gradient generation
The chemoattractant solution (i.e. fMLP) in RPMI-1640 with 0.4% BSA and the migration medium (RPMI-1640 with 0.4% BSA) were added to the device to generate the gradient in the middle gradient channel as described before.
Imaging capturing
The cell inlet and outlet were sealed using tapes during image capturing progress. The microfluidic device was placed under an inverted microscope (Nikon Ti-U) and cell migration images were recorded at 6 frames/min for 25 minutes with an environmental control chamber to maintain the temperature at 37 °C throughout the experiments. We chose the 25 minutes experiment period based on the following reasons: neutrophils can migrate at the speed in the order of 10μm/min. The width of the gradient channel in the D2-Chip is 300 μm. Thus, 25 minutes of experiment would allow the cells to migrate across the channel length. Both the chemotaxis experiment and the memory effect experiment were performed in the same device, which is one of the main features of this D2-Chip. The cell migration assay was repeated independently 3 times for each condition. The gradient was verified before and after each experiment.
Cell tracking and data analysis
Cell migration analysis
Movement of individual cells was tracked using the Manual Tracking plug-in in ImageJ. Only aligned cells by the docking structure were chosen for tracking. Quantitative cell migration parameters including (1) chemotactic index (CI), which is the ratio of the cell displacement in the gradient direction to the total migration distance; and (2) migration speed (V), which is the total migration distance over the experiment period, were calculated from the cell tracking data following previously established methods52. Moreover, we evaluated the temporal change of CI and V during the experiment. We divided the 25 minutes period to 10 intervals of 2.5 minutes and we calculated the individual CI and V in each 2.5 minutes interval. The chosen 2.5 minutes time interval was based on the previously reported persistence time of neutrophil migration53.
In this study, we further defined a new parameter, the chemotactic entropy (CE) to describe the level of disorder of cell migration direction in response to a chemoattractant gradient.
Here ni is the number of cells fall in the ith angle interval; i is an integer from 1 to 12 as the index label for the 12 angle intervals; N is the total number of cells. The first angle interval (i=1) is set between and ; the following angle intervals rotate counterclockwisely with increasing i and increment. Thus is the migration angle state density for the ith angle interval.|Δθi| is the chemotactic weighting factor (value range between 0 and π), which is the absolute angle difference between the migration angle state (i.e. use for the ith angle interval) and the gradient direction at through the shortest path. The migration angle of each cell was defined as the angle of the connecting line between the cell’s initial and final position during each 2.5 minutes interval of the experiment with respect to the positive horizontal direction, and was used to compute the time-dependent CE. Thus, highly directional migration toward the gradient direction will have a smaller value of CE, and random migration or migration against the gradient direction will have a larger value of CE. It is worth pointing out that CE does not distinguish cells with the same migration angle but different migration distance. Thus, CE reflects the cells’ chemotactic orientation disorder.
Cell morphology analysis
We calculated the cell’s time-dependent aspect ratio and area using Fiji, an image processing package for ImageJ. Briefly, the cell boundary was segmented, and the best fitting ellipse of the cell boundary was calculated. The aspect ratio was calculated as the ratio of the major axis to the minor axis of the best fitting ellipse. The cell area was calculated from the best fitting ellipse of the cell.
All parameters were calculated using the MATLAB software and presented as the average value ± standard error of the mean (s.e.m.). Three independent experiments for each condition were analyzed and 40 cells were analyzed for each experiment. For the aspect ratio and cell area analysis, 10 cells were analyzed for each experiment. Statistical analyses were performed using the Student’s t-test. The difference was considered statistically significant at p < 0.05 (indicated by “*”). The data shown in the figures were selected from representative experiments to simplify the presentation. The general results in different repeated experiments are consistent. On the other hand, the exact cell migration parameter values can vary from experiment to experiment.
Cell migration modeling and simulation
The biased random walk model for chemotaxis was developed and the computer simulation was performed in MATLAB as detailed in the Supplementary Information S1. The cell orientation bias at each time step was assumed to be proportional to the ligand-receptor occupancy difference across the cell body in the cell’s local ligand concentration field. The kinetic parameters for ligand-receptor interactions and the cell model were adapted from previous models26, 54. Ligand gradient configuration and other spatial dimension parameters for the cell migration simulation were derived from our microfluidic cell migration experiments.
Results
The D2-Chip and gradient generation
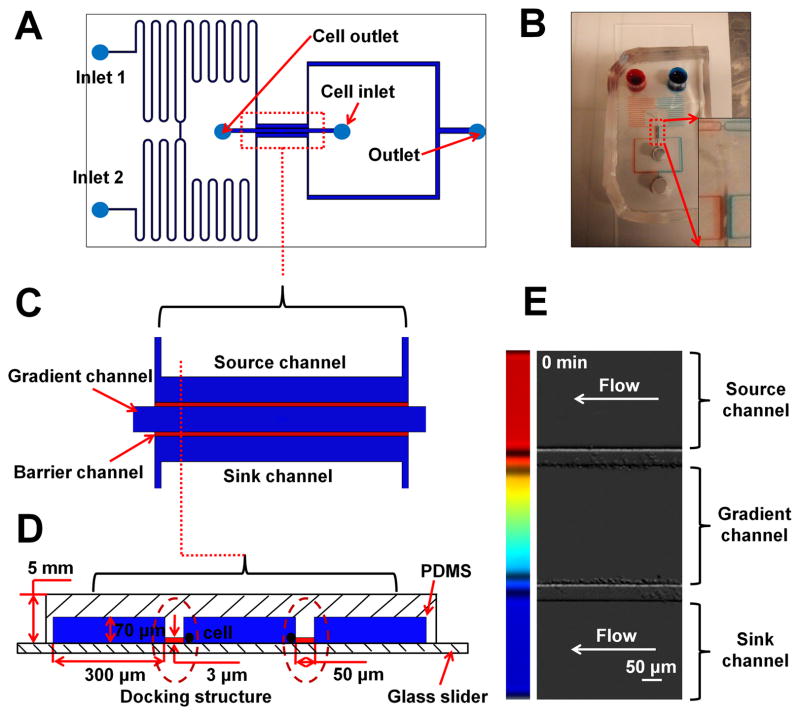
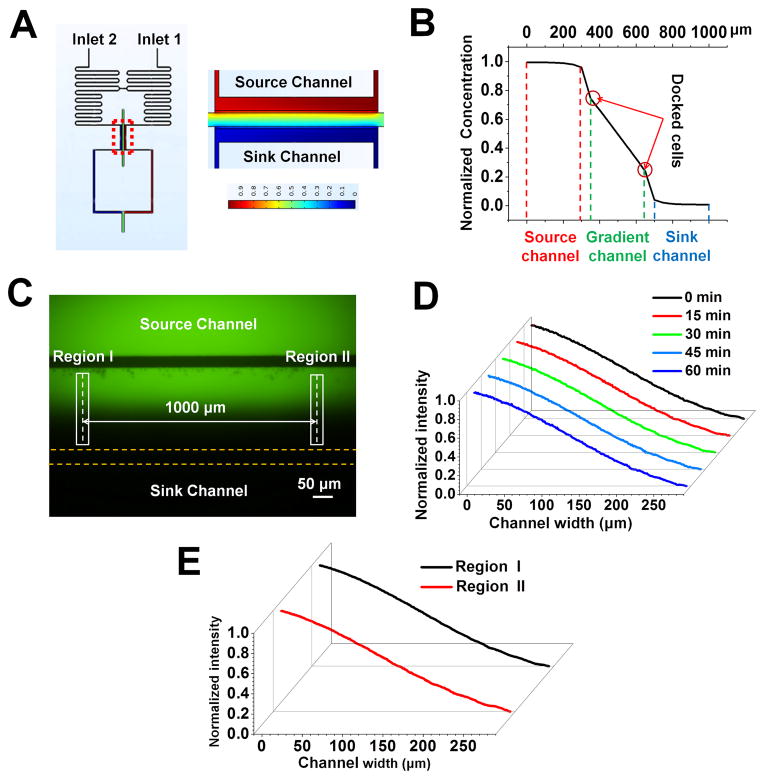
The D2-Chip consists of a middle gradient channel, which is sandwiched by an outer source channel and an outer sink channel, and the source/sink channels are connected to the middle gradient channel by thin barrier channels (Fig. 1). The gradient channel, source channel and sink channel are 70 μm (H)×300 μm (W). The barrier channels are 3 μm (H)×50 μm (W). Two serpentine channels are designed at upstream of the source and sink channel. The serpentine channels are connected midway through a short bridge channel (200 μm) to balance the pressure based on a previously reported strategy43, 55. Then the serpentine channels split again to connect with the source channel and the sink channel, which are later connected at the downstream into a single channel with a common outlet. By this strategy, equal-pressure flows of the chemoattractant solution and medium can be maintained in the source channel and the sink channel. After the chemoattractant solution and medium are added to the inlets, it takes ~ 5 minutes for the solutions to reach the source and sink channels. During this period, cells are not exposed to the chemoattractant solution. Once the solutions reach the source and sink channels, the gradient is generated in the middle gradient channel within 1 minute. Diffusion of the chemoattractant solution and medium into the middle channel through the barrier channels is expected to generate a stable linear chemoattractant concentration gradient in the middle channel at the equilibrium state. Similar strategies for gradient generation have been reported previously48, 56, 57. In this study, gradient generation in the D2-Chip was verified by both Multiphysics modeling and the experiments (Fig. 2). The modeling result shows the expected linear gradient in the middle channel (Fig. 2B). In addition, the modeling predicts a sharp gradient developed in each barrier channel (Fig. 2B). The normalized chemoattractant concentration in the source channel and sink channel is basically uniform at 1 and 0, respectively. Consistently, our experimental results confirmed the balanced pressure in the bridge channel (data no shown) and generation of identical linear gradient in the middle channel. The gradient profiles in two different positions (1000 μm apart) along the middle channel are compared and the result shows no statistically significant difference (Fig. 2C;2E). The gradient is stable for at least 1 hour, which is sufficiently long for neutrophil migration experiments (Fig. 2D). Because the barrier channels are very thin, the fluorescence signal in these channels is too weak to measure using conventional fluorescence microscopy. Collectively, different adjacent gradient profiles are configured in the D2-Chip allowing chemotaxis assay and studying the chemotactic migratory memory effect.
Figure 1. Illustration of the D2-Chip.
(A) Illustration of the design of D2-Chip; (B) A picture of a real D2-Chip. The zoom-in image shows the bridge channel and the region for the parallel gradient channel, source channel and sink channel; (C) Top view of the region for the parallel gradient channel, source channel and sink channel; (D) Side view of the region for the parallel gradient channel, source channel and sink channel; (E) Dual docking of neutrophils at the two sides of the middle channel in the D2-Chip.
Figure 2. Gradient generation in the D2-Chip.
(A) Heat map of the simulated concentration field in the bridge channel, and the parallel gradient channel, source channel and sink channel; (B) Simulated gradient profile in the parallel gradient channel, source channel and sink channel; (C) The fluorescent image of the parallel gradient channel, source channel and sink channel; (D) Gradient profile at different time points in the middle gradient channel. (E) Gradient profiles at two different positions (1000 μm apart) along the middle gradient channel as labeled in (C).
Cell alignment and dose-dependent neutrophil chemotaxis in the D2-Chip
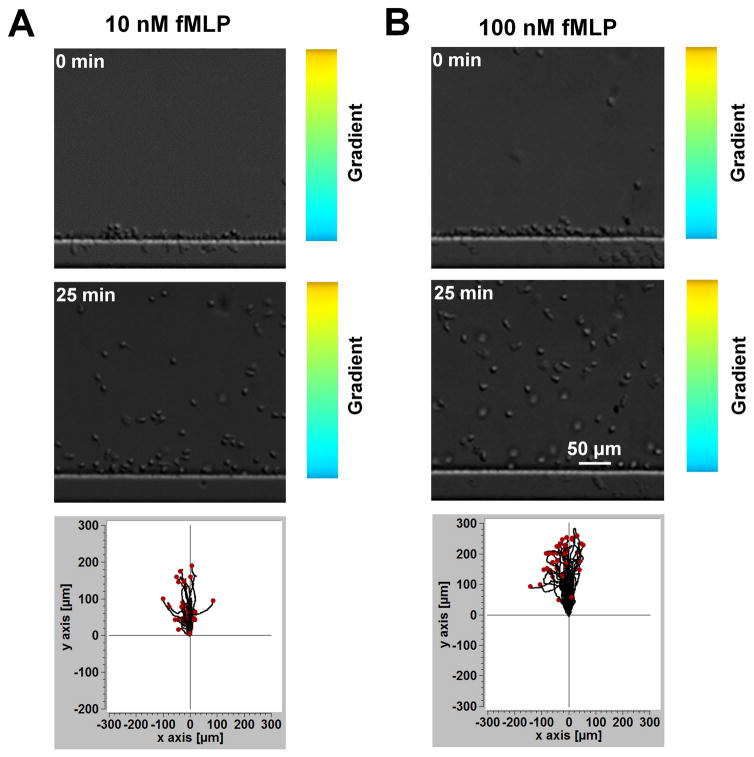
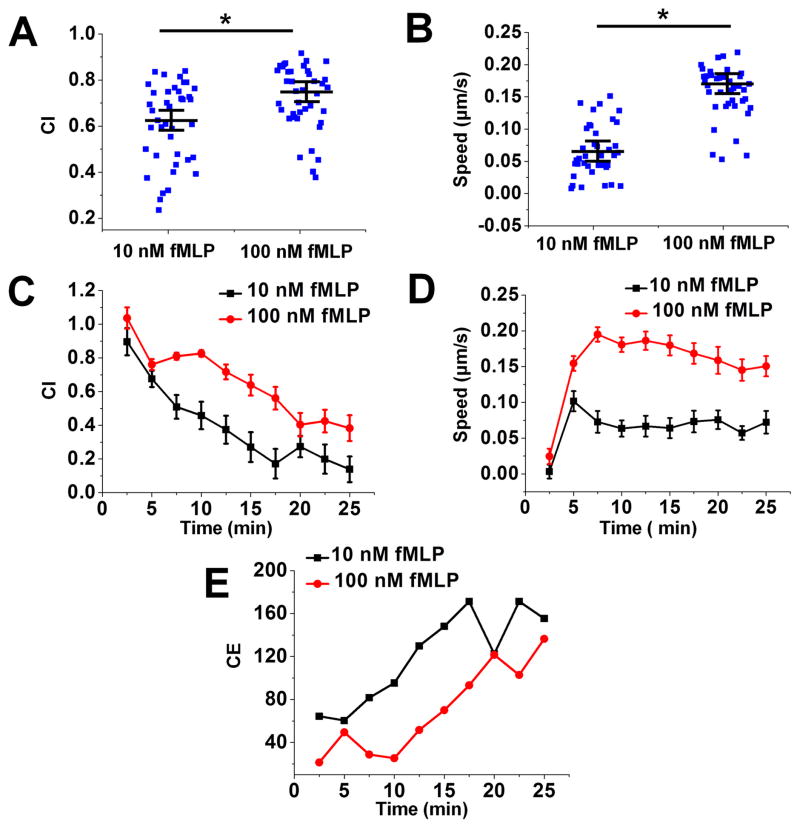
To further validate the key functions of the D2-Chip, we tested simultaneous cell alignment at the two sides of the middle gradient channel. Upon loading the cells into the middle gradient channel through the cell loading port, cells were pushed toward either side of the channel edge due to the pressure difference between the middle channel and the source/sink channels. Because of the very thin barrier channels, which separate the middle gradient channel and the source/sink channels, spherical cells of a larger diameter (~10 μm) were pushed against the edges of the main channel but couldn’t cross the barrier channel. The low flow speed at the channel edge allows cells to firmly settle on the fibronectin-coated channel surface within a few minutes (Fig. 1E). Thus, the dual-region cell alignment function of the D2-Chip was achieved, which is required for the cell migration experiment in this study. It is worth pointing out that in the current experiment there is no control of the spacing between aligned cells. Lowering the cell loading density did not affect the spacing between aligned cells. On the other hand, the current cell loading can typically align a single layer or sometimes double layers of cells along the docking channels. We consider this acceptable for the purpose of the current cell migration experiments. Next, we ask if the D2-Chip can be used to effectively test neutrophil chemotaxis. We applied a 10 nM fMLP gradient or a 100 nM fMLP gradient to the middle gradient channel and monitored the migration of the aligned cells. In both gradients, cells aligned by the sink channel exhibited clear chemotactic migration toward the fMLP gradient as shown by comparison of cell images at the beginning and the end of the experiment and the corresponding cell tracks (Fig. 3; SI Movie 1). Quantitative cell migration data analysis further showed stronger chemotactic migration (i.e. CI) and cell motility (i.e. V) in the 100 nM fMLP gradient than the 10 nM fMLP gradient (Fig. 4A–B). Furthermore, CI reduces over time while CE increases over time in the 10 nM and 100 nM fMLP gradient (Fig. 4C;4E). CE is higher in the 10 nM fMLP gradient than the 100 nM fMLP gradient (Fig. 4E). Thus, as expected, neutrophil chemotaxis is chemoattractant gradient dose-dependent, and the level of time-dependent chemotaxis is associated with the entropic disorder of cell migration angle. Different than the time-dependent pattern of CI and CE, cell migration speed rapidly increases to the peak level within the first 5–8 minutes of the chemotaxis experiment in the 10 nM fMLP gradient and the 100 nM fMLP gradient, and this plateau speed is relatively stable for the rest of the experiment period (Fig. 4D). Altogether, the chemotaxis assay function of the D2-Chip was successfully demonstrated.
Figure 3. Chemotaxis of neutrophil docked in the middle channel by the sink channel to fMLP gradients.
(A) Images of cells in a 10 nM fMLP gradient at the beginning (0 min) and in the end (25 min) of the experiment and the cell tracks; (B) Images of cells in a 100 nM fMLP gradient at the beginning (0 min) and in the end (25 min) of the experiment and the cell tracks.
Figure 4. Quantitative data analysis of neutrophil chemotaxis analysis in the middle gradient channel.
(A) Chemotactic index (CI) to a 10 nM fMLP gradient and a 100 nM fMLP gradient; The blue squares are the CI for individual cells; The long line indicates the average CI and the error bars indicate s.e.m.; (B) Cell speed to a 10 nM fMLP gradient and a 100 nM fMLP gradient; The blue squares are the speed for individual cells; The long line indicates the average speed and the error bars indicate s.e.m.; (C) Time-dependent CI to a 10 nM fMLP gradient and a 100 nM fMLP gradient; (D) Time-dependent speed to a 10 nM fMLP gradient and a 100 nM fMLP gradient; (E) Time-dependent CE to a 10 nM fMLP gradient and a 100 nM fMLP gradient. The data shown are from representative experiments.
Neutrophil chemotaxis as a biased random walk
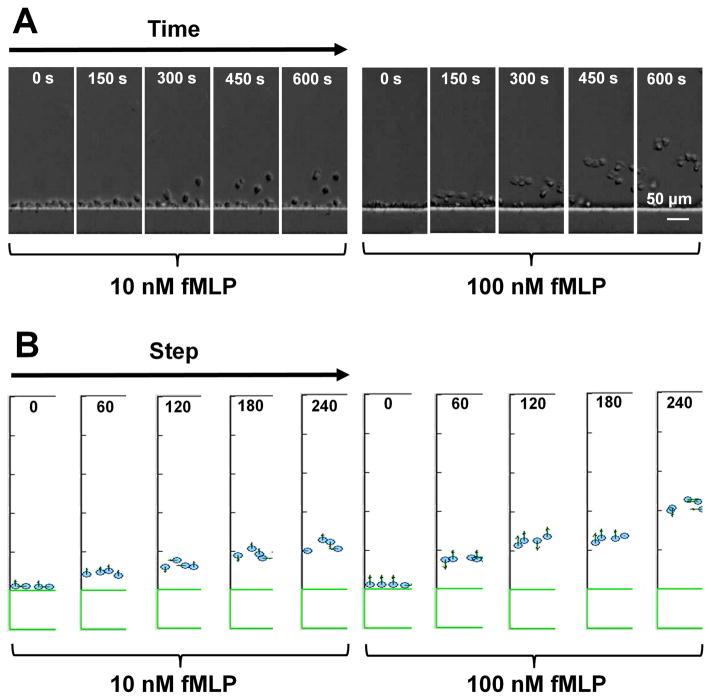
Cell alignment by the sink channel effectively configured cells with identical initial positions in the main gradient channel. This unique feature allowed us to monitor the time-evolvement of diversified chemotactic migration among cells with the same initial condition. This is predicted, not exclusively, by the biased random walk model, which assumes a chemoattractant gradient dependent migratory bias at each time step while the accumulated statistical variation over time will result in de-synchronization of chemotactic migration for different cells. Indeed, our results showed that in the 100 nM fMLP gradient, cells initially migrated toward the gradient in a highly synchronized manner and such synchronized migration decreased over time (Fig. 5A; SI Movie 2). By contrast, the synchronized chemotactic migration was not apparent in the much lower 10 nM fMLP gradient over the same time frame (Fig. 5A; SI Movie 2). Consistently, time-dependent cell migration data analysis showed a decay of CI over time from the initial near perfect chemotaxis (i.e. CI is close to +1 at the early time points) in both the 10 nM fMLP and 100 nM fMLP gradients following different dynamics (Fig. 4C). Cell migration angles became more disordered over time as reflected by increased CE (Fig. 4E). On the other hand, cell speed increased over time to different plateaus depending on the dose of fMLP gradient (Fig. 4D). These experimental observations were conceptually reproduced by computer simulations based on the biased random walk and receptor-based gradient sensing model (Fig. 5B; Supplementary Information S1; SI Movie 3).
Figure 5. Representative experiment and simulation results showing synchronized neutrophil migration in the middle channel to a 100 nM fMLP gradient but not a 10 nM fMLP gradient.
(A) Images of representative cells migrating in a 10 nM fMLP or a 100 nM fMLP at different time points; (B) Images of representative simulation cells migrating in a 10 nM fMLP or a 100 nM fMLP at different time points based on the biased random walk model.
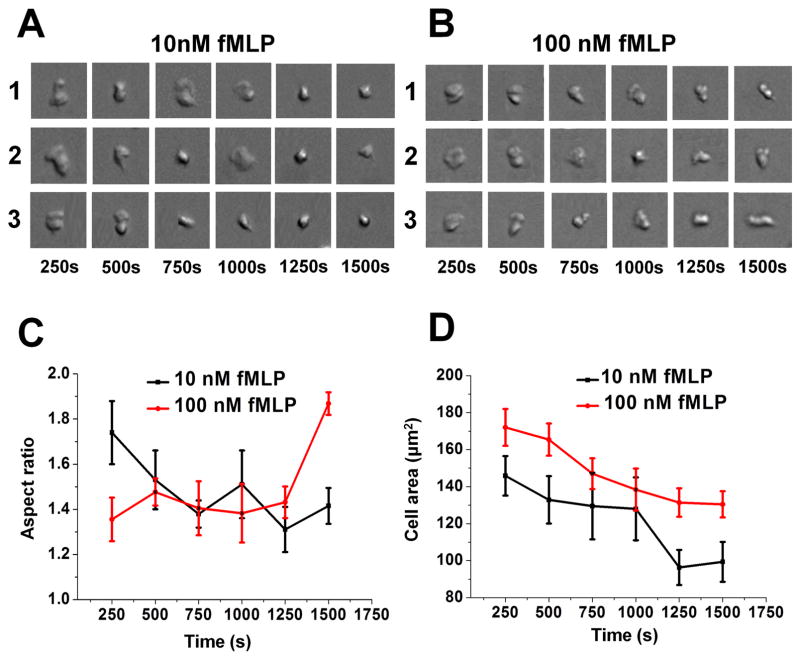
In addition, we performed time-dependent cell morphology analysis. Our results showed that the cell aspect ratio increases (and therefore elongated cell polarity) over time in the 100 nM fMLP gradient, but decreases (and therefore rounding cell shape) over time in the 10 nM fMLP gradient (Fig. 6A–C). In 10 nM and 100 nM fMLP gradients, the planar cell area on the substrate decreases over time (Fig. 6D). Together with the observed stronger chemotaxis in the 100 nM fMLP gradient, the cell morphology analysis suggests the direct correlation between chemotaxis and elongated cell polarity.
Figure 6. Time-dependent cell morphology analysis.
(A) Images of 3 representative cells with changing morphology over time as they migrate from the lower region to the higher region of a 10 nM fMLP gradient; (B) Images of 3 representative cells with changing morphology over time as they migrate from the lower region to the higher region of a 100 nM fMLP gradient; (C) Average cell aspect ratio over time in different fMLP gradients based on all cells analyzed from a representative experiment; (D) Average planar cell area over time in different fMLP gradients based on all cells analyzed from a representative experiment.
Furthermore, the dynamic change of cell elongation, especially in the 100 nM fMLP gradient, suggests the dynamic cell morphology adjustment to optimize gradient sensing and motility. More specifically, we suspect that the fan-like cell morphology facilitates cell gradient sensing in the lower gradient region while the elongated cell morphology facilitate cell motility in the higher gradient region.
Memory effect of neutrophil chemotaxis
In the same set of experiment, we monitored the migration of cells aligned by the source channel in response to the fMLP fields in the barrier channel and the source channel. Again, the cell alignment feature of the D2-Chip configured the identical initial cell positions, which will result in similar chemotactic memory for cells after they migrated across the barrier channel into the source channel. It is worth pointing out that the cell alignment was not always perfect and some cells were not aligned, which will be excluded from analysis. Then this chemotactic memory, if it exists, can be revealed by characterizing the cell’s continued directional migration in the uniform fMLP field in the source channel. The gradient generation strategy in the D2-Chip assures a sharp fMLP gradient in the barrier channel and a uniform fMLP field in the source channel (Fig. 2B), which is significantly advantageous compared to our previously used strategy to produce the similar gradient profile based on flow mixing at high flow rate33.
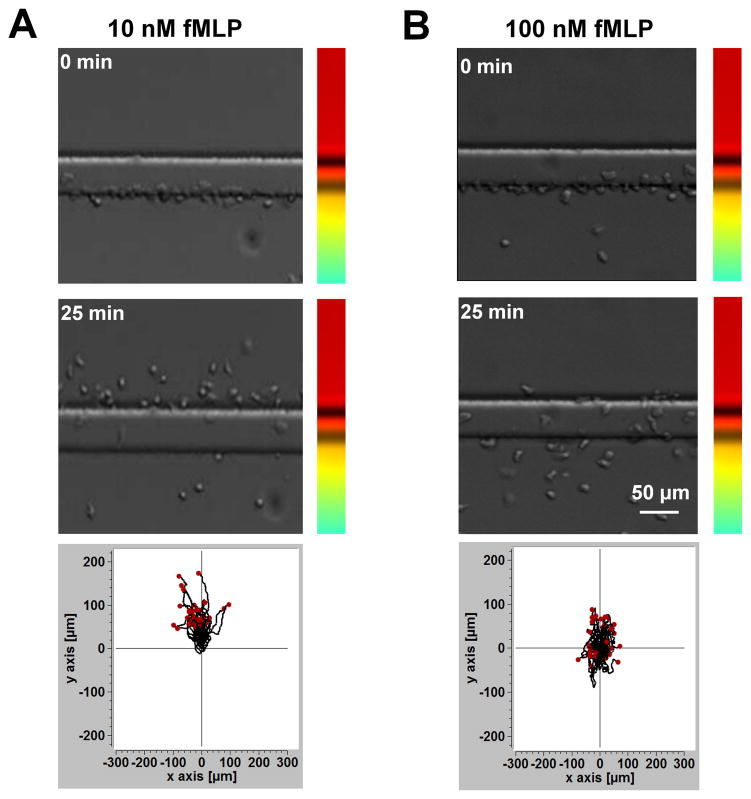
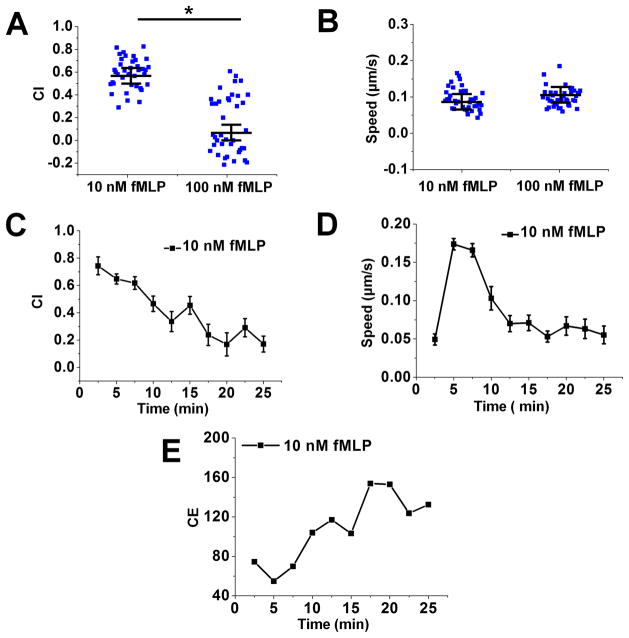
Indeed, our results showed that with the configuration of an uniform 10 nM fMLP field in the source channel, cells robustly migrated across the barrier channel, and continued their migration for a considerable distance into the uniform fMLP field in the source channel over the 25 minutes experiment (Fig. 7A; SI Movie 3). Consistently, time-dependent cell migration data analysis showed a decay of both CI and migration speed over time for cell migration in the source channel, which is associated with increased CE (Fig. 8C–E). By contrast, over the 25 minutes experiment, with the configuration of a much higher uniform 100 nM fMLP field in the source channel, many cells migrated within the barrier channel but could not enter the source channel, and other cells migrated back into the middle gradient channel, thus exhibiting overall random migration (Fig. 7B; SI Movie 4). The observed backward migration is consistent with the reported reverse cell migration away from the high concentration region of the gradient58, 59. The mechanism of such reverse migration is still not clear. In our experiment, we speculate that the cell’s chemotactic migration is saturated in the high chemoattractant concentration region so they tend to migrate to the region, where the chemotactic signal has better contrast and also has more free space in the middle gradient channel. Quantitative data analysis confirmed the higher CI in the 10 nM fMLP gradient than the 100 nM fMLP experiment while cell speed is comparable under both conditions (Fig. 8A–B).
Figure 7. Memory effect of neutrophil chemotaxis.
(A) Images of representative cells docked in the middle channel by the source channel with 10 nM fMLP at the beginning (0 min) and in the end (25 min) of the experiment and the cell tracks; (B) Images of representative cells docked in the middle channel by the source channel with 100 nM fMLP at the beginning (0 min) and in the end (25 min) of the experiment and the cell tracks.
Figure 8. Quantitative data analysis for the memory effect of neutrophil chemotaxis.
(A) CI for the 10 nM fMLP experiment and 100 nM fMLP experiment; The blue squares are the CI for individual cells; The long line indicates the average CI and the error bars indicate s.e.m.; (B) Cell speed for the 10 nM fMLP experiment and 100 nM fMLP experiment; The blue squares are the speed for individual cells; The long line indicates the average speed and the error bars indicate s.e.m.; (C) Time-dependent CI for the 10 nM fMLP experiment; (D) Time-dependent speed for the 10 nM fMLP experiment; (E) Time-dependent CE for the 10 nM fMLP experiment. The data shown are from representative experiments.
Furthermore, we mimicked transendothelial neutrophil migration for the memory effect in the D2-Chip (Supplementary Information S1). HUVEC were patterned along the edge of the source channel of the D2-Chip based on the pressure difference between the middle gradient channel and source channel. After HUVEC were seeded, neutrophils were loaded to middle gradient channel and aligned along the docking barrier channels. Then the fMLP gradient was applied for cell migration experiment. Similar microfluidics-based strategy for transendothelial migration has been reported previously60–62. Our preliminary results consistently show that neutrophils can migrate into the 10 nM fMLP source channel through the barrier channel and an additional HUVEC layer (Fig. S3A). By contrast, cells couldn’t migrate into the 100nM fMLP source channel through the HUVEC layer (Fig. S3A). Although the patterned HUVEC layer in our current experiments only mimics the vessel endothelial layer in a limited manner, the preliminary results from these experiments suggest the potential importance of chemotactic memory in extravasation.
In addition, we performed the cell turning number analysis for the memory effect. We measured the number of times that a cell makes U turns or switches migration direction toward or away from the gradient in the barrier channel before it enters the source channel (Supplementary Information S1; Fig. S3B). Our results show that for the 10 nM fMLP experiment, many cells directly entered the source channel and other cells made less turns/switches (Fig. S3C). By contrast, in the 100 nM fMLP experiment, cells made much more turns/switches and most cells couldn’t enter the source channel (Fig. S3C). These results suggest that the overall chemotactic memory effect may be a result of the oscillating migratory response between chemotaxis and chemorepulsion. The frequency of this oscillatory migration is expected to mediate the memory effect.
Collectively, our result provided a clear experimental demonstration of the chemotactic memory effect and suggested possible mechanism and physiological relevance.
Discussion
Our results support the biased random walk as a possible model for describing neutrophil chemotaxis in a 2D substrate but do not exclude other models. For example, a deterministic spatial gradient sensing model combined with variation of individual cells in gradient sensing and motility would in principle predict the same result. However, while both models are valid, the biased random walk model is more attractive owing to its mechanistic simplicity. In fact, our model integrated useful features from both models by using receptor-based deterministic gradient sensing to define the chemotactic bias for driving the downstream random walk. In addition, cell-cell interactions can also contribute to the synchronized chemotaxis. However, visualization of cell migration from the time-lapse movies does not indicate strong cell-cell interactions. The implication with the biased random walk model in operation for chemotaxis is broad and insightful. For example, such a model would allow us to neglect complex biological differences among individual cells in their chemotaxis ability, but instead deal with the deviation as a statistical problem. This can be particularly applicable to neutrophils given their abundance in white blood cells and high motility. As another example, the biased random walk model would predict effective neutrophil chemotaxis in a very shallow or noisy gradient (which can be physiologically relevant in vivo; or equivalently chemotaxis of abnormal neutrophils with low gradient sensing ability in a strong gradient) over sufficient time steps without imposing any chemotactic signaling amplification mechanism. In addition to directionality and motility measurements of neutrophil migration, we further compared the morphology change of chemotaxing cells in different gradient conditions. Together with the observed stronger chemotaxis in the 100 nM fMLP gradient, the cell morphology analysis suggests the direct correlation between chemotaxis and elongated cell polarity. Furthermore, the dynamic change of cell elongation, especially in the 100 nM fMLP gradient, suggests the dynamic cell morphology adjustment to optimize gradient sensing and motility.
To test the chemotactic memory, our experimental design configured well-controlled multi-region spatial chemoattractant fields. Although the 1D cell migration system has the advantage for measuring the memory effect44, 63, we chose the 2D cell migration system in this study to avoid the cell confinement effect in the 1D system, which can be difficult to decouple from chemotaxis. Our results are in general agreement with other relevant studies, which all reported retarded adjustment of cell migration upon change of the gradient condition8, 32, 36–40. Our results further demonstrated that such chemotactic memory is chemoattractant gradient dependent. Fundamentally, the chemotactic memory effect suggests that the migratory response is mediated synergistically by the cell’s current and previous exposure to the chemoattractant signal. Physiologically, the stronger memory effect in a weaker chemoattractant field would allow cells to continue their chemotactic migration toward the target in the event of gradient fluctuation. This is also relevant for the extravasation stage of the cell recruitment process. By contrast, as the cells approached the target, the chemoattractant field in the source region is expected to be relatively uniform at high concentration. Therefore, it presents a strong “stopping” signal for cells, which effectively disrupt the chemotactic memory. Thus, the chemotactic memory effect is expected to contribute to the accurate control of neutrophil trafficking and positioning in tissues.
The time-dependent CI and cell speed analysis consistently reflected the time-dependent synchronized chemotaxis of the aligned cells by the decay of CI but not cell speed over time, thereby supporting the biased random walk model. In addition, it quantitatively showed the decay of chemotactic memory over time with the decrease of both CI and speed. Another new method we used in this study for the first time is the entropy analysis. The concept of entropy is well established in thermodynamics and statistical mechanics64–66 and it has been successfully applied to analyzing collective cell migration based on particle image velocimetry data (PIV)67, 68. In this study, we for the first time applied the entropy analysis to single cell migration experiment based on cell tracking data. Our results provided insightful implication that chemotaxis and chemotactic memory are associated with the level of disorder of cell migration angle. The increase of chemotactic entropy makes logical connections to the decrease of CI and the increase of migratory oscillation. Thus, the entropy analysis can be broadly useful for analyzing single cell migration data and the combined use of multiple quantitative cell migration parameter analysis can provide comprehensive interpretation of cell migration data and new biophysical insights.
Supplementary Material
Acknowledgments
This work is supported by Grants from the Natural Sciences and Engineering Research Council of Canada (NSERC) and financial assistance from CMC Microsystems. F. Lin thanks the Winnipeg Rh Institute Foundation and the University of Manitoba for a Rh Award; J.D. Wu thanks Mitacs for a postdoc fellowship. H. Peretz-Soroka thanks NSERC for a postdoc fellowship. We thank Jolly Hipolito for research support. We thank the Nano-Systems Fabrication Laboratory at the University of Manitoba for their technical support. We thank the Clinical Institute of Applied Research and Education at the Victoria General Hospital in Winnipeg for managing human blood samples. We thank Dr. Yaohui Sun for helpful research discussion on entropy analysis. We thank Professor Min Zhao’s group at the University of California, Davis, for providing HUVEC for transmigration experiments.
Footnotes
Authorship
F.L. conceptualized and designed the study; F.L., L.Z. M.Z. and Y.L. supervised the study; K.Y., J.D.W. D.X.X. and H.P-S performed the experiments; K.Y. did the experimental data analysis; G.Q.X., K.Y. and M.A. contributed to the mathematical modeling and simulation; S.S. coordinated the blood samples and the associated experiments; K.Y., J.D.W., H.P-S, M.A., Y.L. and F.L. wrote the paper.
References
- 1.Zigmond S. Curr Opin Cell Biol. 1989;1:80–86. doi: 10.1016/s0955-0674(89)80041-9. [DOI] [PubMed] [Google Scholar]
- 2.Luster AD. eLS. 2001 doi: 10.1038/npg.els.0000507. [DOI] [Google Scholar]
- 3.Song HJ, Poo MM. Nat Cell Biol. 2001;3:E81–E88. doi: 10.1038/35060164. [DOI] [PubMed] [Google Scholar]
- 4.Laird DJ, von Andrian UH, Wagers AJ. Cell. 2008;132:612–630. doi: 10.1016/j.cell.2008.01.041. [DOI] [PubMed] [Google Scholar]
- 5.Luster AD, Alon R, von Andrian UH. Nat Immunol. 2005;6:1182–1190. doi: 10.1038/ni1275. [DOI] [PubMed] [Google Scholar]
- 6.Bravo-Cordero JJ, Hodgson L, Condeelis J. Curr Opin Cell Biol. 2012;24:277–283. doi: 10.1016/j.ceb.2011.12.004. [DOI] [PMC free article] [PubMed] [Google Scholar]
- 7.Roussos ET, Condeelis JS, Patsialou A. Nat Rev Cancer. 2011;11:573–587. doi: 10.1038/nrc3078. [DOI] [PMC free article] [PubMed] [Google Scholar]
- 8.Jeon NL, Baskaran H, Dertinger SKW, Whitesides GM, Water LVD, Toner M. Nat Biotechnol. 2002;20:826–830. doi: 10.1038/nbt712. [DOI] [PubMed] [Google Scholar]
- 9.Förster R, Sozzani S. Eur J Immunol. 2013;43:1404–1406. doi: 10.1002/eji.201343670. [DOI] [PubMed] [Google Scholar]
- 10.Yamaguchi H, Wyckoff J, Condeelis J. Curr Opin Cell Biol. 2005;17:559–564. doi: 10.1016/j.ceb.2005.08.002. [DOI] [PubMed] [Google Scholar]
- 11.Kumar V, Sharma A. Int Immunopharmaco. 2010;10:1325–1334. doi: 10.1016/j.intimp.2010.08.012. [DOI] [PubMed] [Google Scholar]
- 12.Phillipson M, Kubes P. Nat Med. 2011;17:1381–1390. doi: 10.1038/nm.2514. [DOI] [PMC free article] [PubMed] [Google Scholar]
- 13.Mantovani A, Cassatella MA, Costantini C, Jaillon S. Nat Rev Immunol. 2011;11:519–531. doi: 10.1038/nri3024. [DOI] [PubMed] [Google Scholar]
- 14.Kolaczkowska E, Kubes P. Nat Rev Immunol. 2013;13:159–175. doi: 10.1038/nri3399. [DOI] [PubMed] [Google Scholar]
- 15.Zigmond SH, Sullivan SJ. J Cell Biol. 1979;82:517–527. doi: 10.1083/jcb.82.2.517. [DOI] [PMC free article] [PubMed] [Google Scholar]
- 16.Tranquillo RT, Lauffenburger DA. Cell Biophys. 1986;8:1–46. doi: 10.1007/BF02788459. [DOI] [PubMed] [Google Scholar]
- 17.Dekker LV, Segal AW. Science. 2000;287:982–985. doi: 10.1126/science.287.5455.982. [DOI] [PubMed] [Google Scholar]
- 18.Levchenko A, Iglesias PA. Biophys J. 2002;82:50–63. doi: 10.1016/S0006-3495(02)75373-3. [DOI] [PMC free article] [PubMed] [Google Scholar]
- 19.Tranquillo RT, Lauffenburger DA, Zigmond S. J Cell Biol. 1988;106:303–309. doi: 10.1083/jcb.106.2.303. [DOI] [PMC free article] [PubMed] [Google Scholar]
- 20.Fuller D, Chen W, Adler M, Groisman A, Levine H, Rappel WJ, Loomis WF. Proc Natl Acad Sci U S A. 2010;107:9656–9659. doi: 10.1073/pnas.0911178107. [DOI] [PMC free article] [PubMed] [Google Scholar]
- 21.Andrew N, Insall RH. Nat Cell Biol. 2007;9:193–200. doi: 10.1038/ncb1536. [DOI] [PubMed] [Google Scholar]
- 22.Irimia D, Balázsi G, Agrawal N, Toner M. Biophys J. 2009;96:3897–3916. doi: 10.1016/j.bpj.2008.12.3967. [DOI] [PMC free article] [PubMed] [Google Scholar]
- 23.Insall RH. Nat Rev Mol Cell Bio. 2010;11:453–458. doi: 10.1038/nrm2905. [DOI] [PubMed] [Google Scholar]
- 24.Leong P, Morgenthaler S. Computer applications in the biosciences: CABIOS. 1995;11:503–507. doi: 10.1093/bioinformatics/11.5.503. [DOI] [PubMed] [Google Scholar]
- 25.Lipowsky R, Klumpp S, Nieuwenhuizen TM. Phys Rev Lett. 2001;87:108101. doi: 10.1103/PhysRevLett.87.108101. [DOI] [PubMed] [Google Scholar]
- 26.Codling EA, Plank MJ, Benhamou S. J R Soc Interface. 2008;5:813–834. doi: 10.1098/rsif.2008.0014. [DOI] [PMC free article] [PubMed] [Google Scholar]
- 27.Alt W. J Math Biol. 1980;9:147–177. doi: 10.1007/BF00275919. [DOI] [PubMed] [Google Scholar]
- 28.Peterson SC, Noble PB. Biophys J. 1972;12:1048–1055. doi: 10.1016/S0006-3495(72)86142-3. [DOI] [PMC free article] [PubMed] [Google Scholar]
- 29.Allan R, Wilkinson P. Exp Cell Res. 1978;111:191–203. doi: 10.1016/0014-4827(78)90249-5. [DOI] [PubMed] [Google Scholar]
- 30.Zigmond SH. Nature. 1974;249:450–452. doi: 10.1038/249450a0. [DOI] [PubMed] [Google Scholar]
- 31.Wang SJ, Saadi W, Lin F, Nguyen CMC, Jeon NL. Exp Cell Res. 2004;300:180–189. doi: 10.1016/j.yexcr.2004.06.030. [DOI] [PubMed] [Google Scholar]
- 32.Irimia D, Liu SY, Tharp WG, Samadani A, Toner M, Poznansky MC. Lab Chip. 2006;6:191–198. doi: 10.1039/b511877h. [DOI] [PMC free article] [PubMed] [Google Scholar]
- 33.Halilovic I, Wu J, Alexander M, Lin F. Biomed Microdevices. 2015;17:1–7. doi: 10.1007/s10544-015-9963-8. [DOI] [PubMed] [Google Scholar]
- 34.Foxman EF, Kunkel EJ, Butcher EC. J Cell Biol. 1999;147:577–588. doi: 10.1083/jcb.147.3.577. [DOI] [PMC free article] [PubMed] [Google Scholar]
- 35.Oelz D, Schmeiser C, Soreff A. Math Med Biol. 2005;22:291–303. doi: 10.1093/imammb/dqi009. [DOI] [PubMed] [Google Scholar]
- 36.Albrecht E, Petty HR. P Natl Acad Sci. 1998;95:5039–5044. doi: 10.1073/pnas.95.9.5039. [DOI] [PMC free article] [PubMed] [Google Scholar]
- 37.Prentice-Mott HV, Meroz Y, Carlson A, Levine MA, Davidson MW, Irimia D, Charras GT, Mahadevan L, Shah JV. P Natl Acad Sci. 2016;113:1267–1272. doi: 10.1073/pnas.1513289113. [DOI] [PMC free article] [PubMed] [Google Scholar]
- 38.Huang CH, Iglesias PA. P Natl Acad Sci. 2014;111:15287–15288. doi: 10.1073/pnas.1418077111. [DOI] [PMC free article] [PubMed] [Google Scholar]
- 39.Sartori P, Granger L, Lee CF, Horowitz JM. PLoS Comput Biol. 2014;10:e1003974. doi: 10.1371/journal.pcbi.1003974. [DOI] [PMC free article] [PubMed] [Google Scholar]
- 40.Skoge M, Yue H, Erickstad M, Bae A, Levine H, Groisman A, Loomis WF, Rappel WJ. P Natl Acad Sci. 2014;111:14448–14453. doi: 10.1073/pnas.1412197111. [DOI] [PMC free article] [PubMed] [Google Scholar]
- 41.Sackmann EK, Fulton AL, Beebe DJ. Nature. 2014;507:181–189. doi: 10.1038/nature13118. [DOI] [PubMed] [Google Scholar]
- 42.Wu J, Wu X, Lin F. Lab Chip. 2013;13:2484–2499. doi: 10.1039/c3lc50415h. [DOI] [PubMed] [Google Scholar]
- 43.Ge Y, An Q, Gao Y, Chen Y, Li D. Microsyst Technol. 2015;21:1797–1804. [Google Scholar]
- 44.Irimia D, Charras G, Agrawal N, Mitchison T, Toner M. Lab Chip. 2007;7:1783–1790. doi: 10.1039/b710524j. [DOI] [PMC free article] [PubMed] [Google Scholar]
- 45.Wu J, Hillier C, Komenda P, de Faria RL, Levin D, Zhang M, Lin F. PloS One. 2015;10:e0126523. doi: 10.1371/journal.pone.0126523. [DOI] [PMC free article] [PubMed] [Google Scholar]
- 46.Wu J, Hillier C, Komenda P, de Faria RL, Santos S, Levin D, Zhang M, Lin F. TECHNOLOGY. 2016:104–109. [Google Scholar]
- 47.Boneschansker L, Yan J, Wong E, Briscoe DM, Irimia D. Nat Commun. 2014;5:4787. doi: 10.1038/ncomms5787. [DOI] [PMC free article] [PubMed] [Google Scholar]
- 48.Shamloo A, Ma N, Poo Mm, Sohn LL, Heilshorn SC. Lab chip. 2008;8:1292–1299. doi: 10.1039/b719788h. [DOI] [PubMed] [Google Scholar]
- 49.Kurihara T, Jones CN, Yu YM, Fischman AJ, Watada S, Tompkins RG, Fagan SP, Irimia D. The FASEB Journal. 2013;27:2270–2281. doi: 10.1096/fj.12-219519. [DOI] [PMC free article] [PubMed] [Google Scholar]
- 50.Dertinger SK, Chiu DT, Jeon NL, Whitesides GM. Anal Chem. 2001;73:1240–1246. [Google Scholar]
- 51.Taylor AM, Blurton-Jones M, Rhee SW, Cribbs DH, Cotman CW, Jeon NL. Nat methods. 2005;2:599–605. doi: 10.1038/nmeth777. [DOI] [PMC free article] [PubMed] [Google Scholar]
- 52.Lin F, Butcher EC. Lab Chip. 2006;6:1462–1469. doi: 10.1039/b607071j. [DOI] [PubMed] [Google Scholar]
- 53.Moghe PV, Nelson RD, Tranquillo RT. J Immunol Methods. 1995;180:193–211. doi: 10.1016/0022-1759(94)00314-m. [DOI] [PubMed] [Google Scholar]
- 54.Herzmark P, Campbell K, Wang F, Wong K, El-Samad H, Groisman A, Bourne HR. P Natl Acad Sci. 2007;104:13349–13354. doi: 10.1073/pnas.0705889104. [DOI] [PMC free article] [PubMed] [Google Scholar]
- 55.Gao Y, Sun J, Lin WH, Webb DJ, Li D. Microfluid Nanofluid. 2012;12:887–895. doi: 10.1007/s10404-011-0908-0. [DOI] [PMC free article] [PubMed] [Google Scholar]
- 56.Saadi W, Rhee SW, Lin F, Vahidi B, Chung BG, Jeon NL. Biomed Microdevices. 2007;9:627–635. doi: 10.1007/s10544-007-9051-9. [DOI] [PubMed] [Google Scholar]
- 57.Cheng SY, Heilman S, Wasserman M, Archer S, Shuler ML, Wu M. Lab Chip. 2007;7:763–769. doi: 10.1039/b618463d. [DOI] [PubMed] [Google Scholar]
- 58.Tharp WG, Yadav R, Irimia D, Upadhyaya A, Samadani A, Hurtado O, Liu SY, Munisamy S, Brainard DM, Mahon MJ, Nourshargh S, van Oudenaarden A, Toner MG, Poznansky MC. J Leukoc Biol. 2006;79:539–554. doi: 10.1189/jlb.0905516. [DOI] [PubMed] [Google Scholar]
- 59.Poznansky MC, Olszak IT, Evans RH, Wang Z, Foxall RB, Olson DP, Weibrecht K, Luster AD, Scadden DT. J Clin Invest. 2002;109:1101–1110. doi: 10.1172/JCI13853. [DOI] [PMC free article] [PubMed] [Google Scholar]
- 60.Han S, Yan JJ, Shin Y, Jeon JJ, Won J, Jeong HE, Kamm RD, Kim YJ, Chung S. Lab Chip. 2012;12:3861–3865. doi: 10.1039/c2lc40445a. [DOI] [PubMed] [Google Scholar]
- 61.Wu X, Newbold MA, Haynes CL. Analyst. 2015;140:5055–5064. doi: 10.1039/c5an00967g. [DOI] [PubMed] [Google Scholar]
- 62.Zhang Q, Liu T, Qin J. Lab Chip. 2012;12:2837–2842. doi: 10.1039/c2lc00030j. [DOI] [PubMed] [Google Scholar]
- 63.Chen YC, Allen SG, Ingram PN, Buckanovich R, Merajver SD, Yoon E. Sci Rep. 2015;5:9980. doi: 10.1038/srep09980. [DOI] [PMC free article] [PubMed] [Google Scholar]
- 64.Bejan A. J Appl Phys. 1996;79:1191–1218. [Google Scholar]
- 65.Jaynes ET. Phys Rev. 1957;106:620. [Google Scholar]
- 66.Solodukhin SN. Phys Rev D. 1996;54:3900. doi: 10.1103/physrevd.54.3900. [DOI] [PubMed] [Google Scholar]
- 67.Lee RM, Kelley DH, Nordstrom KN, Ouellette NT, Losert W. New J Phys. 2013;15:025036. doi: 10.1088/1367-2630/15/2/025036. [DOI] [PMC free article] [PubMed] [Google Scholar]
- 68.Deforet M, Parrini MC, Petitjean L, Biondini M, Buguin A, Camonis J, Silberzan P. Nat Methods. 2012;9:1081–1083. doi: 10.1038/nmeth.2209. [DOI] [PubMed] [Google Scholar]
Associated Data
This section collects any data citations, data availability statements, or supplementary materials included in this article.


