

Abstract
Background
We investigated whether an immune system environment characterized by elevated serum levels of B-cell activation molecules was associated with the subsequent development of classical Hodgkin lymphoma (cHL).
Methods
We measured serum levels of B-cell-stimulatory cytokines, interleukin (IL)-6 and IL-10, soluble CD30 (sCD30) and total IgE prior to cHL diagnosis in 103 cases and 206 matched controls with archived specimens in the DoD Serum Repository.
Results
Pre-diagnosis serum sCD30 and IL-6 levels had strong positive associations with risk of a cHL diagnosis >0-1 year prior to diagnosis (sCD30 odds ratio [OR] =5.5, 95% confidence interval [CI] = 3.4–9.0; IL-6 OR = 4.6, 95% CI = 2.9–7.5) and >1 year to 2 years pre-cHL diagnosis (sCD30 OR =3.3, 95% CI = 1.6–6.7; IL-6 OR = 2.9, 95% CI = 1.3–6.5). We observed similar, albeit not consistently significant positive associations, over four or more years preceding diagnosis. We did not observe a clear association with IgE levels. Of note, detectable IL-10 levels were significantly associated with Epstein-Barr virus (EBV)-positive cHL cases compared with EBV-negative cases.
Conclusion
In this prospective analysis, elevated sCD30 and IL-6 levels and detectable IL-10 preceded cHL diagnosis.
Impact
The associations of these cytokines with cHL risk may reflect the production of these molecules by proliferating nascent cHL tumor cells, or by immune cells responding to their presence, prior to clinical detection. The stable elevation in cHL risk, four or more years pre-diagnosis, also suggests that a B-cell-stimulatory immune system milieu precedes, and may promote, lymphomagenesis.
Keywords: Hodgkin lymphoma, epidemiology, cytokines, biomarkers
Introduction
Classical Hodgkin lymphoma (cHL) tumors are characterized by the presence of Hodgkin and Reed-Sternberg (HRS) cells and a proportionately larger number of reactive inflammatory cells and lymphocytes. HRS cells contain immunoglobulin (Ig) gene rearrangements that suggest that they derive from germinal center (GC) B cells (1, 2). The pathogenesis of HL has not been fully defined, nor has a characteristic genomic defect specific to the malignant HRS cell been identified (3, 4). Primary HRS cells, HL-derived cell lines and cells in the surrounding reactive infiltrate produce numerous cytokines and chemokines (5, 6), and pre-treatment serum levels of these molecules have been evaluated as prognostic biomarkers (7–11).
The B-cell origin of HRS cells and the known role of cytokines in cHL pathobiology suggest that immune system molecules associated with B-cell activation also contribute to the etiology of cHL. For example, HRS cells characteristically express CD30, a member of the TNF receptor superfamily, and staining for CD30 is performed to confirm the diagnosis of HL (12, 13). CD30 cleaved from the surface of activated lymphocytes and CD30-positive neoplastic cells can circulate in peripheral blood as soluble (s)CD30 (14). Transcripts of the cytokine IL-6, which stimulates B-cell growth, differentiation and viability (15), have been detected in primary HL tumors (16). Of interest, Cozen and colleagues (17) assessed IL-6 production by peripheral blood mononuclear cells (PBMC) and IL-6 genotype and reported that individuals with the genetic propensity to more readily produce IL-6 had an increased risk of cHL. Another B-cell-stimulatory cytokine, IL-10, is produced not only by T regulatory cells, macrophages and other immune system cells (18) but also by HRS cells. In addition, activated B cells that have undergone Ig class switching after stimulation by B-cell-stimulatory cytokines produce immunoglobulin E (IgE) (19). In serologic studies using samples obtained at or after diagnosis, but before initiation of treatment, cHL cases have often had elevated levels of sCD30 (20–22), IL-6 (23–28), IL-10 (28–30), and IgE (31, 32) compared with controls; however, the observed elevated levels may reflect existing disease.
In this investigation, we hypothesized that an immune system environment characterized by elevated levels of B-cell activation molecules would be associated with the subsequent development of cHL. To our knowledge, no studies have examined serum levels of sCD30, IL-6, IL-10, and IgE preceding the clinical diagnosis of HL. The Department of Defense (DoD) Serum Repository, with serum samples archived for the active -duty population, provided an unique opportunity to conduct a prospective study. We therefore measured serum levels of sCD30, IL-6, IL-10, and total IgE in serial serum samples collected over several years prior to cHL diagnosis among a young adult, ethnically diverse U.S. military population. We also examined immune marker levels classified by the presence or absence of Epstein-Barr virus (EBV) in HRS tumor cells of cHL cases.
Materials and Methods
Study population
We performed the study among active-duty military personnel with an archived serum specimen in the DoD Serum Repository. Eligible cases included all new diagnoses of HL (ICD-9 201) identified from January 1, 1990 through December 31, 1999, with a pre-diagnosis serum specimen archived in the repository and with no history of HIV infection or a malignancy other than non-melanoma skin cancer at time of HL diagnosis. We initially identified cases by searching military computerized databases and retrieved tissue blocks from military hospitals and the Armed Forces Institute of Pathology (AFIP). All identified diagnoses of HL received pathology review of archived tumor tissue to determine histologic subtype and to assess the presence of EBV genome fragments in HRS cells. Determination of eligible cases with retrieved tissue blocks has been previously described (33). Among a total of 148 HL cases with tissue blocks available for this analysis, study pathologists confirmed the diagnoses of 139 cases. Of these cases, 125 cases also had retrievable archived pre-diagnosis serum samples in the DoD Serum Repository and 113 cases were available for biomarker studies. To restrict the analysis to cases of cHL, we excluded ten individuals with the lymphocyte predominant histologic subtype. We individually matched two controls to each case on age (± 1 year), sex, race and ethnicity, number of serum samples, and serum draw date for each sample (± 30 day) among active-duty service members in the DoD Serum Repository population with no history of HIV infection or a malignancy other than non-melanoma skin cancer as of the index case diagnosis date. We also selected controls that were on active duty as of the index case diagnosis date. The final study population comprised 103 cases of cHL and 206 controls.
Serum and data collection
The DoD Serum Repository, managed by the Armed Forces Health Surveillance Branch (AFHSB), contains over 50 million serum specimens from active duty and reserve personnel, with more than 2 million new samples added yearly (34). The specimens are stored at −30°C. The Defense Medical Surveillance System (DMSS), also managed by the AFHSB, contains data from several military databases such as inpatient hospital discharges and outpatient visits to military outsourced facilities on all active-duty military personnel (35). DMSS capabilities include linking individuals identified from various demographic and medical databases to serum specimens archived in the DoD Serum Repository.
The research protocol for this study was approved by the institutional review boards of the Walter Reed Army Institute of Research and several military medical treatment facilities, David Geffen School of Medicine at UCLA, Harvard T.H. Chan School of Public Health and Johns Hopkins School of Medicine.
Determination of immune activation biomarkers
Laboratory personnel blinded to samples’ case-control status determined serum levels of immune markers by enzyme-linked immunosorbent assays (ELISA). Assays for sCD30 (Bender MedSystems, detection limit = 6 units/ml), IL-6 (Biosource/Invitrogen, detection limit = 0.2 pg/ml), IL-10 (Biosource/Invitrogen, detection limit = 2 pg/ml), and total serum IgE (detection limit = 8 ng/ml) were performed as previously described (36). IL-10 was measured using a human IL-10-specific assay (Biosource/Invitrogen, detection limit = 2 pg/ml), that does not cross react with the EBV IL-10 orthologue (37).
We randomly ordered case and control samples within matched sets and tested all samples of a given set on the same ELISA plate. We interspersed blinded quality control aliquots of pooled sera from the control population on each assay plate and observed good to excellent inter-assay coefficients of variation of sCD30 (13.0%), IL-6 (10.8%), and IgE (5.4%). All quality control specimens had serum IL-10 levels below the detection limit of the assay. We did not observe any statistically significant difference in serum biomarker levels by duration of specimen storage.
In situ hybridization/staining for Epstein-Barr viral markers
We utilized in situ hybridization to detect the EBV-encoded RNAs (EBERs) expressed in latent infection as previously described (38, 39) and performed immunohistochemistry to detect the presence of the viral latent membrane protein-1 (LMP-1) in HRS cells as described by Pallesen and colleagues (40). We considered cHL cases EBV-positive if the tumor tissue scored positive for either EBERs or LMP-1. We considered cases EBV-negative if the tissue scored negative on both assays, or we had information from only one assay and that result was negative (41).
Statistical analysis
Initially we divided the biomarker data from all serum samples into 5 follow-up time windows based on the interval from serum collection to the case diagnosis or control reference date: >4 years pre-cHL, >3 to ≤4 years pre-cHL, >2 years to ≤3 years pre-cHL, >1 to ≤2 years pre-cHL, and >0 to 12 months pre-cHL (Figure 1). In each window, we compared median serum sCD30, IL-6, and IgE levels between cases and controls and evaluated the statistical significance of the differences with the Wilcoxon signed-rank test. Ten cases and their 20 matched controls had two or more specimens in the >4 years pre-cHL window. For these individuals, we included the mean value from results of multiple specimens collected in one time window. We treated samples with biomarker levels below the limit of detection as zero values except with regard to IL-10 levels. Because a large number of samples had undetectable IL-10, we dichotomized serum IL-10 levels as detectable versus undetectable in a given time window and utilized Fisher’s exact test to assess the significance of differences in detectable IL-10 between cases and controls.
Figure 1. Distribution of serum samples from 103 classical Hodgkin lymphoma cases and 206 controls across five time windows preceding cHL diagnosis.
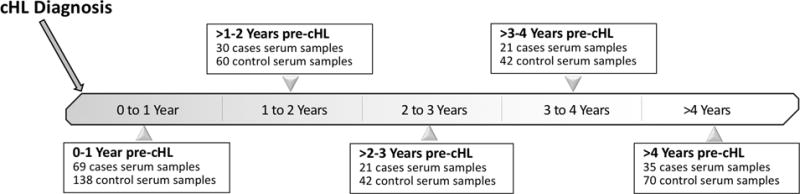
Numbers shown are the number of cHL cases with at least one sample within that time window; for every case at each time point, controls were matched 2:1 based on serum collection dates.
In analyses that included longitudinal measurements from study subjects, we used generalized estimating equations (GEE) (42) to assess the association between the serologic biomarkers and the subsequent development of cHL. In these models, we adjusted for the dependency among measurements from the same individual. We dichotomized serum levels of sCD30, IL-6, and total IgE according to the median levels in the controls and calculated the odds ratio (OR) and 95% confidence interval (95% CI) for cHL in persons with above-median (v. ≤ median) levels. We divided the time period from sample collection to diagnosis into one-year intervals with inclusion of either single or multiple specimens from individuals and adjusted the models for the matching factors. We also examined risk of cHL by tumor EBV status, first in comparisons of EBV-positive or EBV-negative cases with their respective matched controls, and subsequently in case-case comparisons (EBV-positive cases compared with EBV-negative cases). To conduct the tumor EBV-associated analyses, we modeled serum sCD30, IL-6 and total IgE levels as continuous variables and estimated an OR per unit increase in the immune marker on the natural log scale; we also estimated an OR for detectable versus undetectable IL-10. The smaller numbers of cases and controls in the latter models required that we collapse time to diagnosis into two windows (≤1 year and >1 year from blood collection to cHL diagnosis).
To determine within-person change in serum levels over time for cases and matched controls with multiple serum samples, we estimated the change per year in a given individual’s biomarker levels beginning with the earliest specimen collected and ending with the specimen collected closest to diagnosis. We then compared the median change per year in cases to the median annual change in controls using the Wilcoxon signed-rank test. We conducted the statistical analyses with SAS (version 9.3; SAS Institute.) All statistical tests assumed two-sided P values and an alpha error of 0.05.
Results
The matched design resulted in demographically similar cases and controls (Table 1). Briefly, both groups had a median age at diagnosis of the case or reference date in the controls of approximately 25 years and a predominance of men and white participants. The case follow-up interval from the earliest serum collection to cHL diagnosis (or the control’s reference date) had a median interval of 2.8 years. Approximately 62% of the study population contributed serial pre-cHL diagnosis serum samples to the analysis (Table 1). The 103 cases comprised nodular sclerosing (n=67), mixed cellularity (n=13) and cHL not further classified (n=23) histologic types, and 23 (22.3%) had EBV-positive tumors (Table 1).
Table 1.
Demographic characteristics of classical Hodgkin lymphoma cases and matched controls
| Characteristics | Case (n=103) N (%) |
Control (n=206) N (%) |
|
|---|---|---|---|
| Age (y)a | |||
| 18 – 23 | 41 (39.8%) | 79 (38.4%) | |
| 24 – 30 | 30 (29.1%) | 63 (30.6%) | |
| > 30 | 32 (31.1%) | 64 (31.1%) | |
| Age (y), median (IQR) | 25.9 (21.9–31.4) | 25.5 (22.0–31.1) | |
| Sexa | |||
| Male | 93 (90.3%) | 186 (90.3%) | |
| Female | 10 (9.7%) | 20 (9.7%) | |
| Race-ethnicitya | |||
| White, non Hispanic | 77 (74.8%) | 153 (74.3%) | |
| Black, non Hispanic | 12 (11.7%) | 24 (11.7%) | |
| Hispanic | 11 (10.7%) | 22 (10.7%) | |
| Other/Unknown | 3 (2.9%) | 7 (3.4%) | |
| Year of earliest serum collectiona | |||
| 1988 – 1991 | 51 (49.5%) | 102 (49.5%) | |
| 1992 – 1994 | 22 (21.4%) | 45 (21.8%) | |
| 1995 – 1999 | 30 (29.1%) | 59 (28.6%) | |
| Years from earliest blood collection to diagnosis, median (IQR) | 2.8 (1.4–4.9) | 2.8 (1.2–4.9) | |
| Number of serum samplesa | |||
| 1 | 39 (37.9%) | 78 (37.9%) | |
| 2 | 55 (53.4%) | 110 (53.4%) | |
| 4 | 6 (5.8%) | 12 (5.8%) | |
| 5 | 3 (2.9) | 6 (2.9%) | |
| Histiologic subtype | |||
| Nodular sclerosis | 67 (65.1%) | ||
| Mixed cellularity | 13 (12.6%) | ||
| Classical HL, not further classified | 23 (22.3%) | ||
| Tumor Epstein-Barr virus (EBV) status | |||
| EBV negative | 76 (76.7%) | ||
| EBV positive | 23 (23.2%) | ||
| EBV indeterminate | 4 (3.9%) | ||
Abbreviation: Interquartile range (IQR)
Controls were matched to cases on age at diagnosis of case, sex, race-ethnicity, serum collection date, and number of serum samples.
In the analysis divided into five time windows from blood collection to cHL diagnosis, we observed striking differences by case-control status for sCD30 (Figure 2A). Cases had the highest median serum sCD30 level of 106 units/ml in the window closest to diagnosis and successively lower median levels in each earlier pre-diagnosis window, except for a slight increase in the window >4 years from diagnosis, with a median level of 45 units/ml. In contrast, sCD30 concentrations in controls remained relatively stable across all of the time windows, with median levels ranging from 39 to 44 units/ml. When comparing case and control median levels within follow-up time intervals, cases had significantly higher median sCD30 concentrations than controls in the >0 to 12 months window (106 units/ml [interquartile range (IQR), 69.5–213.5] versus 44 units/ml [IQR, 37–52]; p<0.0001). The case-control differences diminished with increasing time preceding cHL diagnosis and were not statistically significant in intervals more than 1 year prior to diagnosis (Figure 2A).
Figure 2. Pre-cHL serum levels of sCD30, IL-6, and IgE in five time windows by case-control status.
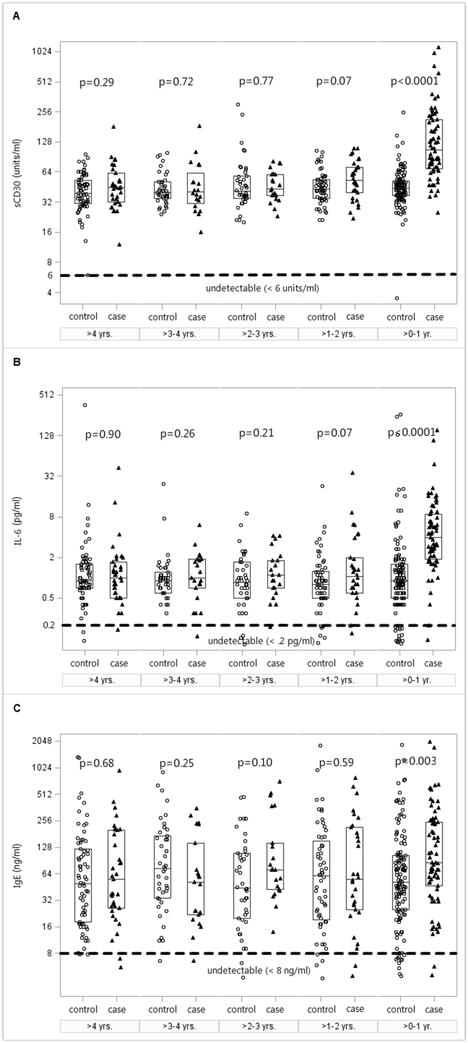
Serum samples from cases (triangles) and matched controls (circles) were analyzed in five designated time windows as shown in Figure 1. Serum levels of (A) sCD30, (B) IL-6, and (C) IgE are plotted on the Y axis with log base 2 scale; the lower limit of detection for each analyte is indicated by a horizontal dotted line parallel to the X axis. Box plots display the median and interquartile range (IQR). P values comparing median values of cases and controls in each time window are computed using Wilcoxon signed-rank test.
Serum IL-6 levels showed similar pre-cHL temporal patterns to those noted for sCD30. For example, among cases, median IL-6 concentrations ranged from 4.3 pg/ml in the window closest to diagnosis to 1.1 pg/ml in the window furthest from diagnosis (Figure 2B). Control median levels remained stable, ranging from 0.8 to 0.9 pg/ml across the five time windows. As with sCD30, cases had significantly higher median IL-6 concentrations than controls in the >0 to 12 months window (4.3 pg/ml [IQR, 2–8.9] versus 0.9 pg/ml [IQR, 0.6–1.6]; p<0.0001).
In comparison to sCD30 and IL-6, we observed more variability in the concentrations of total IgE in both cases and controls (Figure 2C). Median case and control IgE levels differed significantly in the >0 to 12 months window prior to diagnosis (85.5 ng/ml [IQR, 48.5–254] versus 52.5 ng/ml [IQR, 26–103.5]; p = 0.003).
Cases had a significantly higher prevalence of detectable IL-10 levels among samples collected in the follow-up interval closest to cHL diagnosis. Specifically, in samples collected >0 to 12 months pre-cHL, 14.5% of cases and 2.2 % of the controls had serum IL-10 values above the limit of detection (P= 0.001).
In analyses that included serial measurements from the same individual, we observed significant positive associations of serum levels of both sCD30 (OR = 5.5, 95% CI = 3.4–9.0) and IL-6 (OR = 4.6, 95% CI = 2.9–7.5) with cHL risk in the follow-up interval within 1 year prior to diagnosis (Figure 3A and Figure 3B) and in the >1–2 years prior to diagnosis (sCD30 OR =3.3, 95% CI = 1.6–6.7 and IL-6 OR = 2.9, 95% CI = 1.3–6.5). Of note, sCD30 and IL-6 had similarly strong positive associations with cHL risk, although not consistently statistically significant, across the four-year period prior to diagnosis. Serum IgE levels had a significant positive association with risk of cHL in the interval within 1 year before diagnosis (OR = 1.9, 95% CI = 1.1–3.2) but had no association with cHL risk in intervals more than one year before diagnosis (Figure 3C).
Figure 3. Odds ratios (OR) and 95% confidence intervals (CI) for the association of cHL with elevated serum levels of sCD30, IL-6, and IgE prior to diagnosis.
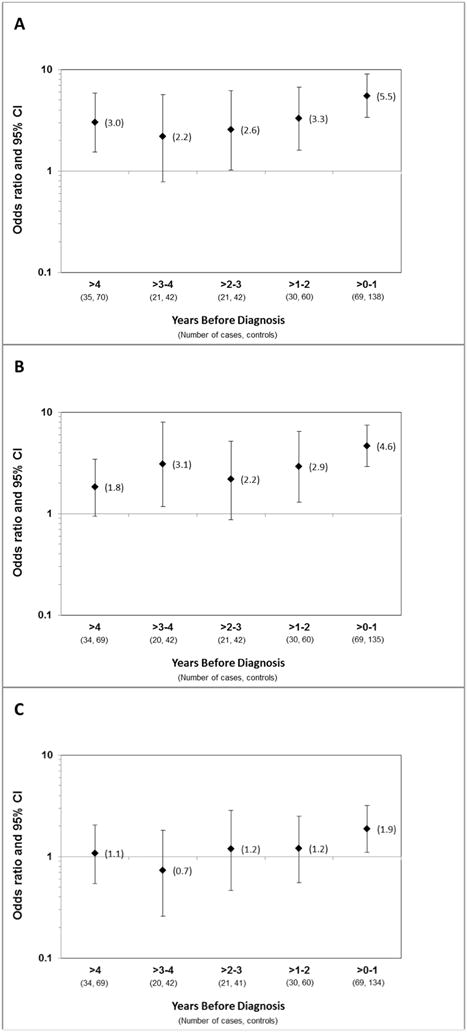
Elevated levels of (A) sCD30, (B) IL-6, and (C) IgE were defined as falling above the median levels among controls. OR (diamonds) and 95% CI (whiskers) were calculated by GEE analysis, modeling time before diagnosis in one-year increments and adjusted for age, race-ethnicity, sex, and serum draw date.
In models that examined the association of serum biomarker levels with cHL risk among cases and matched controls by tumor EBV status, we observed a statistically significant positive association of sCD30 levels with both EBV-positive (OR = 2.0, 95% CI = 1.1–4.1) and EBV-negative cHL risk (OR = 3.2, 95% CI = 2.1–4.9) in the period ≤1 year pre-diagnosis (Table 2). We also noted similarly strong significant associations of sCD30 levels with both EBV-positive (OR =2.0, 95% CI = 1.1–4.1) and EBV-negative cHL risk (OR = 3.4, 95% CI = 2.2–5.5) during the period >1 year pre-cHL. Serum IL-6 levels had a strong positive association with EBV-positive cHL risk (OR = 6.5, 95% CI = 2.5–26.7) and a weaker but nonetheless statistically significant positive association with EBV-negative cHL risk during the period ≤1 year prior to diagnosis (OR = 1.6, 95% CI = 2.1–4.9). Serum IL-6 levels had only a borderline association with risk of EBV-positive cHL and had no association with risk of EBV-negative cHL in the time window >1 year prior to diagnosis. We did not see evidence of an association of serum IgE levels or frequency of detectable IL-10 with EBV-positive or EBV-negative cHL cases compared with their respective matched controls prior to diagnosis. In case-case analyses comparing EBV-positive cases with EBV-negative cases, we did not observe associations of sCD30, IL-6 or IgE levels with tumor EBV positivity in the pre-diagnosis time intervals. In contrast, we noted statistically significant positive associations of detectable IL-10 levels with EBV-positive cHL during the period ≤1 year prior to diagnosis (OR = 3.1, 95% CI = 1.7–6.1) as well as >1 year prior to diagnosis (OR = 2.2, 95% CI = 1.3–4.0).
Table 2.
The association between immune activation marker levels and classical Hodgkin lymphoma by EBV statusa
| ≤1 Year Prior to Diagnosis | ||||||
|---|---|---|---|---|---|---|
|
| ||||||
| EBV+ Cases
|
EBV- Cases
|
EBV+ vs. EBV- Cases
|
||||
| Markerb | Case/Control | OR (95% CI)c | Case/Control | OR (95% CI) | EBV+/EBV- | OR (95% CI) |
| sCD30 | 12/24 | 2.03 (1.10–4.05) | 53/106 | 3.15 (2.09–4.92) | 12/53 | 0.95 (0.67–1.46) |
| IL6 | 12/23 | 6.48 (2.45–26.67) | 53/104 | 1.90 (1.47–2.54) | 12/53 | 0.96 (0.66–1.35) |
| IgE | 12/24 | 1.06 (0.83–1.38) | 52/104 | 1.16 (1.02–1.34) | 12/52 | 0.93 (0.75–1.17) |
| IL10 | 12/24 | 1.55 (0.93–2.63) | 53/106 | 1.06 (0.61–1.74) | 12/53 | 3.10 (1.73–6.05) |
| > 1 Year Prior to Diagnosis | ||||||
|---|---|---|---|---|---|---|
|
| ||||||
| EBV+ Cases
|
EBV- Cases
|
EBV+ vs. EBV- Cases
|
||||
| Marker | Case/Control | OR (95% CI) | Case/Control | OR (95% CI) | EBV+/EBV- | OR (95% CI) |
| sCD30 | 18/36 | 2.00 (1.07–4.14) | 58/116 | 3.41 (2.18–5.52) | 18/58 | 1.06 (0.70–1.77) |
| IL6 | 17/36 | 1.60 (1.03–2.63) | 58/116 | 1.06 (0.82–1.37) | 17/58 | 1.14 (0.78–1.68) |
| IgE | 18/36 | 0.97 (0.76–1.23) | 58/115 | 1.15 (1.02–1.32) | 18/58 | 1.02 (0.83–1.27) |
| IL10 | 18/36 | 1.24 (0.81–1.89) | 58/116 | 1.02 (0.59–1.67) | 18/58 | 2.16 (1.28–3.97) |
Adjusted for the matching factors (age, sex, race-ethnicity, serum collection date, and number of serum samples.
Analyses of continuous levels of sCD30, IL6, IgE and detectable IL10.
OR for association with one unit increase in the immune marker on the natural log scale, or as detectable versus undetectable for IL-10.
Among the 64 case-control sets with sequential pre-cHL diagnosis serum samples, we observed significantly greater changes in serum sCD30 and IL-6 levels in cases than in controls (P =0.01 and P <0.001, respectively) as cHL diagnosis approached (Figure 4A and Figure 4B). Neither IgE levels (Figure 4C) nor the frequency of detectable IL-10 had clear temporal changes.
Figure 4. Within-person change per year in serum levels of sCD30, IL-6, and IgE by case-control status.
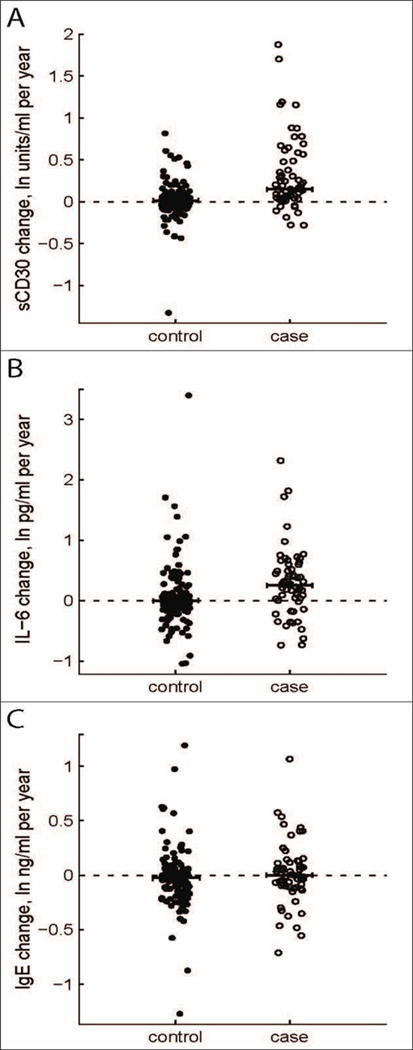
Change per year in serum levels of (A) sCD30, (B) IL-6, or (C) IgE was calculated using natural log-transformed biomarker levels for the time period ranging from the earliest available sample to the sample closest to but preceding cHL diagnosis. Cases (n=64) are shown as open circles, matched controls (n=128) as filled circles; the dotted horizontal line at zero indicates no change in serum level over time.
Discussion
We report the first study, to our knowledge, to measure circulating levels of sCD30, IL-6, IL-10 and IgE levels in blood specimens collected prior to cHL diagnosis. We observed significantly higher median serum levels of sCD30, IL-6 and increased detection of IL-10 up to one year preceding cHL diagnosis in cases compared with controls. Moreover, individuals with elevated levels of sCD30 and IL-6 in blood samples drawn during the period closest to diagnosis had an approximately five-fold higher risk of developing cHL than those with below-median levels during that time period; further, the association was also borderline or statistically significant beyond a four-year window prior to diagnosis, the most distant pre-diagnosis period for which adequate numbers of samples permitted a robust analysis. Additionally, among individuals with multiple samples, serum levels of sCD30 and IL-6 increased as the time of cHL diagnosis approached. Elevated serum IgE levels were associated with cHL risk only in the period closest to diagnosis. Collectively, these results reveal a seemingly progressive elevation of serum levels of sCD30, IL-6, and possibly IL-10, as the clinical diagnosis of cHL approaches.
CD30 is a member of the TNF receptor superfamily and the receptor for CD30 ligand (CD153), a TNF-like immune stimulatory molecule. CD30 is also expressed on HRS cells (12, 13), where it has the potential to serve as a receptor for stimulatory signals delivered to HRS cells that may enhance their proliferation. For example, CD30-mediated signaling can stimulate the NF-kappa B pathway in HRS cells (43). Elevated sCD30 serum levels are routinely found in pretreatment patients diagnosed with HL (20–22). The results presented here indicate that sCD30 levels rise several years preceding diagnosis in persons who ultimately develop cHL. Moreover, an association with higher sCD30 levels persisted in both EBV-positive cHL and EBV-negative cHL cases when compared to controls, suggesting that elevated circulating sCD30 levels may be a factor common to both subtypes. A previous study of 30 EBV-positive and 62 EBV-negative cases of pretreatment HL reported marginally lower sCD30 levels in EBV-positive HL (44), while in our case-case comparison of pre-diagnosis sCD30 levels, we did not observe any association with EBV-positivity. Elevated serum levels of sCD30 have also been reported to precede the diagnosis of other forms of lymphoma, including AIDS-associated B-cell non-Hodgkin lymphoma (NHL) (45) and B-cell NHL in immunocompetent subjects (46, 47), neither of which typically express CD30.
IL-6 is a pluripotent cytokine with B-cell-stimulatory properties, and can promote B-cell differentiation and survival (15). IL-6 is associated with proinflammatory responses and with Th17 responses, which are associated with autoimmunity and inflammation (48). Primary HL tissue specimens express IL-6 (16), the question of whether IL-6 expression differs in EBV-positive compared with EBV-negative tumors remains unresolved (49–51). Several studies have reported higher serum IL-6 levels in pretreatment HL cases compared with controls (10, 23, 25–27). The findings of this study suggest that elevated IL-6 levels significantly predict future risk of both EBV-positive and EBV-negative cHL. Of note, in a study by Biggar and colleagues (52), pretreatment HL cases had elevated levels of serum IL-6 and of YKL-40, a nonspecific marker of inflammation, compared with controls regardless of tumor EBV positivity. In studies of IL-6 production and/or IL-6 genotype in HL, higher production of IL-6 and a high secreting IL-6 genotype were noted more commonly in unaffected co-identical twins of HL cases (who were studied as genetic surrogates for the co-twins with cHL) than in co-twins of non-cases (17), while a low secreting IL-6 genotype was associated with a decreased risk of young adult HL (53). This suggests that a greater propensity to produce IL-6 is associated with increased risk for HL. Those findings are consistent with our observation of a positive association of IL-6 levels with cHL at least up to 4 years preceding diagnosis.
IgE is synthesized and secreted by B cells that have undergone Ig class switching after stimulation by B-cell-stimulatory cytokines, IL-4 and IL-13 (19). Additionally, HRS cells can express IgE (54). Results from case-control studies of pre-existing atopic conditions, which are mediated by IgE, and cHL include some reporting no association (32, 55, 56) and others suggesting an inverse association (57, 58). A recent large, population-based case-control study conducted in Denmark and Sweden reported no association of self-reported history of atopic conditions with cHL risk regardless of tumor EBV status (59). In two early studies involving only pretreatment serology, total serum IgE levels were more frequently elevated in cases than controls (31, 32), whereas a third study reported a nonsignificant inverse association of HL risk with total serum IgE (60). Based on the activated B-cell origin of IgE, we hypothesized a positive association of pre-diagnosis total serum IgE with cHL. However, except for the weak borderline positive association we noted in the time period closest to diagnosis, we did not observe any association with cHL, overall or by tumor EBV status.
IL-10 is a B-cell-stimulatory cytokine that also can suppress T-cell and monocyte responses, including anti-viral cell-mediated responses (18). Furthermore, IL-10 can enhance BCL2 expression, thereby promoting B-cell viability (61). IL-10-expressing HRS cells are consistently associated with tumor EBV positivity (50, 62–64). Of interest, increased detection of serum IL-10 was the only biomarker with an association restricted to EBV-positive HL in our study population. It is important to note that the immunoassay utilized in this study was documented not to cross-react with a viral orthologue of IL-10 that is encoded by the EBV genome (vIL-10), which has a very high amino acid sequence homology with human IL-10 (18, 37). Therefore, even though detectable serum levels of IL-10 were associated with HL cases with EBV-positive tumors, we can be confident that this IL-10 is a product of a human host immune response, and is not EBV vIL-10. In a study of 41 EBV-positive versus 189 EBV-negative cases at pretreatment, Herling and colleagues (65) reported significantly higher IL-10 levels in the EBV-positive HL patients, while two smaller studies, one based on 22 EBV-positive and 51 EBV-negative cases and the other on only 5 positive and 18 negative cases, reported nonsignificant associations of IL-10 with EBV positivity (10, 66). Genetic polymorphisms in the promoter region of IL10 gene may influence the risk of HL (67–69), possibly by modulating serum IL-10 levels (66).
This study has several important strengths, including the availability of serum samples collected over several years before the onset of cHL, which allowed the prospective assessment of circulating serum immune marker levels and risk of cHL. We also were able to control for potential confounding by matching on known demographic risk factors for HL. A limitation, however, was that time points more than four years preceding cHL diagnosis could not be adequately evaluated, as there were insufficient numbers of specimens available for study. Further, the small number of EBV-positive cases and the small numbers of cases of histologic types other than nodular sclerosing cHL also limited our statistical power for robust analyses within strata defined by tumor EBV status or histologic type.
The prospective design of this study improves on evidence from previous investigations of cytokine levels in HL cases compared with controls, which utilized post-diagnosis samples and thus could not assess the pre-diagnosis immune system milieu. Our findings indicate that an elevation of molecules associated with immune system activation and B-cell stimulation, including sCD30 and IL-6, precedes the diagnosis of cHL in presumably immunocompetent individuals. Given that the serum levels of these molecules increased progressively as the time of cHL diagnosis approached, the markedly elevated levels seen closer to the time of diagnosis probably reflect the presence of the nascent tumor and potentially the production of the biomarker molecules by HRS cells and/or by reactive inflammatory cells and/or lymphocytes in the tumor infiltrate. The stable elevation in cHL risk with elevated levels of sCD30 and IL-6 across four or more years prior to diagnosis may also reflect a B-cell-stimulatory environment that promotes the genesis of these cancers.
Acknowledgments
We would like to sincerely thank staff of the Armed Forces Health Surveillance Branch for the identification of matched controls and retrieval of serum samples from the DoD Serum Repository. We also want to thank Drs. Risa B. Mann, Michael Borowitz, and Edward G. Weir for pathology review of tissue blocks, Brenda Kaminski and Ruth Cho for research assistance support, and Dr. Chung-Cheng Hsieh for guidance with the statistical analysis.
Data from the Defense Medical Surveillance System, The Armed Forces Health Surveillance Branch, Defense Health Agency, U.S. Department of Defense, Silver Spring, Maryland were obtained for study subjects from 1990 to 1999. Serum specimens from the Department of Defense Serum Repository, The Armed Forces Health Surveillance Branch, Defense Health Agency, U.S. Department of Defense, Silver Spring, Maryland were retrieved from study subjects from 1988 to 1999.
Grant Support
This work was supported by grants from the NIH to [N. Mueller (P01 CA-069266), O. Martinez-Maza (R01-CA-121195), B. Birmann R01 (CA-149445), and R. Ambinder (R21 CA-188824)].
Footnotes
The views expressed are those of the authors and should not be construed to represent the positions of the Department of the Army or Department of Defense.
References
- 1.Kanzler H, Kuppers R, Hansmann ML, Rajewsky K. Hodgkin and Reed-Sternberg cells in Hodgkin’s disease represent the outgrowth of a dominant tumor clone derived from (crippled) germinal center B cells. J Exp Med. 1996;184:1495–505. doi: 10.1084/jem.184.4.1495. [DOI] [PMC free article] [PubMed] [Google Scholar]
- 2.Kuppers R, Rajewsky K, Zhao M, Simons G, Laumann R, Fischer R, et al. Hodgkin disease: Hodgkin and Reed-Sternberg cells picked from histological sections show clonal immunoglobulin gene rearrangements and appear to be derived from B cells at various stages of development. Proc Natl Acad Sci USA. 1994;91:10962–6. doi: 10.1073/pnas.91.23.10962. [DOI] [PMC free article] [PubMed] [Google Scholar]
- 3.Janz M, Mathas S. The pathogenesis of classical Hodgkin’s lymphoma: what can we learn from analyses of genomic alterations in Hodgkin and Reed-Sternberg cells? Haematologica. 2008;93:1292–5. doi: 10.3324/haematol.13614. [DOI] [PubMed] [Google Scholar]
- 4.Mani H, Jaffe ES. Hodgkin lymphoma: an update on its biology with new insights into classification. Clin Lymphoma Myeloma. 2009;9:206–16. doi: 10.3816/CLM.2009.n.042. [DOI] [PMC free article] [PubMed] [Google Scholar]
- 5.Poppema S, van den Berg A. Interaction between host T cells and Reed-Sternberg cells in Hodgkin lymphomas. Semin Cancer Biol. 2000;10:345–50. doi: 10.1006/scbi.2000.0327. [DOI] [PubMed] [Google Scholar]
- 6.Skinnider BF, Mak TW. The role of cytokines in classical Hodgkin lymphoma. Blood. 2002;99:4283–97. doi: 10.1182/blood-2002-01-0099. [DOI] [PubMed] [Google Scholar]
- 7.Amlot PL, Slaney J, Brown R. Atopy–a favourable prognostic factor for survival in Hodgkin’s disease. Br J Cancer. 1983;48:209–15. doi: 10.1038/bjc.1983.176. [DOI] [PMC free article] [PubMed] [Google Scholar]
- 8.Viviani S, Notti P, Bonfante V, Verderio P, Valagussa P, Bonadonna G. Elevated pretreatment serum levels of Il-10 are associated with a poor prognosis in Hodgkin’s disease, the Milan Cancer Institute experience. Med Oncol. 2000;17:59–63. doi: 10.1007/BF02826218. [DOI] [PubMed] [Google Scholar]
- 9.Visco C, Nadali G, Vassilakopoulos TP, Bonfante V, Viviani S, Gianni AM, et al. Very high levels of soluble CD30 recognize the patients with classical Hodgkin’s lymphoma retaining a very poor prognosis. Eur J Haematol. 2006;77:387–94. doi: 10.1111/j.1600-0609.2006.00725.x. [DOI] [PubMed] [Google Scholar]
- 10.Gaiolla RD, Domingues MA, Niero-Melo L, de Oliveira DE. Serum levels of interleukins 6, 10, and 13 before and after treatment of classic Hodgkin lymphoma. Arch Pathol Lab Med. 2011;135:483–9. doi: 10.5858/2010-0060-OA.1. [DOI] [PubMed] [Google Scholar]
- 11.Marri PR, Hodge LS, Maurer MJ, Ziesmer SC, Slager SL, Habermann TM, et al. Prognostic significance of pretreatment serum cytokines in classical Hodgkin lymphoma. Clin Cancer Res. 2013;19:6812–9. doi: 10.1158/1078-0432.CCR-13-1879. [DOI] [PMC free article] [PubMed] [Google Scholar]
- 12.Schwab U, Stein H, Gerdes J, Lemke H, Kirchner H, Schaadt M, et al. Production of a monoclonal antibody specific for Hodgkin and Sternberg-Reed cells of Hodgkin’s disease and a subset of normal lymphoid cells. Nature. 1982;299:65–7. doi: 10.1038/299065a0. [DOI] [PubMed] [Google Scholar]
- 13.Falini B, Pileri S, Pizzolo G, Durkop H, Flenghi L, Stirpe F, et al. CD30 (Ki-1) molecule: a new cytokine receptor of the tumor necrosis factor receptor superfamily as a tool for diagnosis and immunotherapy. Blood. 1995;85:1–14. [PubMed] [Google Scholar]
- 14.Josimovic-Alasevic O, Durkop H, Schwarting R, Backe E, Stein H, Diamantstein T. Ki-1 (CD30) antigen is released by Ki-1-positive tumor cells in vitro and in vivo. I. Partial characterization of soluble Ki-1 antigen and detection of the antigen in cell culture supernatants and in serum by an enzyme-linked immunosorbent assay. Eur J Immunol. 1989;19:157–62. doi: 10.1002/eji.1830190125. [DOI] [PubMed] [Google Scholar]
- 15.Kishimoto T. The biology of interleukin-6. Blood. 1989;74:1–10. [PubMed] [Google Scholar]
- 16.Jucker M, Abts H, Li W, Schindler R, Merz H, Gunther A, et al. Expression of interleukin-6 and interleukin-6 receptor in Hodgkin’s disease. Blood. 1991;77:2413–8. [PubMed] [Google Scholar]
- 17.Cozen W, Gill PS, Ingles SA, Masood R, Martinez-Maza O, Cockburn MG, et al. IL-6 levels and genotype are associated with risk of young adult Hodgkin lymphoma. Blood. 2004;103:3216–21. doi: 10.1182/blood-2003-08-2860. [DOI] [PubMed] [Google Scholar]
- 18.Moore KW, de Waal Malefyt R, Coffman RL, O’Garra A. Interleukin-10 and the interleukin-10 receptor. Ann Rev Immun. 2001;19:683–765. doi: 10.1146/annurev.immunol.19.1.683. [DOI] [PubMed] [Google Scholar]
- 19.Lucey DR, Clerici M, Shearer GM. Type 1 and type 2 cytokine dysregulation in human infectious, neoplastic, and inflammatory diseases. Clin Microbiol Rev. 1996;9:532–62. doi: 10.1128/cmr.9.4.532. [DOI] [PMC free article] [PubMed] [Google Scholar]
- 20.Pfreundschuh M, Pohl C, Berenbeck C, Schroeder J, Jung W, Schmits R, et al. Detection of a soluble form of the CD30 antigen in sera of patients with lymphoma, adult T-cell leukemia and infectious mononucleosis. Int J Cancer. 1990;45:869–74. doi: 10.1002/ijc.2910450515. [DOI] [PubMed] [Google Scholar]
- 21.Pizzolo G, Vinante F, Chilosi M, Dallenbach F, Josimovic-Alasevic O, Diamantstein T, et al. Serum levels of soluble CD30 molecule (Ki-1 antigen) in Hodgkin’s disease: relationship with disease activity and clinical stage. Br J Haematol. 1990;75:282–4. doi: 10.1111/j.1365-2141.1990.tb02664.x. [DOI] [PubMed] [Google Scholar]
- 22.Nadali G, Vinante F, Ambrosetti A, Todeschini G, Veneri D, Zanotti R, et al. Serum levels of soluble CD30 are elevated in the majority of untreated patients with Hodgkin’s disease and correlate with clinical features and prognosis. J Clin Oncol. 1994;12:793–7. doi: 10.1200/JCO.1994.12.4.793. [DOI] [PubMed] [Google Scholar]
- 23.Gause A, Scholz R, Klein S, Jung W, Diehl V, Tesch H, et al. Increased levels of circulating interleukin-6 in patients with Hodgkin’s disease. Hematol Oncol. 1991;9:307–13. doi: 10.1002/hon.2900090605. [DOI] [PubMed] [Google Scholar]
- 24.Kurzrock R, Redman J, Cabanillas F, Jones D, Rothberg J, Talpaz M. Serum interleukin 6 levels are elevated in lymphoma patients and correlate with survival in advanced Hodgkin’s disease and with B symptoms. Cancer Res. 1993;53:2118–22. [PubMed] [Google Scholar]
- 25.Blay JY, Farcet JP, Lavaud A, Radoux D, Chouaib S. Serum concentrations of cytokines in patients with Hodgkin’s disease. Eur J Cancer. 1994;30A:321–4. doi: 10.1016/0959-8049(94)90249-6. [DOI] [PubMed] [Google Scholar]
- 26.Gorschluter M, Bohlen H, Hasenclever D, Diehl V, Tesch H. Serum cytokine levels correlate with clinical parameters in Hodgkin’s disease. Ann Oncol. 1995;6:477–82. doi: 10.1093/oxfordjournals.annonc.a059218. [DOI] [PubMed] [Google Scholar]
- 27.Seymour JF, Talpaz M, Hagemeister FB, Cabanillas F, Kurzrock R. Clinical correlates of elevated serum levels of interleukin 6 in patients with untreated Hodgkin’s disease. Am J Med. 1997;102:21–8. doi: 10.1016/s0002-9343(96)00352-x. [DOI] [PubMed] [Google Scholar]
- 28.da Silva PB, Perini GF, de Andrade Pereira L, Sacconato EM, Penna AMD, Garibaldi J, et al. Imbalance of pro- and anti-inflammatory cytokines in patients with cHL persists despite treatment compared with control subjects. Clin Lymphoma Myeloma Leuk. 2015;15(Supplement):S151–S7. doi: 10.1016/j.clml.2015.02.002. [DOI] [PubMed] [Google Scholar]
- 29.Sarris AH, Kliche KO, Pethambaram P, Preti A, Tucker S, Jackow C, et al. Interleukin-10 levels are often elevated in serum of adults with Hodgkin’s disease and are associated with inferior failure-free survival. Ann Oncol. 1999;10:433–40. doi: 10.1023/a:1008301602785. [DOI] [PubMed] [Google Scholar]
- 30.Bohlen H, Kessler M, Sextro M, Diehl V, Tesch H. Poor clinical outcome of patients with Hodgkin’s disease and elevated interleukin-10 serum levels. Clinical significance of interleukin-10 serum levels for Hodgkin’s disease. Ann Hematol. 2000;79:110–3. doi: 10.1007/s002770050564. [DOI] [PubMed] [Google Scholar]
- 31.Waldmann TA, Bull JM, Bruce RM, Broder S, Jost MC, Balestra ST, et al. Serum immunoglobulin E levels in patients with neoplastic disease. J Immunol. 1974;113:379–86. [PubMed] [Google Scholar]
- 32.Amlot PL, Green LA. Atopy and immunoglobulin E concentrations in Hodgkin’s disease and other lymphomas. Br Med J. 1978;1:327–9. doi: 10.1136/bmj.1.6109.327. [DOI] [PMC free article] [PubMed] [Google Scholar]
- 33.Levin LI, Chang ET, Ambinder RF, Lennette ET, Rubertone MV, Mann RB, et al. Atypical prediagnosis Epstein-Barr virus serology restricted to EBV-positive Hodgkin lymphoma. Blood. 2012;120:3750–5. doi: 10.1182/blood-2011-12-390823. [DOI] [PMC free article] [PubMed] [Google Scholar]
- 34.Perdue CL, Eick Cost AA, Rubertone MV, Lindler LE, Ludwig SL. Description and utilization of the United States Department of Defense Serum Repository: a review of published studies, 1985–2012. PLoS One. 2015;10:e0114857. doi: 10.1371/journal.pone.0114857. [DOI] [PMC free article] [PubMed] [Google Scholar]
- 35.Rubertone MV, Brundage JF. The Defense Medical Surveillance System and the Department of Defense Serum Repository: glimpses of the future of public health surveillance. Am J Public Health. 2002;92:1900–4. doi: 10.2105/ajph.92.12.1900. [DOI] [PMC free article] [PubMed] [Google Scholar]
- 36.Breen EC, Hussain SK, Magpantay L, Jacobson LP, Detels R, Rabkin CS, et al. B-cell stimulatory cytokines and markers of immune activation are elevated several years prior to the diagnosis of systemic AIDS-associated non-Hodgkin B-cell lymphoma. Cancer Epidemiol Biomarkers Prev. 2011;20:1303–14. doi: 10.1158/1055-9965.EPI-11-0037. [DOI] [PMC free article] [PubMed] [Google Scholar]
- 37.Breen EC, Boscardin WJ, Detels R, Jacobson LP, Smith MW, O’Brien SJ, et al. Non-Hodgkin’s B cell lymphoma in persons with acquired immunodeficiency syndrome is associated with increased serum levels of IL10, or the IL10 promoter -592 C/C genotype. Clin Immunol. 2003;109:119–29. doi: 10.1016/s1521-6616(03)00214-6. [DOI] [PubMed] [Google Scholar]
- 38.Wu TC, Mann RB, Charache P, Hayward SD, Staal S, Lambe BC, et al. Detection of EBV gene expression in Reed-Sternberg cells of Hodgkin’s disease. Int J Cancer. 1990;46:801–4. doi: 10.1002/ijc.2910460509. [DOI] [PubMed] [Google Scholar]
- 39.Ambinder RF, Mann RB. Epstein-Barr-encoded RNA in situ hybridization: diagnostic applications. Hum Pathol. 1994;25:602–5. doi: 10.1016/0046-8177(94)90227-5. [DOI] [PubMed] [Google Scholar]
- 40.Pallesen G, Hamilton-Dutoit SJ, Rowe M, Young LS. Expression of Epstein-Barr virus latent gene products in tumour cells of Hodgkin’s disease. Lancet. 1991;337:320–2. doi: 10.1016/0140-6736(91)90943-j. [DOI] [PubMed] [Google Scholar]
- 41.Gulley ML, Glaser SL, Craig FE, Borowitz M, Mann RB, Shema SJ, et al. Guidelines for interpreting EBER in situ hybridization and LMP1 immunohistochemical tests for detecting Epstein-Barr virus in Hodgkin lymphoma. Am J Clin Pathol. 2002;117:259–67. doi: 10.1309/MMAU-0QYH-7BHA-W8C2. [DOI] [PubMed] [Google Scholar]
- 42.Liang K-Y, Zeger SL. Longitudinal data analysis using generalized linear models. Biometrika. 1986;73:13–22. [Google Scholar]
- 43.Gruss HJ, Ulrich D, Dower SK, Herrmann F, Brach MA. Activation of Hodgkin cells via the CD30 receptor induces autocrine secretion of interleukin-6 engaging the NF-kappabeta transcription factor. Blood. 1996;87:2443–9. [PubMed] [Google Scholar]
- 44.Axdorph U, Porwit-MacDonald A, Sjoberg J, Grimfors G, Ekman M, Wang W, et al. Epstein-Barr virus expression in Hodgkin’s disease in relation to patient characteristics, serum factors and blood lymphocyte function. Br J Cancer. 1999;81:1182–7. doi: 10.1038/sj.bjc.6690827. [DOI] [PMC free article] [PubMed] [Google Scholar]
- 45.Breen EC, Fatahi S, Epeldegui M, Boscardin WJ, Detels R, Martinez-Maza O. Elevated serum soluble CD30 precedes the development of AIDS-associated non-Hodgkin’s B cell lymphoma. Tumour Biol. 2006;27:187–94. doi: 10.1159/000093022. [DOI] [PubMed] [Google Scholar]
- 46.Purdue MP, Lan Q, Martinez-Maza O, Oken MM, Hocking W, Huang WY, et al. A prospective study of serum soluble CD30 concentration and risk of non-Hodgkin lymphoma. Blood. 2009;114:2730–2. doi: 10.1182/blood-2009-04-217521. [DOI] [PMC free article] [PubMed] [Google Scholar]
- 47.Vermeulen R, Hosnijeh FS, Portengen L, Krogh V, Palli D, Panico S, et al. Circulating soluble CD30 and future risk of lymphoma; evidence from two prospective studies in the general population. Cancer Epidemiol Biomarkers Prev. 2011;20:1925–7. doi: 10.1158/1055-9965.EPI-11-0396. [DOI] [PubMed] [Google Scholar]
- 48.Annunziato F, Cosmi L, Liotta F, Maggi E, Romagnani S. The phenotype of human Th17 cells and their precursors, the cytokines that mediate their differentiation and the role of Th17 cells in inflammation. Int Immunol. 2008;20:1361–8. doi: 10.1093/intimm/dxn106. [DOI] [PubMed] [Google Scholar]
- 49.Herbst H, Samol J, Foss HD, Raff T, Niedobitek G. Modulation of interleukin-6 expression in Hodgkin and Reed-Sternberg cells by Epstein-Barr virus. J Pathol. 1997;182:299–306. doi: 10.1002/(SICI)1096-9896(199707)182:3<299::AID-PATH856>3.0.CO;2-8. [DOI] [PubMed] [Google Scholar]
- 50.Beck A, Pazolt D, Grabenbauer GG, Nicholls JM, Herbst H, Young LS, et al. Expression of cytokine and chemokine genes in Epstein-Barr virus-associated nasopharyngeal carcinoma: comparison with Hodgkin’s disease. J Pathol. 2001;194:145–51. doi: 10.1002/path.867. [DOI] [PubMed] [Google Scholar]
- 51.Reynolds GM, Billingham LJ, Gray LJ, Flavell JR, Najafipour S, Crocker J, et al. Interleukin 6 expression by Hodgkin/Reed-Sternberg cells is associated with the presence of ‘B’ symptoms and failure to achieve complete remission in patients with advanced Hodgkin’s disease. Br J Haematol. 2002;118:195–201. doi: 10.1046/j.1365-2141.2002.03575.x. [DOI] [PubMed] [Google Scholar]
- 52.Biggar RJ, Johansen JS, Smedby KE, Rostgaard K, Chang ET, Adami HO, et al. Serum YKL-40 and interleukin 6 levels in Hodgkin lymphoma. Clin Cancer Res. 2008;14:6974–8. doi: 10.1158/1078-0432.CCR-08-1026. [DOI] [PMC free article] [PubMed] [Google Scholar]
- 53.Cordano P, Lake A, Shield L, Taylor GM, Alexander FE, Taylor PR, et al. Effect of IL-6 promoter polymorphism on incidence and outcome in Hodgkin’s lymphoma. Br J Haematol. 2005;128:493–5. doi: 10.1111/j.1365-2141.2004.05353.x. [DOI] [PubMed] [Google Scholar]
- 54.Samoszuk M. IgE in Reed-Sternberg cells of Hodgkin’s disease with eosinophilia. Blood. 1992;79:1518–22. [PubMed] [Google Scholar]
- 55.McCormick DP, Ammann AJ, Ishizaka K, Miller DG, Hong R. A study of allergy in patients with malignant lymphoma and chronic lymphocytic leukemia. Cancer. 1971;27:93–9. doi: 10.1002/1097-0142(197101)27:1<93::aid-cncr2820270114>3.0.co;2-0. [DOI] [PubMed] [Google Scholar]
- 56.Becker N, de Sanjose S, Nieters A, Maynadié M, Foretova L, Cocco PL, et al. Birth order, allergies and lymphoma risk: Results of the European collaborative research project Epilymph. Leuk Res. 2007;31:1365–72. doi: 10.1016/j.leukres.2007.02.019. [DOI] [PubMed] [Google Scholar]
- 57.Soderberg KC, Jonsson F, Winqvist O, Hagmar L, Feychting M. Autoimmune diseases, asthma and risk of haematological malignancies: a nationwide case-control study in Sweden. Eur J Cancer. 2006;42:3028–33. doi: 10.1016/j.ejca.2006.04.021. [DOI] [PubMed] [Google Scholar]
- 58.Espinosa A, Zock JP, Benavente Y, Boffetta P, Becker N, Brennan P, et al. Occupational exposure to immunologically active agents and risk for lymphoma: the European Epilymph case-control study. Cancer Epidemiol. 2013;37:378–84. doi: 10.1016/j.canep.2013.02.006. [DOI] [PubMed] [Google Scholar]
- 59.Hollander P, Rostgaard K, Smedby KE, Chang ET, Amini RM, de Nully Brown P, et al. Autoimmune and atopic disorders and risk of classical Hodgkin lymphoma. Am J Epidemiol. 2015;182:624–32. doi: 10.1093/aje/kwv081. [DOI] [PMC free article] [PubMed] [Google Scholar]
- 60.Ellison-Loschmann L, Benavente Y, Douwes J, Buendia E, Font R, Alvaro T, et al. Immunoglobulin E levels and risk of lymphoma in a case-control study in Spain. Cancer Epidemiol Biomarkers Prev. 2007;16:1492–8. doi: 10.1158/1055-9965.EPI-07-0176. [DOI] [PubMed] [Google Scholar]
- 61.Levy Y, Brouet JC. Interleukin-10 prevents spontaneous death of germinal center B cells by induction of the bcl-2 protein. J Clin Invest. 1994;93:424–8. doi: 10.1172/JCI116977. [DOI] [PMC free article] [PubMed] [Google Scholar]
- 62.Ohshima K, Suzumiya J, Akamatu M, Takeshita M, Kikuchi M. Human and viral interleukin-10 in Hodgkin’s disease, and its influence on CD4+ and CD8+ T lymphocytes. Int J Cancer. 1995;62:5–10. doi: 10.1002/ijc.2910620103. [DOI] [PubMed] [Google Scholar]
- 63.Herbst H, Foss HD, Samol J, Araujo I, Klotzbach H, Krause H, et al. Frequent expression of interleukin-10 by Epstein-Barr virus-harboring tumor cells of Hodgkin’s disease. Blood. 1996;87:2918–29. [PubMed] [Google Scholar]
- 64.Dukers DF, Jaspars LH, Vos W, Oudejans JJ, Hayes D, Cillessen S, et al. Quantitative immunohistochemical analysis of cytokine profiles in Epstein-Barr virus-positive and -negative cases of Hodgkin’s disease. J Pathol. 2000;190:143–9. doi: 10.1002/(SICI)1096-9896(200002)190:2<143::AID-PATH519>3.0.CO;2-5. [DOI] [PubMed] [Google Scholar]
- 65.Herling M, Rassidakis GZ, Medeiros LJ, Vassilakopoulos TP, Kliche KO, Nadali G, et al. Expression of Epstein-Barr virus latent membrane protein-1 in Hodgkin and Reed-Sternberg cells of classical Hodgkin’s lymphoma: associations with presenting features, serum interleukin 10 levels, and clinical outcome. Clin Cancer Res. 2003;9:2114–20. [PubMed] [Google Scholar]
- 66.Hohaus S, Giachelia M, Massini G, Vannata B, Criscuolo M, Martini M, et al. Clinical significance of interleukin-10 gene polymorphisms and plasma levels in Hodgkin lymphoma. Leuk Res. 2009;33:1352–6. doi: 10.1016/j.leukres.2009.01.009. [DOI] [PubMed] [Google Scholar]
- 67.Monroy CM, Cortes AC, Lopez M, Rourke E, Etzel CJ, Younes A, et al. Hodgkin lymphoma risk: role of genetic polymorphisms and gene-gene interactions in DNA repair pathways. Mol Carcinog. 2011;50:825–34. doi: 10.1002/mc.20747. [DOI] [PMC free article] [PubMed] [Google Scholar]
- 68.Yri OE, Ekstrøm PO, Hilden V, Gaudernack G, Liestøl K, Smeland EB, et al. Polymorphisms in genes encoding interleukin-10 and drug metabolizing enzymes GSTP1, GSTT1, GSTA1 and UGT1A1 influence risk and outcome in Hodgkin lymphoma. Leuk Lymphoma. 2012;53:1934–44. doi: 10.3109/10428194.2012.682307. [DOI] [PubMed] [Google Scholar]
- 69.Urayama KY, Jarrett RF, Hjalgrim H, Diepstra A, Kamatani Y, Chabrier A, et al. Genome-wide association study of classical Hodgkin lymphoma and Epstein-Barr virus status-defined subgroups. J Natl Cancer Inst. 2012;104:240–253. doi: 10.1093/jnci/djr516. [DOI] [PMC free article] [PubMed] [Google Scholar]